Did you know that the average day trader spends more time glued to their screens than a kid binge-watching their favorite series? In the fast-paced world of day trading, understanding patterns is crucial for success. This article dives into the most common day trading patterns and how to identify optimal entry and exit points. It explores the significance of candlestick patterns, volume, and key technical indicators, while also emphasizing the importance of support and resistance levels. Additionally, you'll learn how news events can impact trading, the psychological factors at play, and effective risk management strategies. By the end, you'll see how backtesting and adapting your approach to market conditions can enhance your day trading journey—brought to you by DayTradingBusiness.
What are the most common day trading patterns?
The most common day trading patterns include:
1. Bull Flags: A strong price move followed by a consolidation period, signaling a continuation upward.
2. Bear Flags: A downward price move followed by a consolidation, indicating a potential further decline.
3. Head and Shoulders: A reversal pattern signaling a trend change; it can be either bullish or bearish.
4. Double Tops and Bottoms: Two peaks or troughs at similar price levels, indicating potential reversals.
5. Triangles: Patterns formed by converging trendlines, which can signal continuation or reversal depending on the breakout direction.
6. Cup and Handle: A bullish continuation pattern resembling a cup followed by a consolidation (the handle) before a breakout.
Identifying these patterns can help time your entries and exits effectively.
How do I identify entry points in day trading?
To identify entry points in day trading, focus on these key strategies:
1. Support and Resistance Levels: Look for price levels where the stock has historically bounced or reversed. Enter when the price approaches a support level or breaks above resistance.
2. Chart Patterns: Recognize patterns like flags, triangles, or head and shoulders. Enter trades when these patterns confirm a breakout.
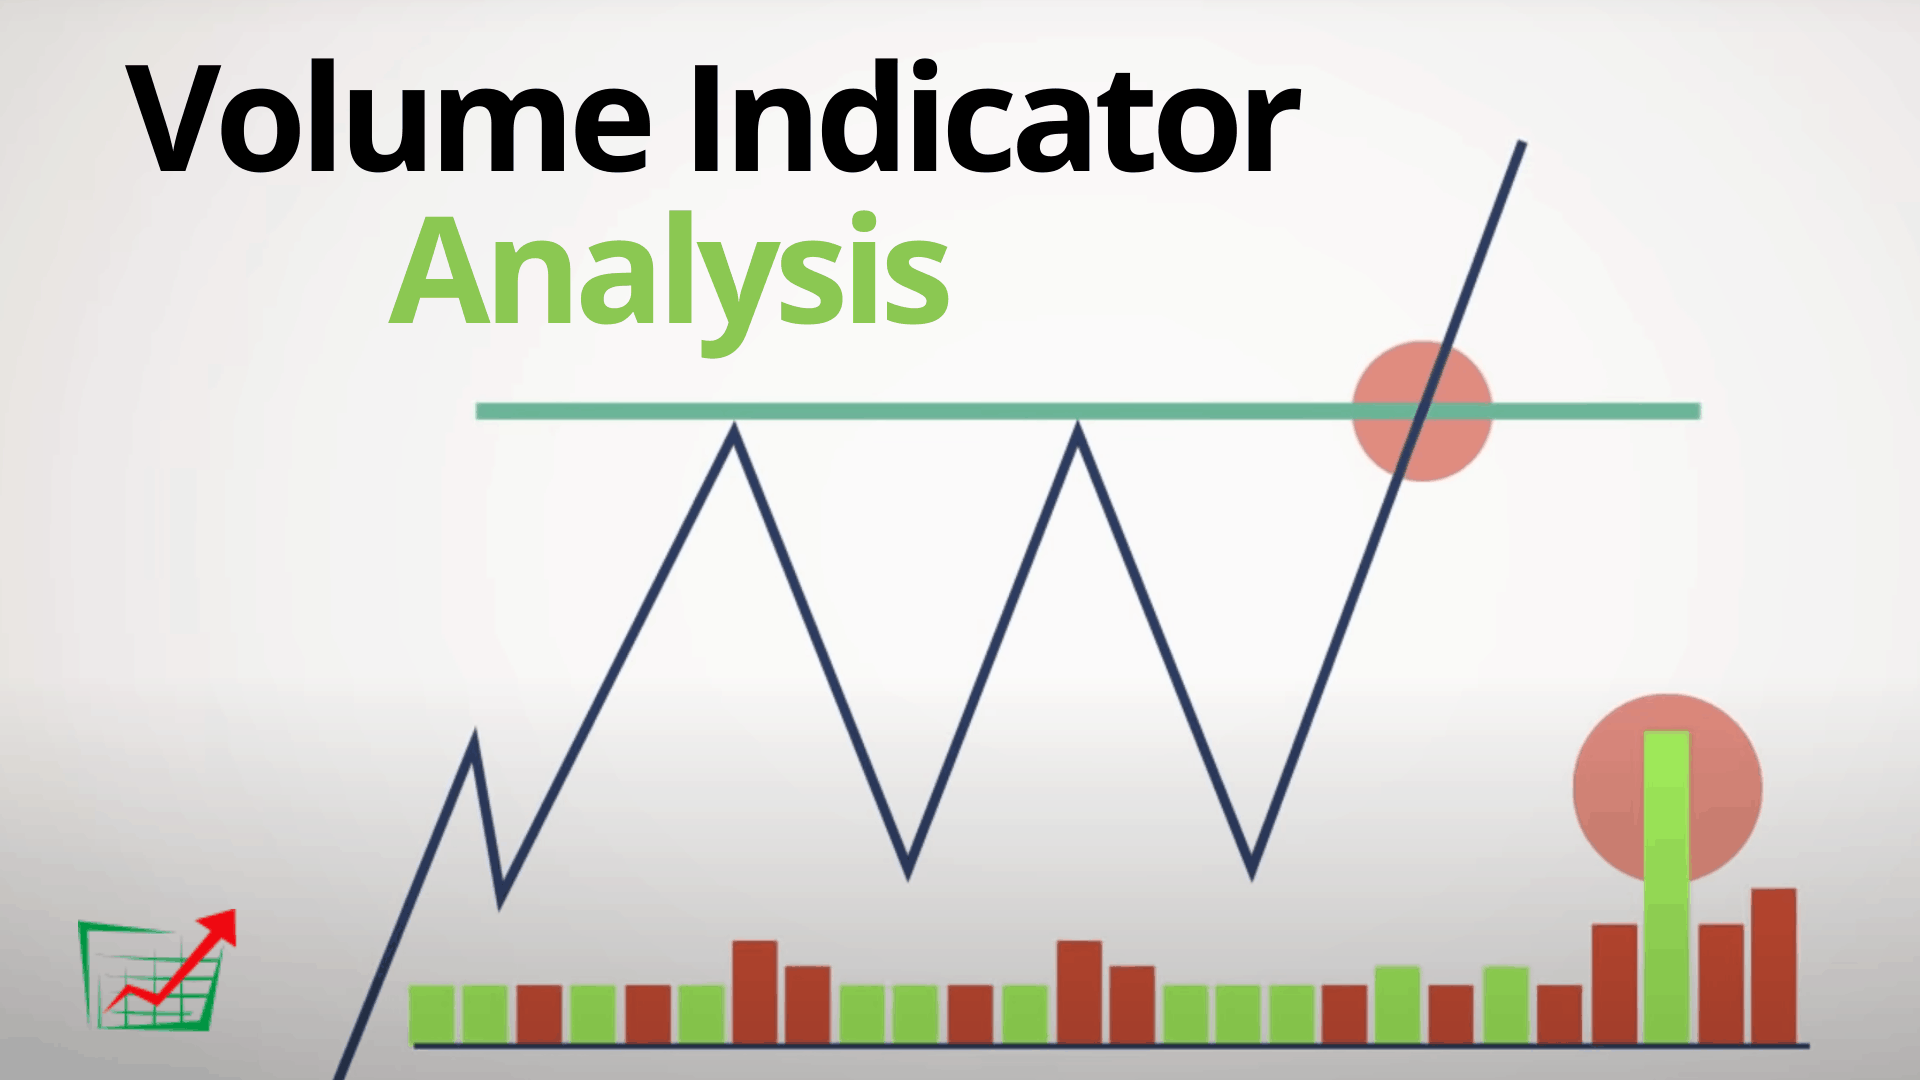
3. Volume Analysis: Monitor volume spikes that accompany price movements. High volume on a breakout suggests strength, signaling a good entry point.
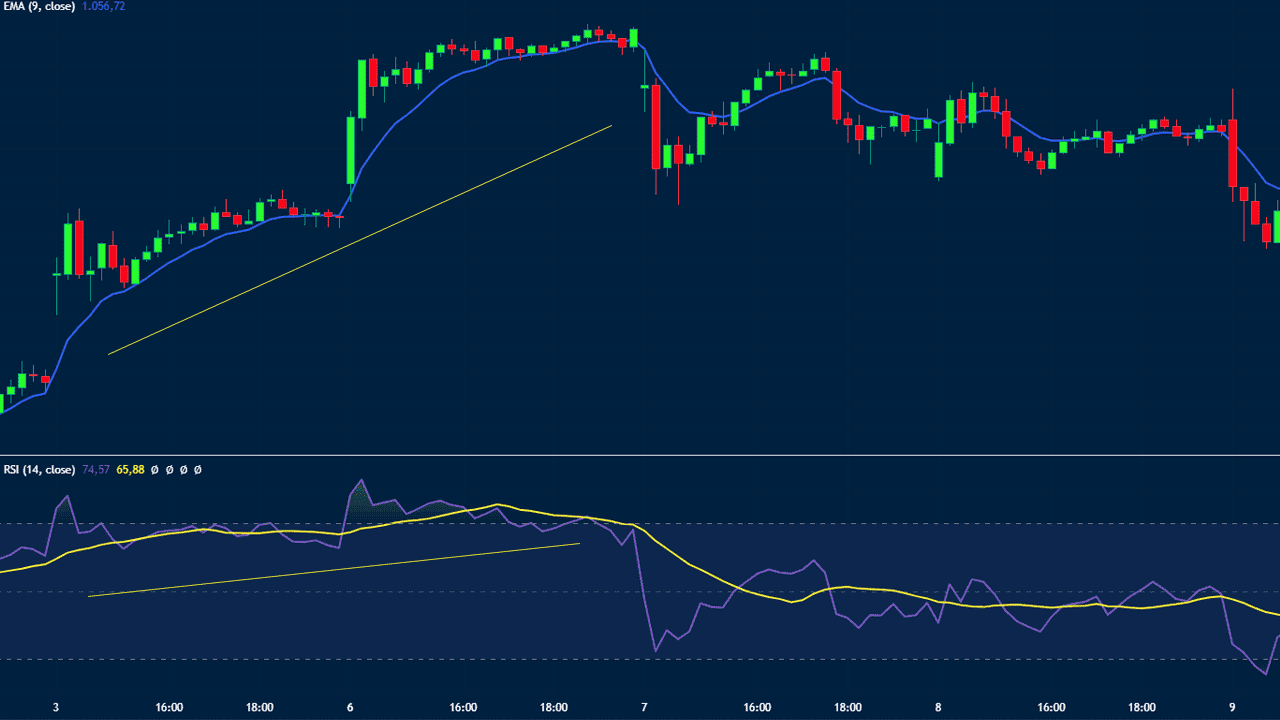
4. Technical Indicators: Use indicators like moving averages or the Relative Strength Index (RSI). For example, enter a trade when the price crosses above a moving average.
5. News and Events: Pay attention to news releases or earnings reports. Enter trades that align with positive news momentum or market sentiment.
6. Candlestick Patterns: Watch for bullish candlestick patterns like engulfing or hammer formations, which can signal potential entry points.
Combine these strategies for more reliable entries in your day trading.
What are effective exit strategies for day trading?
Effective exit strategies for day trading include setting a predetermined profit target and a stop-loss level. Use trailing stops to lock in profits as the price moves in your favor. Consider scaling out of your position by selling portions at different price levels. Monitor key support and resistance levels to identify when to exit. Additionally, use technical indicators like moving averages or RSI to signal exit points. Always assess market conditions and adjust your strategy accordingly.
How can I use candlestick patterns in day trading?
To use candlestick patterns in day trading, focus on key formations like doji, engulfing, and hammer. Look for these patterns at significant support and resistance levels to time your entries and exits. For example, a bullish engulfing pattern at support suggests a potential upward move, making it a good entry point. Conversely, a bearish engulfing at resistance signals a possible drop, indicating an exit or short opportunity. Always combine candlestick patterns with volume analysis and other indicators for confirmation before making trades.
What role does volume play in day trading patterns?

Volume is crucial in day trading patterns as it indicates the strength of a price movement. High volume often confirms trends, signaling that a breakout or reversal is more likely to hold. Conversely, low volume can suggest weak movements, making patterns less reliable. Traders use volume to time entries and exits, ensuring they act when interest is strong, which increases the chances of successful trades.
How do I time my trades effectively in day trading?
To time your trades effectively in day trading, focus on these key strategies:
1. Use Technical Analysis: Identify patterns like breakouts or reversals on charts. Look for support and resistance levels to determine entry and exit points.
2. Monitor Volume: High trading volume can indicate strong momentum. Enter trades when volume spikes at key levels to confirm your analysis.
3. Set Specific Criteria: Establish clear rules for when to buy or sell based on indicators like moving averages or RSI (Relative Strength Index).
4. Watch Market News: Stay updated on economic reports or news that can impact stock prices. Timing your trades around these events can improve your entry and exit points.
5. Utilize Stop-Loss Orders: Protect your capital by setting stop-loss orders to limit losses and allow the trade to run if it moves in your favor.
6. Practice Patience: Wait for the right setup rather than forcing trades. Stick to your strategy and avoid emotional decisions.
By combining these techniques, you can enhance your timing for entries and exits in day trading.
What are reversal patterns in day trading?
Reversal patterns in day trading signal a potential change in trend direction. Common reversal patterns include the head and shoulders, double tops and bottoms, and triple tops and bottoms. Traders look for these formations to time their entries and exits effectively. Recognizing these patterns can help identify when to buy or sell, maximizing profit opportunities.
How can moving averages assist in timing entries and exits?
Moving averages help in timing entries and exits by smoothing out price data, making trends clearer. Traders often use the crossover strategy—buying when a short-term moving average crosses above a long-term moving average and selling when it crosses below. This signals potential trend reversals. Additionally, moving averages can act as dynamic support or resistance levels; prices bouncing off these lines can indicate entry points. Using moving averages alongside other indicators can enhance decision-making in day trading.
What is the significance of support and resistance levels in day trading?
Support and resistance levels are crucial in day trading as they indicate where prices may reverse or stall. Support levels are price points where buying interest is strong enough to overcome selling pressure, while resistance levels are where selling interest exceeds buying pressure. Traders use these levels to time entries and exits, setting buy orders near support and sell orders near resistance. Recognizing these levels helps in predicting price movements and managing risk effectively.
How do news events influence day trading patterns?
News events significantly influence day trading patterns by causing volatility and rapid price movements. Traders often react quickly to earnings reports, economic data releases, or geopolitical developments. Positive news can lead to sharp upward trends, prompting traders to enter positions, while negative news often results in sell-offs.
Understanding the timing of these news releases helps traders plan their entries and exits effectively. For instance, trading just before a major announcement can be risky but potentially rewarding if the news aligns with their position. Monitoring the economic calendar and being aware of market sentiment during these events is crucial for successful day trading.
Learn about How News Events Impact Day Trading Decisions
What are the best technical indicators for day trading?

The best technical indicators for day trading include:
1. Moving Averages (MA): Use the 50-day and 200-day MAs to identify trends.
2. Relative Strength Index (RSI): Look for overbought or oversold conditions to time entries and exits.
3. Bollinger Bands: These help gauge volatility and potential price reversals.
4. MACD (Moving Average Convergence Divergence): Use it to spot momentum shifts.
5. Volume: Analyze volume spikes to confirm price movements.
Combine these indicators to enhance your day trading strategy and improve your timing on entries and exits.
How can I manage risk when timing my trades?
To manage risk when timing your trades, set a clear stop-loss for each position based on your risk tolerance. Use technical analysis to identify key support and resistance levels for better entry and exit points. Implement a risk-reward ratio of at least 1:2, ensuring potential gains outweigh potential losses. Diversify your trades to spread risk and avoid overexposure in a single asset. Stay informed about market news that may impact price movements and adjust your strategies accordingly. Finally, review your trades regularly to learn from both successes and mistakes.
Learn about How to manage leverage risk when day trading?
What psychological factors affect timing in day trading?
Psychological factors that affect timing in day trading include fear, greed, overconfidence, and loss aversion. Fear can lead to premature exits, while greed may cause traders to hold onto positions too long. Overconfidence can result in taking excessive risks, impacting entry and exit timing. Loss aversion often results in holding losing trades longer, hoping to break even. Additionally, emotional responses to market fluctuations can cloud judgment, causing impulsive decisions that disrupt trading strategies.
How can backtesting improve my day trading strategy?

Backtesting helps improve your day trading strategy by allowing you to test your entry and exit points against historical data. It reveals which patterns are profitable and which aren't, helping you refine your approach. By analyzing past trades, you can identify optimal timing for entries and exits, minimizing risk and maximizing gains. Additionally, backtesting provides insights into market conditions, enabling you to adjust your strategy for different scenarios. This data-driven analysis enhances your confidence in making real-time decisions.
Learn about How to Use Backtesting to Improve Your Day Trading Performance
What are the differences between bullish and bearish patterns?
Bullish patterns indicate a potential price increase, signaling traders to consider buying. Examples include the double bottom and ascending triangle. Bearish patterns suggest a potential price decline, prompting traders to think about selling. Common examples are the head and shoulders and descending triangle. In day trading, recognizing these patterns helps time entries and exits effectively.
How do I adapt my trading strategy to different market conditions?
Adapt your trading strategy by analyzing market conditions and adjusting your entries and exits accordingly. In trending markets, focus on breakout patterns and ride the momentum. Use tight stops to protect profits. In choppy or sideways markets, look for reversal patterns and consider range trading strategies. Be flexible with your risk management; tighten your stop-loss in volatile conditions. Monitor volume and news events to gauge market sentiment, and always have a plan for quick exits. Stay disciplined and review your trades to refine your approach.
Learn about How to Adapt Day Trading Patterns to Different Markets
Conclusion about Day Trading Patterns: Timing Your Entries and Exits
In summary, mastering day trading patterns is essential for effective entry and exit timing. By understanding common patterns, utilizing technical indicators, and recognizing the impact of volume and news, traders can enhance their strategies. Incorporating candlestick patterns and moving averages further refines decision-making. Moreover, managing risk and acknowledging psychological factors are crucial for long-term success. For those seeking comprehensive insights and guidance, DayTradingBusiness offers valuable resources to elevate your trading skills.
Learn about How to Time Your Day Trading Entries and Exits
Sources:
- CPC-SAX: Data mining of financial chart patterns with symbolic ...
- Inequality in behavioural heat adaptation: an empirical study with ...
- Professional trader discipline and trade disposition - ScienceDirect
- Liquidity commonality in extreme quantiles: Indian evidence ...
- Divesting under Pressure: U.S. firms' exit in response to Russia's ...