Did you know that candlestick patterns have been around since the 18th century, when they were used in Japan to track rice prices? In the realm of day trading, understanding these patterns is crucial for success. This article dives into the essentials of candlestick patterns, explaining their significance, how to identify bullish and bearish signals, and the role of volume in confirming trends. You'll learn about common patterns, effective entry and exit strategies, and how to combine candlestick analysis with other technical indicators. Additionally, we’ll cover the importance of timeframes, market conditions, and spotting false signals. By the end, you’ll be equipped with strategies to enhance your trading skills. Let DayTradingBusiness guide you through mastering candlestick patterns for a successful day trading experience!
What are candlestick patterns in day trading?
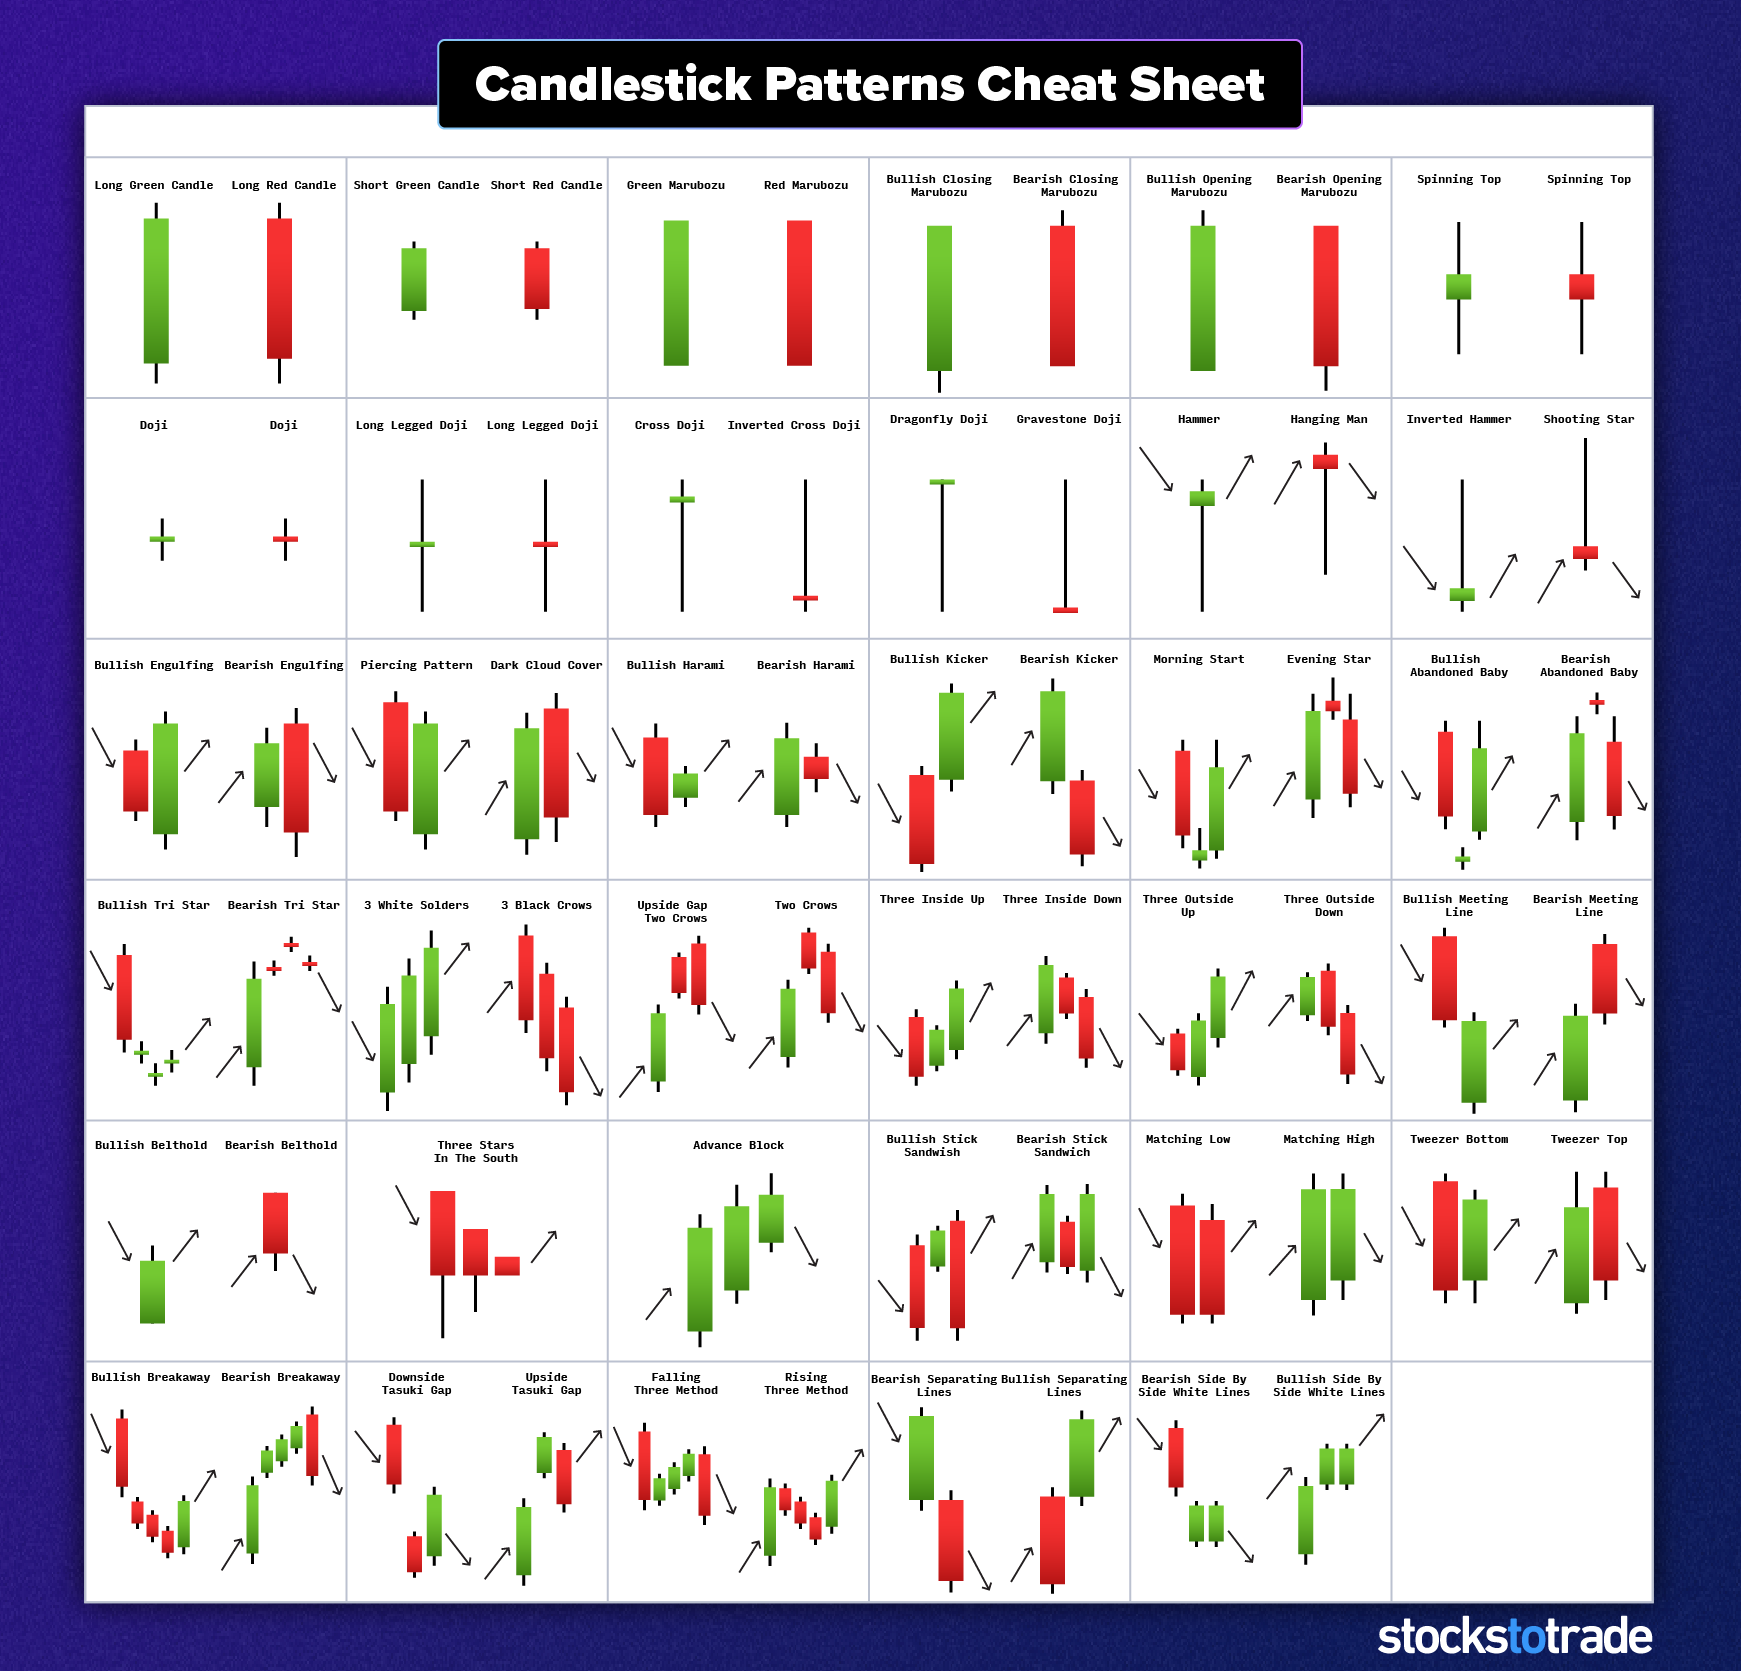
Candlestick patterns in day trading are visual representations of price movements within a specific time frame. Each candlestick shows the open, high, low, and close prices, helping traders identify market trends and reversals. Common patterns include doji, hammer, engulfing, and shooting star, each signaling potential price direction. Analyzing these patterns allows traders to make informed decisions about entry and exit points, enhancing their trading strategy. Understanding these formations is crucial for day trading success.
How do candlestick patterns help in day trading?
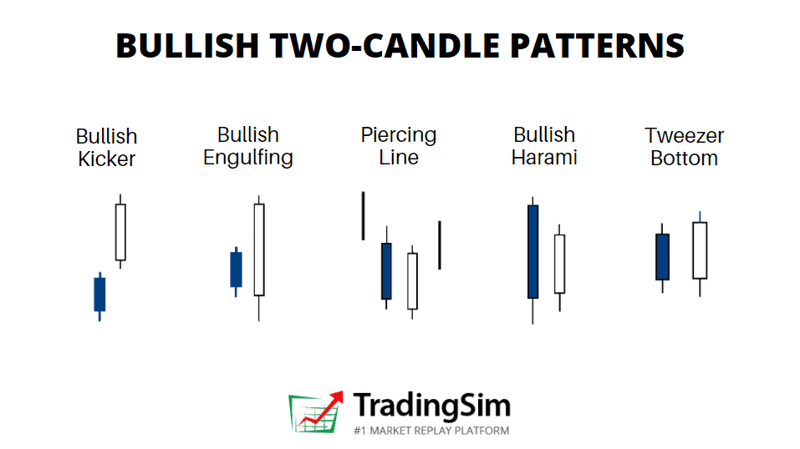
Candlestick patterns help in day trading by providing visual cues about market sentiment and potential price movements. Traders use patterns like dojis, hammers, and engulfing patterns to identify reversals or continuations in trends. Recognizing these patterns can enhance decision-making, allowing traders to enter or exit positions at optimal times. For example, a bullish engulfing pattern may signal a buying opportunity, while a bearish doji could indicate a potential sell. Overall, candlestick patterns serve as valuable tools for analyzing market behavior and improving trading strategies.
What are the most common candlestick patterns to know?
The most common candlestick patterns to know for day trading include:
1. Doji: Indicates indecision in the market.
2. Hammer: Signifies potential reversal after a downtrend.
3. Shooting Star: Suggests a reversal after an uptrend.
4. Engulfing Pattern: Bullish or bearish signal depending on direction, showing strong momentum.
5. Morning Star: A bullish reversal signal after a downtrend.
6. Evening Star: A bearish reversal signal after an uptrend.
7. Bullish/Bearish Harami: Indicates potential reversal based on the previous trend.
These patterns help traders identify potential market movements and make informed decisions.
How can I identify bullish and bearish candlestick patterns?
To identify bullish candlestick patterns, look for formations like the hammer, engulfing, and morning star. These patterns often signal potential upward price movement. For bearish patterns, focus on the shooting star, bearish engulfing, and evening star, indicating possible downward trends.
Pay attention to the context; patterns near support or resistance levels are more significant. Confirm patterns with volume spikes for higher reliability. Use these insights to enhance your day trading strategy.
What does a doji candlestick pattern indicate?
A doji candlestick pattern indicates indecision in the market, where opening and closing prices are nearly the same. It suggests that buyers and sellers are in balance, often signaling a potential reversal or continuation of the trend. In day trading, spotting a doji can help traders make informed decisions about entry or exit points.
How do I use candlestick patterns for entry and exit points?

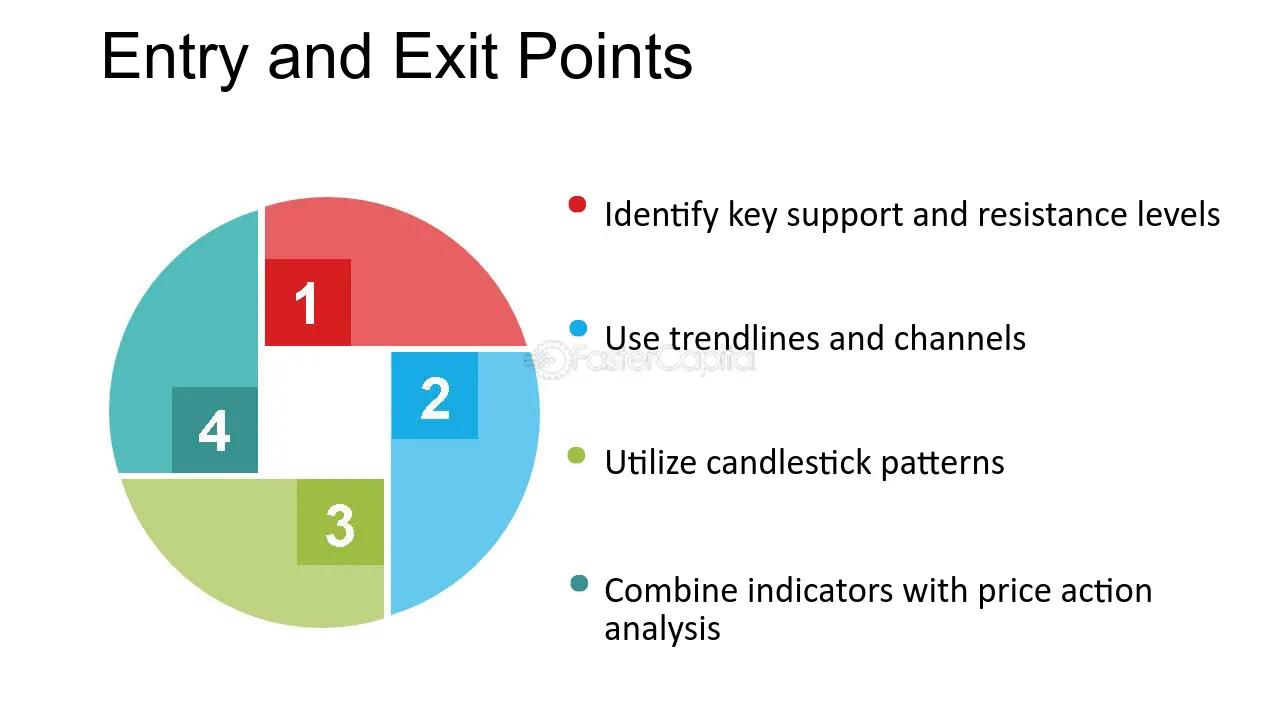
To use candlestick patterns for entry and exit points, start by identifying key patterns like doji, engulfing, or hammer. For entry, look for a bullish pattern at support levels or a bearish pattern at resistance. Confirm signals with volume or other indicators. For exits, use reversal patterns or trailing stops based on recent high or low points. Always combine candlestick analysis with your overall trading strategy for better results.
What is the importance of volume in candlestick patterns?
Volume is crucial in candlestick patterns because it confirms the strength of a price move. High volume during a bullish candlestick indicates strong buying interest, suggesting the trend may continue. Conversely, low volume may signal weakness, making the pattern less reliable. For day trading, understanding volume helps identify potential reversals and continuation signals, enhancing decision-making and risk management. Always consider volume alongside candlestick patterns to gauge market sentiment accurately.
How can I combine candlestick patterns with other technical indicators?
To combine candlestick patterns with other technical indicators, start by using indicators like moving averages or RSI to confirm signals from the candlesticks. For instance, if you see a bullish engulfing pattern, check if the price is above a moving average or if RSI is below 30 to confirm an uptrend.
Additionally, use volume indicators to validate the strength of the candlestick pattern. Higher volume on a breakout enhances its reliability.
You can also apply Bollinger Bands; if a candlestick pattern forms near the lower band, it may indicate a potential reversal. Integrate these tools to enhance your day trading strategy for more informed decisions.
What are reversal candlestick patterns to watch for?
Reversal candlestick patterns indicate potential trend changes in day trading. Key patterns to watch for include:
1. Hammer: Appears after a downtrend, signaling a possible bullish reversal.
2. Shooting Star: Forms after an uptrend, suggesting a bearish reversal.
3. Engulfing Pattern: A larger candle completely engulfs the previous one; bullish if it appears in a downtrend, bearish in an uptrend.
4. Doji: Indicates indecision; a doji at the trend's peak or trough can signal reversal.
5. Morning Star: A three-candle pattern signaling a bullish reversal after a downtrend.
6. Evening Star: A three-candle pattern indicating a bearish reversal after an uptrend.
Monitor these patterns along with volume for stronger signals.
How do I read candlestick charts effectively?
To read candlestick charts effectively, focus on three key components: the body, wicks, and color.
1. Identify the Body: The body shows the opening and closing prices. A filled body indicates a price drop, while a hollow body signifies a price rise.
2. Examine the Wicks: The wicks (or shadows) represent the highest and lowest prices during that period. Long wicks can indicate strong reversals or volatility.
3. Analyze Patterns: Look for specific patterns like Doji, Hammer, or Engulfing. Each pattern provides insights into potential market direction.
4. Combine with Volume: Confirm candlestick signals with volume data. Higher volume on a move strengthens the signal’s reliability.
5. Use Support and Resistance: Place candlestick signals in context of support and resistance levels to gauge potential reversals or breakouts.
Practice consistently and observe how these elements interact to improve your day trading success.
What are continuation candlestick patterns and their significance?

Continuation candlestick patterns signal the likelihood that a trend will continue after a brief pause. Common types include flags, pennants, and triangles. Their significance lies in helping traders identify potential entry points in the direction of the prevailing trend. For instance, after a bullish run, a flag pattern might suggest the price will rise again after a small pullback. Recognizing these patterns can enhance timing and improve day trading strategies.
How can I spot false signals in candlestick patterns?
To spot false signals in candlestick patterns, look for the following indicators:
1. Volume Analysis: Check if the trading volume supports the candlestick pattern. Low volume can indicate a lack of conviction.
2. Confirmation Candles: Wait for additional candles that confirm the initial pattern. A single signal without confirmation increases the chance of a false move.
3. Contextual Analysis: Consider the broader trend. Patterns that contradict the prevailing trend are more likely to be false signals.
4. Support and Resistance Levels: Identify key levels. If a candlestick pattern forms near strong support or resistance, it may not hold.
5. Time Frame: Analyze patterns across multiple time frames. A pattern on a lower time frame may not be significant on a higher time frame.
6. News Events: Be aware of upcoming news that could affect price action. Patterns formed right before major news can be unreliable.
By applying these strategies, you can better filter out false signals in candlestick patterns during day trading.
What is the role of timeframes in analyzing candlestick patterns?
Timeframes in analyzing candlestick patterns are crucial because they determine the context and reliability of the signals. Shorter timeframes, like 1-minute or 5-minute charts, provide quick insights for day trading, capturing rapid price movements. Longer timeframes, such as daily or weekly charts, offer a broader perspective, highlighting trends and key support/resistance levels.
Using multiple timeframes can enhance decision-making; for example, confirming a bullish pattern on a 15-minute chart while the daily trend is up increases confidence. Ultimately, selecting the right timeframe aligns your strategy with your trading goals, impacting entry and exit points effectively.
How do market conditions affect candlestick pattern reliability?

Market conditions significantly impact candlestick pattern reliability. In trending markets, patterns like engulfing and hammer often signal strong reversals or continuations, increasing their reliability. Conversely, in choppy or sideways markets, these patterns can produce false signals due to price unpredictability. High volatility can also lead to erratic price movements, diminishing pattern effectiveness. Thus, evaluating market conditions alongside candlestick patterns is crucial for making informed day trading decisions.
Learn about How Market Conditions Affect HFT Strategies
What strategies can I use with candlestick patterns for day trading?
Use these strategies with candlestick patterns for day trading:
1. Identify Key Patterns: Look for reversal patterns like hammers or engulfing candles, and continuation patterns such as dojis or spinning tops.
2. Confirm with Volume: Ensure that the candlestick patterns are backed by strong volume to validate the signal.
3. Combine with Indicators: Use indicators like moving averages or RSI alongside candlestick patterns for confirmation.
4. Set Entry and Exit Points: Define clear entry points when patterns form and set stop-loss levels to manage risk.
5. Timeframe Focus: Utilize shorter timeframes (like 5-minute or 15-minute charts) for quick trades and immediate patterns.
6. Practice Risk Management: Always use proper risk management techniques to protect your capital.
7. Monitor Market News: Stay aware of economic news that can influence price movements, affecting the reliability of patterns.
Implement these strategies to enhance your day trading effectiveness with candlestick patterns.
Learn about How to use hedging strategies in day trading?
How do I practice analyzing candlestick patterns for better trading?
To practice analyzing candlestick patterns for better trading, start by studying different patterns like doji, hammer, and engulfing. Use a trading simulator to apply your knowledge in real-time without financial risk. Track your trades in a journal, noting when specific patterns led to successful or unsuccessful trades. Analyze historical charts to identify patterns and their outcomes. Join trading forums or groups to discuss patterns with others. Finally, review your findings regularly to refine your strategy.
Conclusion about Analyzing Candlestick Patterns for Day Trading Success
Incorporating candlestick patterns into your day trading strategy can significantly enhance your decision-making process. By understanding the various patterns and their implications, traders can better identify potential entry and exit points, manage risk, and react to market conditions effectively. Remember to combine these patterns with other technical indicators and practice consistently to improve your skills. For more in-depth insights and strategies, explore the resources offered by DayTradingBusiness to elevate your trading success.
Learn about Understanding Candlestick Patterns in Day Trading