Did you know that some traders can predict market movements just by watching the "tape"—essentially the market's live transaction data—like a hawk? In this article, we’ll dive into essential tools for order flow analysis in day trading, covering key indicators and software that can enhance your trading decisions. Discover the significance of volume profiles, Level II data, and footprint charts, alongside the benefits of tape reading tools. We'll also discuss interpreting bid-ask spreads, the importance of time and sales, and how to choose the right trading platform. Plus, learn about effective strategies, common pitfalls to avoid, and valuable resources for mastering order flow analysis. With insights from DayTradingBusiness, you’ll be well-equipped to elevate your trading game.
What are the key tools for order flow analysis in day trading?
Key tools for order flow analysis in day trading include:
1. Level II Data: Provides real-time quotes and market depth, showing the bid and ask prices along with order sizes.
2. Time and Sales (Tape Reading): Displays real-time transactions, helping traders gauge market sentiment and volume.
3. Footprint Charts: Visualizes volume at each price level, revealing buying and selling pressure.
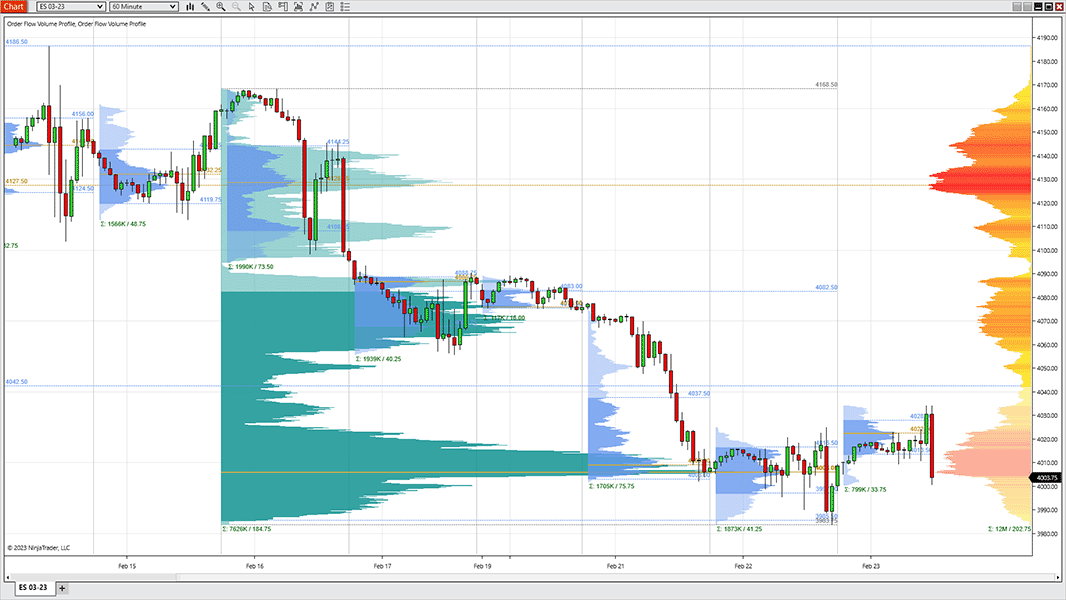
4. Volume Profile: Shows trading volume at various price levels over a specific period, highlighting areas of support and resistance.
5. Order Flow Software: Tools like Sierra Chart or Jigsaw Trading offer advanced features for analyzing order flow and market dynamics.
6. Market Depth Tools: Display pending orders in the order book, helping traders anticipate price movements.
Using these tools effectively can enhance decision-making and improve trading outcomes.
How do order flow indicators help in trading decisions?
Order flow indicators help in trading decisions by providing real-time insights into market activity, such as buy and sell orders. They allow traders to see where the majority of market participants are placing their trades, which can indicate potential price movements. By analyzing this information, traders can identify support and resistance levels, gauge market sentiment, and make more informed entry and exit points. Tools like volume profile, delta, and footprint charts enhance understanding of market dynamics, enabling traders to anticipate trends and adjust strategies accordingly.
What software is best for analyzing order flow in real-time?
The best software for analyzing order flow in real-time includes Sierra Chart, NinjaTrader, and Bookmap. Sierra Chart offers advanced charting and depth of market features. NinjaTrader provides extensive order flow analysis tools with customizable strategies. Bookmap visualizes market depth and order book data effectively. Each option has unique features tailored for day trading, so choose based on your specific needs.
How can I use volume profile in order flow analysis?
To use volume profile in order flow analysis, start by analyzing the volume profile chart to identify key price levels where significant trading occurred. Look for high-volume nodes that represent areas of support or resistance. During your trading, monitor the order flow at these levels to see how buyers and sellers are reacting.
When price approaches these key levels, pay attention to changes in volume and order flow, such as large buy or sell orders. This can indicate potential reversals or continuations. Use this information to make informed trading decisions—entering trades when the order flow aligns with the volume profile signals.
Additionally, combine volume profile insights with other indicators like footprint charts for a clearer picture of market sentiment. This integrated approach helps in making more precise entries and exits in day trading.
What is the role of Level II data in order flow trading?

Level II data provides real-time insights into market depth by showing the order book, including buy and sell orders at various price levels. In order flow trading, it helps traders gauge supply and demand dynamics, identify support and resistance levels, and spot potential reversals. This information allows traders to make informed decisions based on actual market activity rather than relying solely on price movements. By analyzing Level II data, traders can enhance their entry and exit strategies, improving their overall trading effectiveness.
How do footprint charts enhance order flow analysis?
Footprint charts enhance order flow analysis by providing detailed insights into market activity at specific price levels. They display volume, trades, and order types in a visual format, allowing traders to see where buying and selling pressure occurs. This helps identify key support and resistance areas, revealing potential reversals or continuations in price movement. By analyzing the distribution of volume, traders can gauge market sentiment and make more informed decisions. Overall, footprint charts offer a granular view that aids in understanding the dynamics of order flow.
What are the benefits of using a tape reading tool in day trading?
Using a tape reading tool in day trading offers several benefits. It provides real-time insights into market sentiment by revealing actual buy and sell orders. This helps traders identify trends and momentum quickly. Tape reading can enhance decision-making by showing the strength of price movements, allowing for timely entries and exits. It also aids in spotting large trades that may indicate institutional activity, giving a clearer picture of potential market direction. Overall, it improves order flow analysis, leading to more informed trading strategies.
How can I interpret bid-ask spreads for better trades?
To interpret bid-ask spreads for better trades, focus on the following:
1. Spread Size: A narrow spread often indicates high liquidity, making it easier to enter and exit trades quickly. Wide spreads suggest lower liquidity, which can increase trading costs.
2. Market Sentiment: Analyze the spread in relation to price movement. If the bid-ask spread widens, it may signal increased volatility or uncertainty in the market.
3. Order Flow: Monitor the volume of buy and sell orders. A higher volume on the bid side could indicate strong demand, while sell-side volume might suggest selling pressure.
4. Time of Day: Spreads can fluctuate based on market hours. Expect tighter spreads during peak trading times and wider spreads during off-hours.
5. News and Events: Be aware of economic announcements or events that can impact spreads. Significant news can lead to rapid expansion of the spread.
Use these insights to make informed trading decisions and improve your entry and exit strategies.
What is the significance of time and sales in order flow analysis?
Time and sales data is crucial in order flow analysis because it provides real-time insights into market activity. It shows the actual transactions that are occurring, including price, volume, and time of trades. This helps traders gauge market sentiment, identify buying or selling pressure, and spot trends. By analyzing time and sales, day traders can make informed decisions on entry and exit points, enhancing their trading strategies and overall performance.
How do I choose the right trading platform for order flow tools?
To choose the right trading platform for order flow tools, consider these key factors:
1. Features: Look for platforms that offer comprehensive order flow analysis features, such as real-time data, volume profile, and market depth visualization.
2. User Interface: Ensure the platform has an intuitive interface that makes it easy to access and interpret order flow data.
3. Cost: Compare pricing structures. Some platforms charge per trade or monthly fees, while others might offer free trials.
4. Integration: Check if the platform integrates with your existing tools and trading strategies for a seamless experience.
5. Support and Education: Choose a platform that provides good customer support and educational resources to help you understand order flow analysis better.
6. Reviews and Reputation: Research user reviews and ratings to gauge the platform's reliability and performance in order flow trading.
7. Compatibility: Ensure the platform is compatible with your preferred devices, whether it's desktop, tablet, or mobile.
By focusing on these aspects, you can find a trading platform that effectively supports your order flow analysis needs.
Learn about How to Choose the Right Day Trading Platform
What types of order flow strategies can I implement?
You can implement several order flow strategies in day trading, including:
1. Volume Profile Trading: Analyze the volume at different price levels to identify support and resistance areas.
2. Delta Analysis: Examine the difference between buying and selling volume to gauge market sentiment.
3. Order Book Analysis: Monitor real-time buy and sell orders to spot liquidity and potential price movements.
4. Footprint Charts: Use these charts to see how much volume traded at each price level, revealing buyer and seller activity.
5. Liquidity Gaps: Identify areas with low liquidity to anticipate sharp price movements when orders hit the market.
6. Iceberg Orders: Detect large hidden orders to understand institutional trading behavior.
Incorporating these strategies can enhance your trading decisions by providing insights into market dynamics.
How can I integrate order flow analysis with technical indicators?
To integrate order flow analysis with technical indicators in day trading, follow these steps:
1. Choose Your Indicators: Select indicators like moving averages, RSI, or Bollinger Bands that complement your order flow strategy.
2. Analyze Order Flow: Use tools like Level II quotes or footprint charts to observe buying and selling pressure.
3. Identify Confluence: Look for areas where order flow signals (like large buy orders) align with technical indicators (like price bouncing off a moving average).
4. Set Entry and Exit Points: Use order flow to confirm entries suggested by technical indicators, and set stop-loss orders at levels where order flow shows significant support or resistance.
5. Monitor Volume: Pay attention to volume along with price movements. High volume at key technical levels can validate order flow signals.
6. Adjust Strategies: Be flexible; if order flow contradicts technical indicators, reassess your trade.
By combining these elements, you enhance your decision-making with a more comprehensive view of market dynamics.
Learn about How to Incorporate Order Flow Analysis into Your Trading Routine
What are the common mistakes to avoid in order flow trading?
Common mistakes to avoid in order flow trading include:
1. Ignoring market context: Always consider the broader market trends and news events that can influence order flow.
2. Relying solely on indicators: Don't depend exclusively on technical indicators; focus on actual order flow data for decisions.
3. Overtrading: Resist the urge to make too many trades based on minor fluctuations; wait for clear signals.
4. Failing to manage risk: Set stop-loss orders and position sizes to protect against significant losses.
5. Neglecting to analyze volume: Pay attention to volume changes, as they can reveal the strength behind price movements.
6. Lack of a trading plan: Develop and stick to a strategy that incorporates order flow analysis to guide your trades.
7. Emotional trading: Avoid making impulsive decisions based on fear or greed; stay disciplined.
Addressing these mistakes can enhance your effectiveness in order flow trading.
Learn about Common Mistakes in Order Flow Analysis for Day Traders
How does order flow analysis differ from traditional analysis?
Order flow analysis focuses on real-time market data, examining actual buy and sell orders, while traditional analysis relies on historical price charts and indicators. Order flow provides insights into market sentiment and potential price movement by tracking the volume and speed of trades, whereas traditional analysis often emphasizes patterns and trends. Essentially, order flow reveals immediate market dynamics, while traditional methods look at past performance to predict future trends.
Learn about How to Incorporate Order Flow Analysis into Your Trading Routine
What resources are available for learning order flow analysis?
For learning order flow analysis in day trading, consider these resources:
1. Books: "Order Flow Trading for Fun and Profit" by J. J. Kinahan and "The Art of Order Flow Trading" by A. J. P. Reilly are excellent starting points.
2. Online Courses: Websites like Udemy and TradingAcademy offer specialized courses on order flow analysis.
3. Software: Trading platforms like Sierra Chart, NinjaTrader, and MarketDelta provide tools for visualizing order flow.
4. Webinars: Engage in live webinars hosted by experienced traders on platforms like YouTube or TradingView.
5. Forums and Communities: Join forums like Elite Trader or Reddit’s r/Daytrading for discussions and shared insights on order flow techniques.
6. YouTube Channels: Channels like "The Trading Coach" and "Kunal Desai" often cover practical order flow strategies.
7. Simulated Trading: Use demo accounts on platforms like ThinkorSwim to practice order flow analysis in real-time without financial risk.
These resources will deepen your understanding and application of order flow analysis in day trading.
How can I practice order flow analysis effectively?
To practice order flow analysis effectively, focus on these essential tools:
1. Order Flow Software: Use platforms like Sierra Chart or NinjaTrader to visualize real-time order flow data.
2. Footprint Charts: Analyze footprint charts to see volume at specific price levels, helping you identify buying and selling pressure.
3. DOM (Depth of Market): Monitor the DOM to track live bids and asks, giving insight into market depth and potential support/resistance levels.
4. Tape Reading: Pay attention to the time and sales data to understand the speed and volume of trades, which can indicate market sentiment.
5. Volume Profile: Use volume profile tools to identify price levels where significant trading activity occurs, highlighting areas of interest.
6. Practice Trading Simulators: Engage with simulators that offer order flow capabilities, allowing you to experiment without financial risk.
7. Record and Review: Keep a trading journal to review your order flow analysis and outcomes, refining your strategies over time.
By combining these tools and consistent practice, you’ll enhance your order flow analysis skills in day trading.
Learn about How to Incorporate Order Flow Analysis into Your Trading Routine
Conclusion about Essential Tools for Order Flow Analysis in Day Trading
Incorporating the right tools for order flow analysis is crucial for successful day trading. By utilizing order flow indicators, real-time software, volume profiles, and Level II data, traders can make informed decisions that enhance their strategies. Understanding bid-ask spreads and time and sales adds further depth to trading insights. With the right approach and resources, including those offered by DayTradingBusiness, traders can effectively practice and refine their order flow analysis, avoiding common pitfalls and optimizing their trading performance.
Learn about Order Flow Analysis vs. Technical Analysis in Day Trading
Sources:
- The currency that came in from the cold: Capital controls and the ...
- Overallocation and secondary market outcomes in corporate bond ...
- Measuring Treasury Market Liquidity
- A modelling tool selection process for planning of community scale ...
- A profitable trading algorithm for cryptocurrencies using a Neural ...