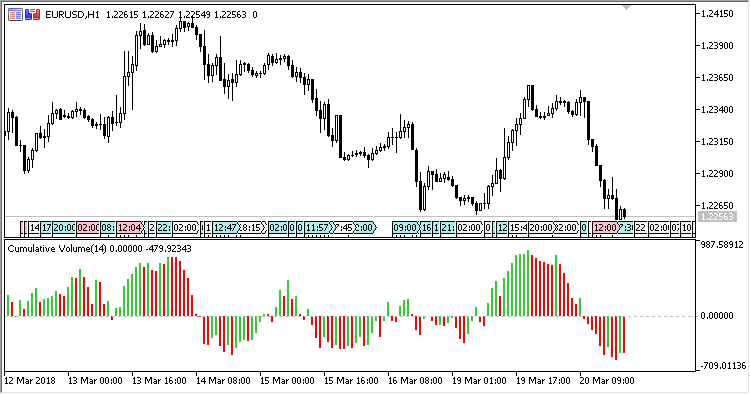
Did you know that volume indicators are like the party guests of the trading world—sometimes they’re packed with energy, and other times, they’re just quiet observers? In this article, we dive into the essential role of volume indicators in day trading, exploring their definition, impact on trading decisions, and key types to utilize. We’ll uncover how they signal market trends, their significance in stock analysis, and effective reading techniques. Additionally, we’ll discuss the differences between volume and price indicators, best practices, and common pitfalls. By combining volume indicators with other tools, you can enhance your strategies and identify breakouts more effectively. Join us as we decode the dynamic relationship between volume and volatility, providing you with advanced techniques to measure their effectiveness. Let’s elevate your trading game with insights from DayTradingBusiness!
What are volume indicators in day trading?
Volume indicators in day trading measure the number of shares or contracts traded in a specific period. Key volume indicators include Volume, On-Balance Volume (OBV), and Accumulation/Distribution. These tools help traders identify trends, confirm price movements, and spot potential reversals. For example, increasing volume with rising prices suggests strong buying interest, while high volume during a price drop may indicate selling pressure. Understanding these indicators can enhance decision-making and improve trading strategies.
How do volume indicators impact trading decisions?
Volume indicators impact trading decisions by providing insights into market strength and potential price movements. High volume often signals strong interest in a stock, confirming trends and breakouts. Conversely, low volume can indicate weak momentum, suggesting that price movements may not be reliable. Day traders use volume indicators to identify entry and exit points, assess the validity of price movements, and avoid false signals. For example, a sudden price increase accompanied by high volume may prompt a trader to buy, while a price drop with low volume could signal a good time to sell or avoid the stock.
Which volume indicators should day traders use?
Day traders should use volume indicators like the Volume Moving Average, On-Balance Volume (OBV), and the Accumulation/Distribution Line. The Volume Moving Average helps identify trends, OBV shows buying and selling pressure, and the Accumulation/Distribution Line indicates whether an asset is being accumulated or distributed. These indicators can provide insights into market strength and potential reversals.
How can volume indicators signal market trends?
Volume indicators signal market trends by showing the number of shares or contracts traded. High volume often confirms a price trend, indicating strong interest and potential continuation. Conversely, low volume can suggest a lack of conviction, making trends less reliable. For day traders, spikes in volume during price movements can signal entry or exit points, while volume patterns help identify reversals or breakouts. Monitoring volume alongside price action enhances decision-making and risk management.
What is the significance of volume in day trading?
Volume in day trading is crucial because it indicates the strength of a price movement. High volume suggests strong investor interest and can confirm trends, while low volume may signal weakness or potential reversals. Day traders use volume indicators to identify entry and exit points, assess volatility, and gauge market sentiment. Monitoring volume helps traders make informed decisions and enhances the accuracy of trading strategies.
How do I read volume indicators effectively?
To read volume indicators effectively, focus on these key points:
1. Understand Volume Trends: Look for spikes in volume that correlate with price movements. A rising price with increasing volume signals strong momentum, while rising prices with decreasing volume may indicate weakness.
2. Use Moving Averages: Apply volume moving averages to filter out noise. Compare current volume to the average to identify unusual activity.
3. Identify Divergences: Watch for divergences between price and volume. For example, if prices rise but volume falls, it may signal a potential reversal.
4. Confirm Breakouts: Ensure that breakouts above resistance come with high volume. Low volume on a breakout may suggest a lack of conviction.
5. Combine with Other Indicators: Use volume alongside other technical indicators like RSI or MACD for better insights.
By focusing on these aspects, you can interpret volume indicators to enhance your day trading strategy.
How do volume indicators differ from price indicators?

Volume indicators measure the number of shares traded over a specific period, reflecting market activity and liquidity. Price indicators focus on the asset's price movement, showing trends and patterns. Volume indicators help confirm trends indicated by price; for example, rising prices on high volume suggest strength, while rising prices on low volume may signal weakness. In summary, volume indicators provide insights into market participation, while price indicators reveal the direction and momentum of an asset's price.
What role do volume indicators play in stock analysis?
Volume indicators are crucial in stock analysis for day traders as they show the number of shares traded within a specific period. High volume often indicates strong interest and can confirm price movements, signaling potential buy or sell opportunities. Conversely, low volume may suggest weak interest, making price movements less reliable. Traders use volume indicators to spot trends, reversals, and to gauge market sentiment, enhancing their decision-making process.
How can I combine volume indicators with other tools?

Combine volume indicators with price action analysis for confirmation. Use them alongside moving averages to identify trends; a rising volume with a price increase signals strength. Pair volume with oscillators like RSI to spot divergences and potential reversals. Incorporate candlestick patterns to enhance entry and exit points, ensuring volume supports the signal. Finally, use volume in conjunction with support and resistance levels to validate breakouts or reversals.
What are the best practices for using volume indicators?
Use volume indicators to confirm trends. When prices rise with increasing volume, it signals strength; when prices rise with declining volume, it suggests weakness. Watch for volume spikes at key support or resistance levels—they can indicate potential reversals. Combine volume with other indicators like moving averages for better signals. Be cautious of low volume during breakouts; they may lack conviction. Finally, always consider market context and news events that can affect volume.
How do volume spikes affect day trading strategies?
Volume spikes can significantly impact day trading strategies by indicating strong buying or selling interest. Traders often use these spikes to confirm trends, identify reversals, or spot breakouts. A sudden increase in volume can signal that a price move is more likely to continue, making it a key factor in entry and exit decisions. For instance, if a stock breaks resistance with high volume, it may suggest further upward momentum, prompting traders to buy. Conversely, a spike during a downtrend might indicate heightened selling pressure, pushing traders to consider short positions. Monitoring volume helps traders refine their strategies and improve their timing in the market.
Learn about How Do Prop Firms Affect Day Trading Strategies?
What are common mistakes with volume indicators?
Common mistakes with volume indicators include ignoring context, such as market trends and price action, which can lead to false signals. Many traders also misinterpret volume spikes, thinking they always indicate strong moves when they can signal exhaustion or reversals. Relying solely on volume without confirming with other indicators can result in poor decision-making. Additionally, not adjusting for volume relative to the stock's average can lead to misleading conclusions. Finally, some traders overlook the importance of understanding the volume's role in different time frames, which can skew their analysis.
How can volume indicators help identify breakouts?
Volume indicators help identify breakouts by showing increased trading activity that often precedes significant price movements. When a stock breaks through a resistance level with high volume, it signals strong buying interest, indicating that the breakout is likely to sustain. Conversely, if a breakout occurs with low volume, it may suggest a lack of conviction and a higher chance of a false breakout. Day traders use volume spikes to confirm breakout strength and set entry or exit points effectively.
What is the relationship between volume and volatility?
Volume and volatility are closely linked in trading. Higher volume often indicates increased interest in a stock, which can lead to greater price swings or volatility. When many traders buy or sell a stock, it can cause sharp price movements. Conversely, low volume may lead to less volatility, as fewer trades can result in smaller price changes. Day traders watch volume indicators to gauge potential volatility and make informed trading decisions.
How can I measure the effectiveness of volume indicators?
To measure the effectiveness of volume indicators, analyze their correlation with price movements. Start by observing how volume spikes precede price changes, indicating potential breakouts or reversals. Use tools like the On-Balance Volume (OBV) to gauge buying and selling pressure. Compare volume trends against price trends; rising prices with increasing volume suggest strength, while rising prices with declining volume may indicate a lack of conviction. Additionally, backtest volume indicators over different time frames to see how they perform under various market conditions. Regularly review your findings and adjust your strategies based on what works best for your trading style.
What are advanced techniques for using volume indicators?

Advanced techniques for using volume indicators include:
1. Volume Profile: Analyze volume at specific price levels rather than time. This helps identify support and resistance zones.
2. On-Balance Volume (OBV): Use OBV to confirm trends. If the price rises while OBV increases, the trend is strong.
3. Accumulation/Distribution Line: Monitor this indicator to gauge buying and selling pressure. A rising line indicates accumulation, while a falling line suggests distribution.
4. Chaikin Money Flow (CMF): Combine price and volume to assess buying and selling pressure over a set period. A positive CMF signals strong buying.
5. Volume Weighted Average Price (VWAP): Use VWAP as a benchmark for trade decisions. Traders often buy below VWAP and sell above it.
6. Divergence Analysis: Look for divergences between price and volume indicators. For example, if price rises but volume decreases, it may indicate a weak trend.
7. Volume Clusters: Identify clusters of high volume to anticipate potential reversals or breakouts when price approaches these levels.
Implement these techniques to enhance your day trading strategies effectively.
Conclusion about Volume Indicators: What Day Traders Need to Know
Incorporating volume indicators into your day trading strategy is essential for making informed decisions. These tools not only provide insights into market trends but also help identify potential breakouts and reversals. By understanding how to read and apply volume alongside price indicators, traders can enhance their analysis and improve trade execution. Remember, successful trading requires a combination of knowledge, practice, and the right tools—like those offered by DayTradingBusiness—to navigate the complexities of the market effectively.
Learn about What Should Day Traders Know About Regulatory Changes?