Did you know that even the most experienced traders sometimes confuse RSI with a pizza topping? In reality, the Relative Strength Index (RSI) is a vital tool for day trading, designed to help traders gauge market momentum. This article breaks down the essentials of RSI, covering its definition, functionality, and key levels to watch. You'll learn how to identify overbought and oversold conditions, interpret RSI divergence, and integrate it with other indicators for enhanced trading strategies. Additionally, we discuss the ideal timeframes for using RSI, its limitations, and advanced techniques for seasoned traders. By the end, you'll be better equipped to leverage RSI effectively in various market conditions with insights from DayTradingBusiness.
What is RSI in Day Trading?
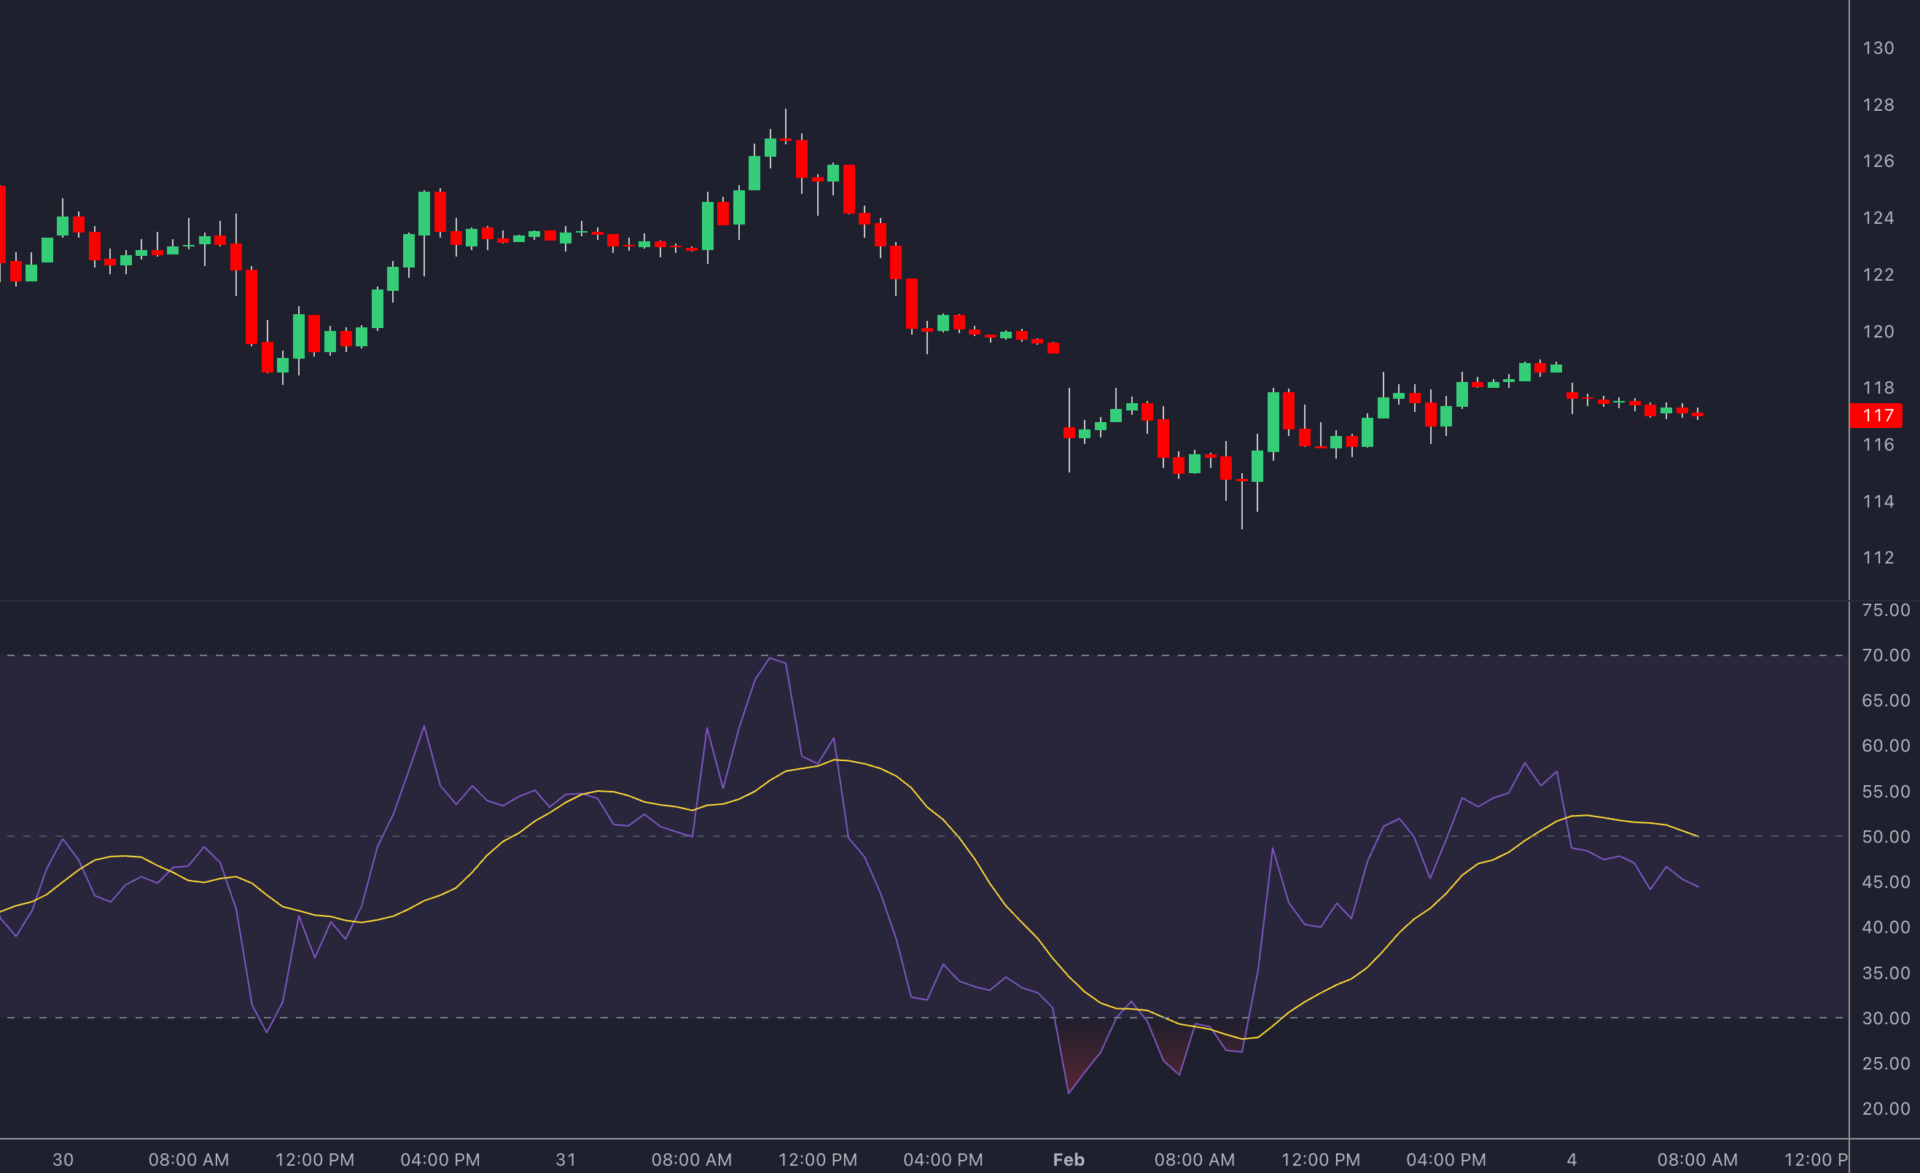
RSI, or Relative Strength Index, is a momentum oscillator used in day trading to measure the speed and change of price movements. It ranges from 0 to 100 and helps identify overbought or oversold conditions in a stock. A reading above 70 typically indicates an overbought condition, while a reading below 30 suggests oversold conditions. Traders use RSI to spot potential reversal points, making it a powerful tool for entry and exit decisions in day trading.
How Does the RSI Indicator Work?
The RSI (Relative Strength Index) measures the speed and change of price movements on a scale of 0 to 100. It identifies overbought or oversold conditions in a market. An RSI above 70 typically indicates that an asset is overbought, while an RSI below 30 suggests it's oversold. Traders use these levels to predict potential reversals. Additionally, RSI can signal divergence when the price moves in the opposite direction of the indicator, hinting at possible trend changes. For day trading, combining RSI with other indicators enhances accuracy and decision-making.
What Are the Key RSI Levels to Watch?
Key RSI levels to watch are 30 and 70. An RSI below 30 indicates an oversold condition, suggesting a potential buying opportunity. Conversely, an RSI above 70 signals an overbought condition, often indicating a selling opportunity. Additionally, watch for divergences between RSI and price movements, as these can signal reversals.
How Can I Use RSI to Identify Overbought Conditions?
To identify overbought conditions using the Relative Strength Index (RSI), look for values above 70. When the RSI crosses this threshold, it suggests that a security may be overbought and due for a price correction. Monitor the RSI trend; if it starts to decline from above 70, it reinforces the overbought signal. Combine this with other indicators or price action for confirmation before taking action.
How Can RSI Help Spot Oversold Markets?
RSI, or Relative Strength Index, helps spot oversold markets by measuring the speed and change of price movements. When the RSI drops below 30, it indicates that a security may be oversold, suggesting a potential price reversal. Traders use this signal to identify buying opportunities, as an oversold condition often precedes a bounce back in price. Additionally, watching for divergence between price and RSI can provide further confirmation of market strength.
What Is the Best Timeframe for RSI in Day Trading?
The best timeframe for using the RSI (Relative Strength Index) in day trading is typically between 5 to 15 minutes. This range allows traders to capture short-term price movements while minimizing noise. Many traders favor the 14-period RSI for its balance between sensitivity and reliability, but adjusting the period to 7 or 9 can also work well for quicker signals. Ultimately, the choice depends on your trading style and strategy.
How Do I Interpret RSI Divergence in Trading?
To interpret RSI divergence in trading, look for discrepancies between the RSI and price movement. When prices make a new high but RSI makes a lower high, it signals potential bearish divergence, suggesting a price reversal may occur. Conversely, if prices hit a new low while RSI forms a higher low, it indicates bullish divergence, hinting at a possible upward reversal. Always confirm divergence signals with other indicators or volume analysis to enhance accuracy.
Can RSI Be Used with Other Indicators?
Yes, RSI can be used with other indicators. Many traders combine RSI with moving averages, MACD, or Bollinger Bands to confirm signals and enhance their trading strategy. For instance, using RSI with a moving average crossover can help validate entry and exit points, providing a more robust trading decision.
What Are Common RSI Trading Strategies?
Common RSI trading strategies include:
1. Overbought/Oversold Levels: Buy when the RSI is below 30 (oversold) and sell when above 70 (overbought).
2. Divergence: Look for divergence between RSI and price. If prices make new highs while RSI does not, it may signal a reversal.
3. Centerline Crossover: Trade when RSI crosses the 50 line. A move above indicates bullish momentum, while below suggests bearish.
4. Trend Confirmation: Use RSI to confirm trends. In an uptrend, buy on dips when RSI is above 50; in a downtrend, sell rallies when RSI is below 50.
5. RSI Swing Rejections: Enter trades when RSI moves out of overbought or oversold territory and then re-enters, signaling potential continuation.
Implement these strategies for effective trading with the RSI indicator.
How Do I Set Up RSI on Trading Platforms?
To set up the Relative Strength Index (RSI) on trading platforms, follow these steps:
1. Open your trading platform: Log in to your account and select the chart for the asset you want to analyze.
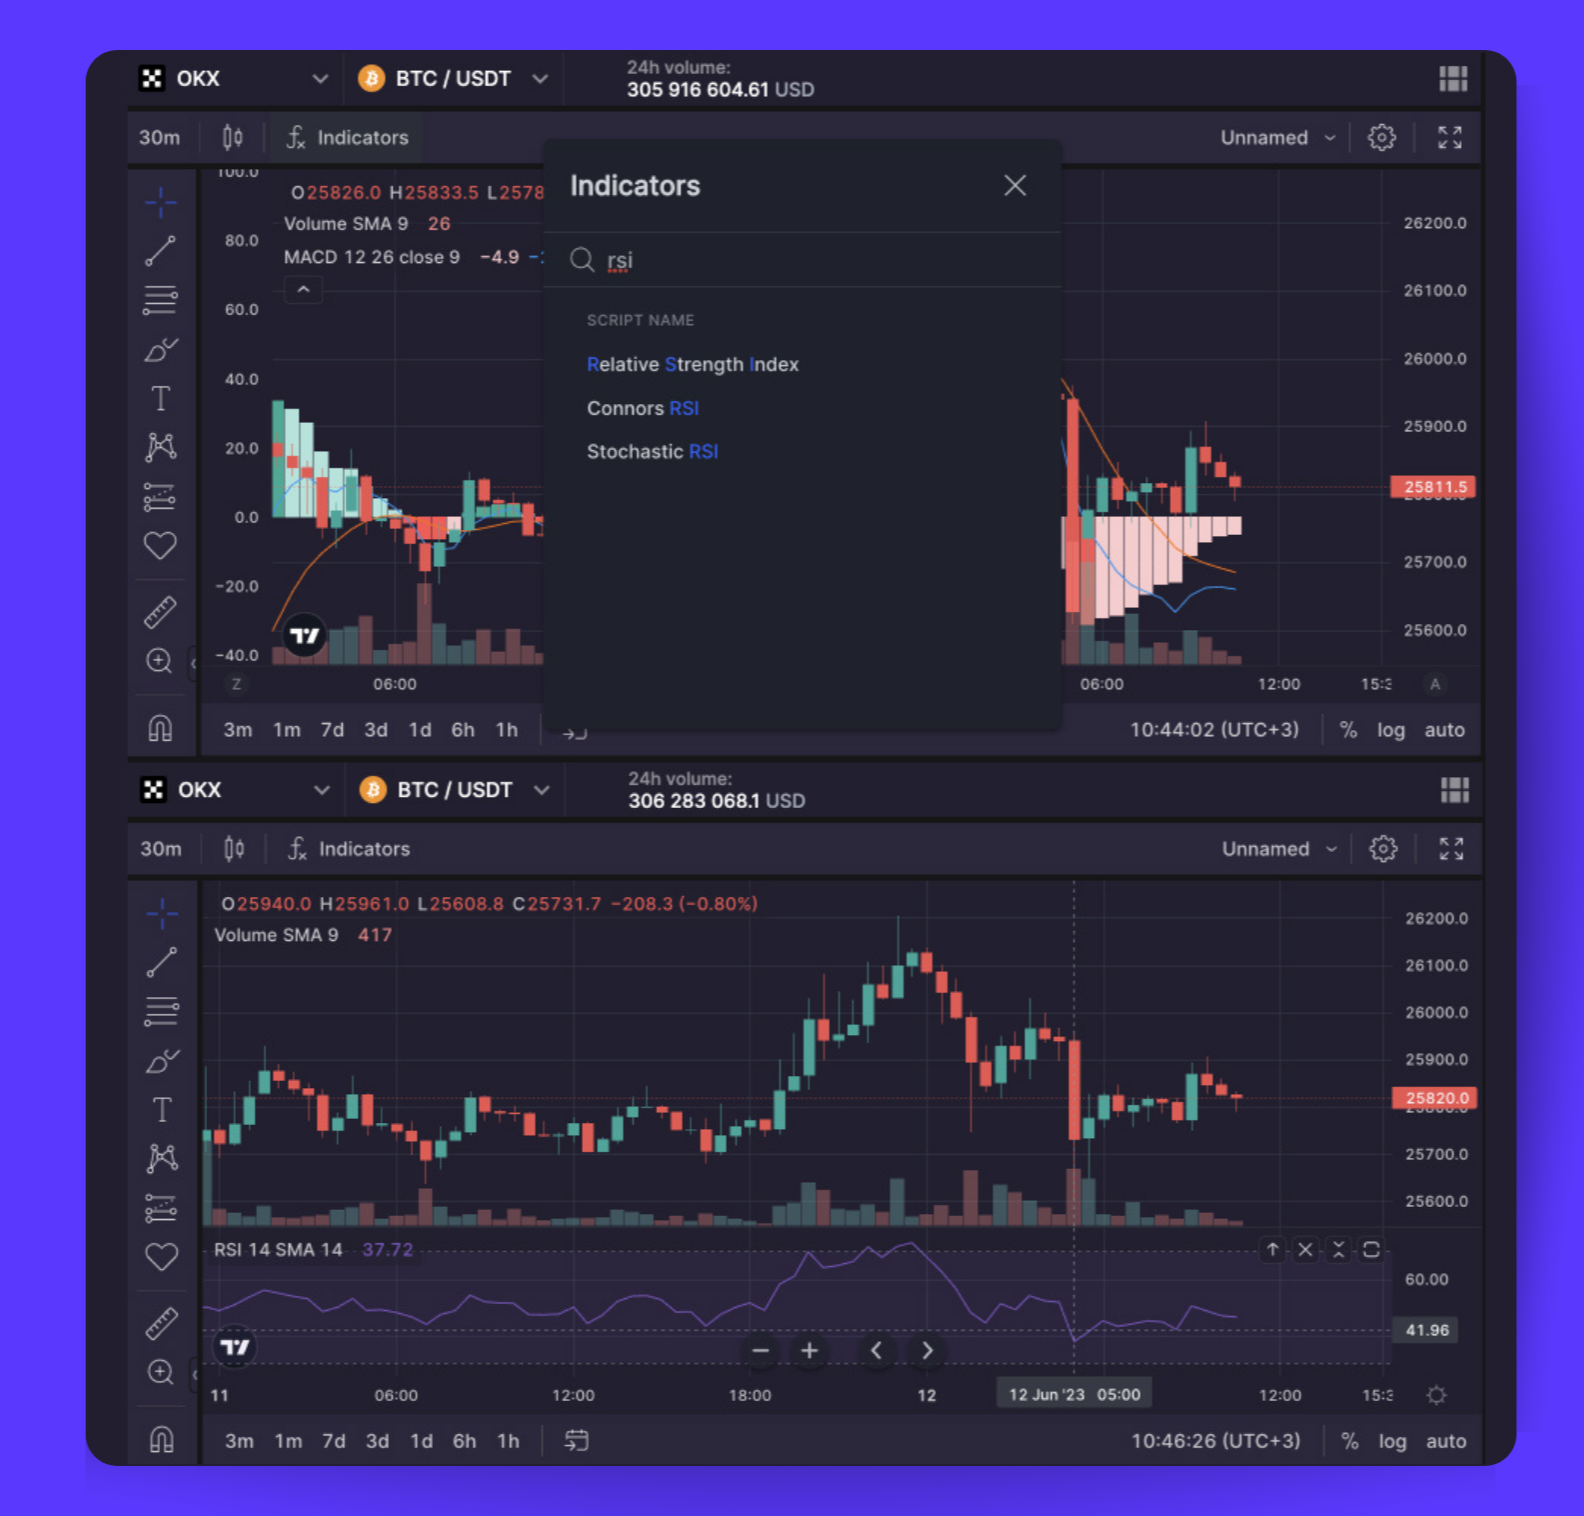
2. Add the RSI indicator: Look for the indicators section, often found in the toolbar or under a menu labeled "Indicators" or "Studies." Search for "RSI" or "Relative Strength Index."
3. Customize settings: Once added, you can usually modify the RSI settings. The default period is typically 14, but you can adjust it based on your trading strategy.
4. Apply the indicator: Click "Apply" or "OK" to add the RSI to your chart. It will usually appear in a separate pane below the price chart.
5. Analyze the RSI: Look for overbought (above 70) or oversold (below 30) levels to identify potential trading signals.
Now you're set to use RSI effectively in your day trading!
What Are the Limitations of Using RSI?
The limitations of using RSI (Relative Strength Index) include false signals, especially in trending markets where it can stay overbought or oversold for extended periods. It can also lag in providing signals, leading to missed opportunities. Additionally, RSI doesn't consider market context or fundamental factors, which can lead to misguided trades. Traders should combine it with other indicators for better accuracy.
How Can I Avoid RSI Misinterpretation in Trades?
To avoid RSI misinterpretation in trades, use these strategies:
1. Confirm with Other Indicators: Pair RSI with moving averages or MACD for stronger signals. This reduces false readings.
2. Adjust the Settings: Customize the RSI period based on your trading style. A shorter period can capture rapid movements, while a longer one smooths out noise.
3. Watch for Divergence: Look for price divergence with RSI. If prices are rising but RSI is falling, it may signal a reversal.
4. Use Overbought/Oversold Levels Wisely: Don't rely solely on the 70/30 levels. Consider market context; in strong trends, these levels can remain extended longer.
5. Analyze Price Action: Always consider price movements alongside RSI signals. Context is key to avoid misinterpretation.
Implementing these strategies will enhance your RSI effectiveness and reduce the risk of misinterpretation in your trades.
What Is the Difference Between RSI and Stochastic Oscillator?
RSI (Relative Strength Index) measures the speed and change of price movements, indicating overbought or oversold conditions on a scale from 0 to 100. A reading above 70 suggests overbought, while below 30 indicates oversold.
The Stochastic Oscillator compares a security's closing price to its price range over a specific period, also indicating overbought or oversold levels but on a scale from 0 to 100. Readings above 80 are considered overbought, and below 20 are oversold.
In summary, RSI focuses on price momentum, while the Stochastic Oscillator emphasizes price relative to its range. Both are valuable for day trading but provide insights from different perspectives.
How Often Should I Check RSI During Day Trading?
Check the RSI (Relative Strength Index) at least every 15 minutes during day trading. This frequency helps you spot overbought or oversold conditions quickly. For more active strategies, monitor it every 5 minutes to catch rapid changes. Adjust based on your trading style and market volatility.
Learn about How Do Institutional Traders Manage Risk During Day Trading?
What Are Some Advanced RSI Techniques for Experienced Traders?
1. Divergence Trading: Look for divergences between price and the RSI. If prices are making new highs while RSI is failing to reach new highs, it signals potential reversals.
2. Multiple Time Frame Analysis: Use RSI across different time frames to identify trend strength and potential entry points. For instance, if the daily RSI is bullish but the hourly RSI shows overbought conditions, consider taking profits or scaling back.
3. RSI Trendlines: Draw trendlines on the RSI itself. Breaks of these trendlines can indicate shifts in momentum before price changes.
4. Overbought/Oversold Zones: Instead of strictly using 70/30 levels, adjust these based on market conditions. In strong trends, consider 80/20 levels for better accuracy.
5. RSI with Other Indicators: Combine RSI with other indicators like Moving Averages or MACD to confirm signals and enhance trading strategies.
6. Custom RSI Settings: Experiment with different periods for the RSI. A shorter period (like 7) can provide quicker signals, while a longer period (like 21) smooths out noise.
7. RSI Pattern Recognition: Identify patterns such as head and shoulders or double tops in the RSI, which can precede significant price movements.
8. Exit Strategies: Use RSI to determine exit points. If you've entered a position on an oversold RSI, consider exiting when it approaches the overbought zone.
Applying these advanced techniques can enhance your trading strategy and improve decision-making with the RSI.
How Can I Use RSI in Different Market Conditions?
To use the Relative Strength Index (RSI) in different market conditions, follow these strategies:
1. Trending Markets: In a strong uptrend, look for RSI pullbacks to 40-50 as potential buy signals. In a downtrend, consider sell signals when RSI rises to 60-70.
2. Range-Bound Markets: Identify overbought conditions above 70 and oversold conditions below 30. Buy when RSI dips below 30 and shows a reversal, and sell when it exceeds 70 and begins to decline.
3. Divergence: Watch for divergence between price and RSI. In an uptrend, if prices make new highs but RSI does not, it may signal a reversal. Conversely, in a downtrend, if prices hit new lows but RSI shows higher lows, it could indicate a bullish reversal.
4. Timeframes: Adjust your RSI settings based on your trading timeframe. For day trading, a shorter period (like 9 or 14) can provide quicker signals, while longer periods (like 21 or 30) may work better for swing trading.
5. Combining Indicators: Use RSI alongside other indicators like moving averages or MACD for confirmation. For instance, if RSI indicates overbought conditions while price hits a resistance level, it strengthens the sell signal.
By adapting your RSI approach to the current market conditions, you can enhance your day trading strategy effectively.
Conclusion about RSI: A Powerful Day Trading Indicator
Incorporating the RSI indicator into your day trading strategy can enhance your ability to identify market conditions, such as overbought and oversold scenarios. By understanding its key levels, divergence signals, and limitations, you can make informed trading decisions. Remember, combining RSI with other indicators and applying advanced techniques can improve your trading effectiveness. Always stay updated and consider insights from experts at DayTradingBusiness to refine your approach.
Sources:
- Enhancing daily stock trading with a novel fuzzy indicator ...
- Data-Driven Insights from Technical Indicators to Predict the ...
- Prediction of stock market using sentiment analysis and ensemble ...
- Dynamic portfolio rebalancing with lag-optimised trading indicators ...
- Key technical indicators for stock market prediction - ScienceDirect
- Technical indicators for energy market trading - ScienceDirect