Did you know that some traders believe that the only thing faster than a market crash is a cat meme going viral? In the fast-paced world of day trading, real-time indicators are essential tools that can make or break your trading decisions. This article delves into what real-time indicators are, how to effectively use them, and which ones are the best for day trading. You’ll learn the difference between leading and lagging indicators, how volume indicators impact your strategy, and the importance of moving averages in your analysis. We’ll also cover how to customize these indicators to fit your trading style and the risks involved in relying on them. With insights from DayTradingBusiness, you’ll be equipped to enhance your trading decisions and stay ahead of market trends.
What are real-time indicators in day trading?
Real-time indicators in day trading are tools that provide immediate data to help traders make quick decisions. Common examples include moving averages, Bollinger Bands, and the Relative Strength Index (RSI). These indicators analyze price action and volume in real time, offering insights into market trends and potential entry or exit points. Traders use them to gauge momentum, identify overbought or oversold conditions, and spot trend reversals, allowing for timely trades based on current market conditions.
How do I use real-time indicators for day trading?
To use real-time indicators for day trading, follow these steps:
1. Choose Your Indicators: Select a few key indicators like moving averages, RSI, or MACD that suit your trading style.
2. Set Up Your Chart: Use a trading platform to create charts that display your chosen indicators in real-time.
3. Monitor Market Conditions: Watch how indicators react to price movements. For instance, look for crossover signals in moving averages or overbought/oversold conditions in RSI.
4. Define Entry and Exit Points: Use the indicators to identify when to enter or exit trades. For example, buy when the price crosses above a moving average.
5. Combine with Volume Analysis: Analyze volume alongside your indicators to confirm trends. Increased volume can validate signals from your indicators.
6. Practice Risk Management: Set stop-loss orders based on indicator signals to protect your capital.
7. Stay Updated: Continuously adapt your approach based on market changes and backtest your strategies regularly.
By effectively utilizing these steps, you can leverage real-time indicators to enhance your day trading strategy.
What are the best real-time indicators for day trading?
The best real-time indicators for day trading include:
1. Moving Averages (MA): Use short-term MAs, like the 5 or 10-period, for quick trend identification.
2. Relative Strength Index (RSI): This helps identify overbought or oversold conditions, typically using a 14-period setting.
3. MACD (Moving Average Convergence Divergence): Look for crossover points for potential buy or sell signals.
4. Bollinger Bands: These provide a volatility gauge and help identify potential price reversals.
5. Volume: High volume confirms the strength of a price move; look for spikes during key levels.
6. Stochastic Oscillator: This identifies momentum and potential reversal points, often used in conjunction with RSI.
Combine these indicators for effective real-time analysis and to enhance your day trading strategy.
How can real-time indicators improve trading decisions?
Real-time indicators enhance trading decisions by providing immediate data on market conditions, helping traders identify trends and reversals quickly. For example, moving averages can signal buy or sell opportunities as they react to price changes instantly. Volume indicators reveal the strength of a price movement, guiding traders on whether to enter or exit positions. Additionally, real-time indicators like the Relative Strength Index (RSI) allow traders to assess whether an asset is overbought or oversold in the moment, leading to more informed decisions. Overall, these tools enable traders to respond swiftly to market dynamics, minimizing risk and maximizing potential gains.
What is the difference between leading and lagging indicators?
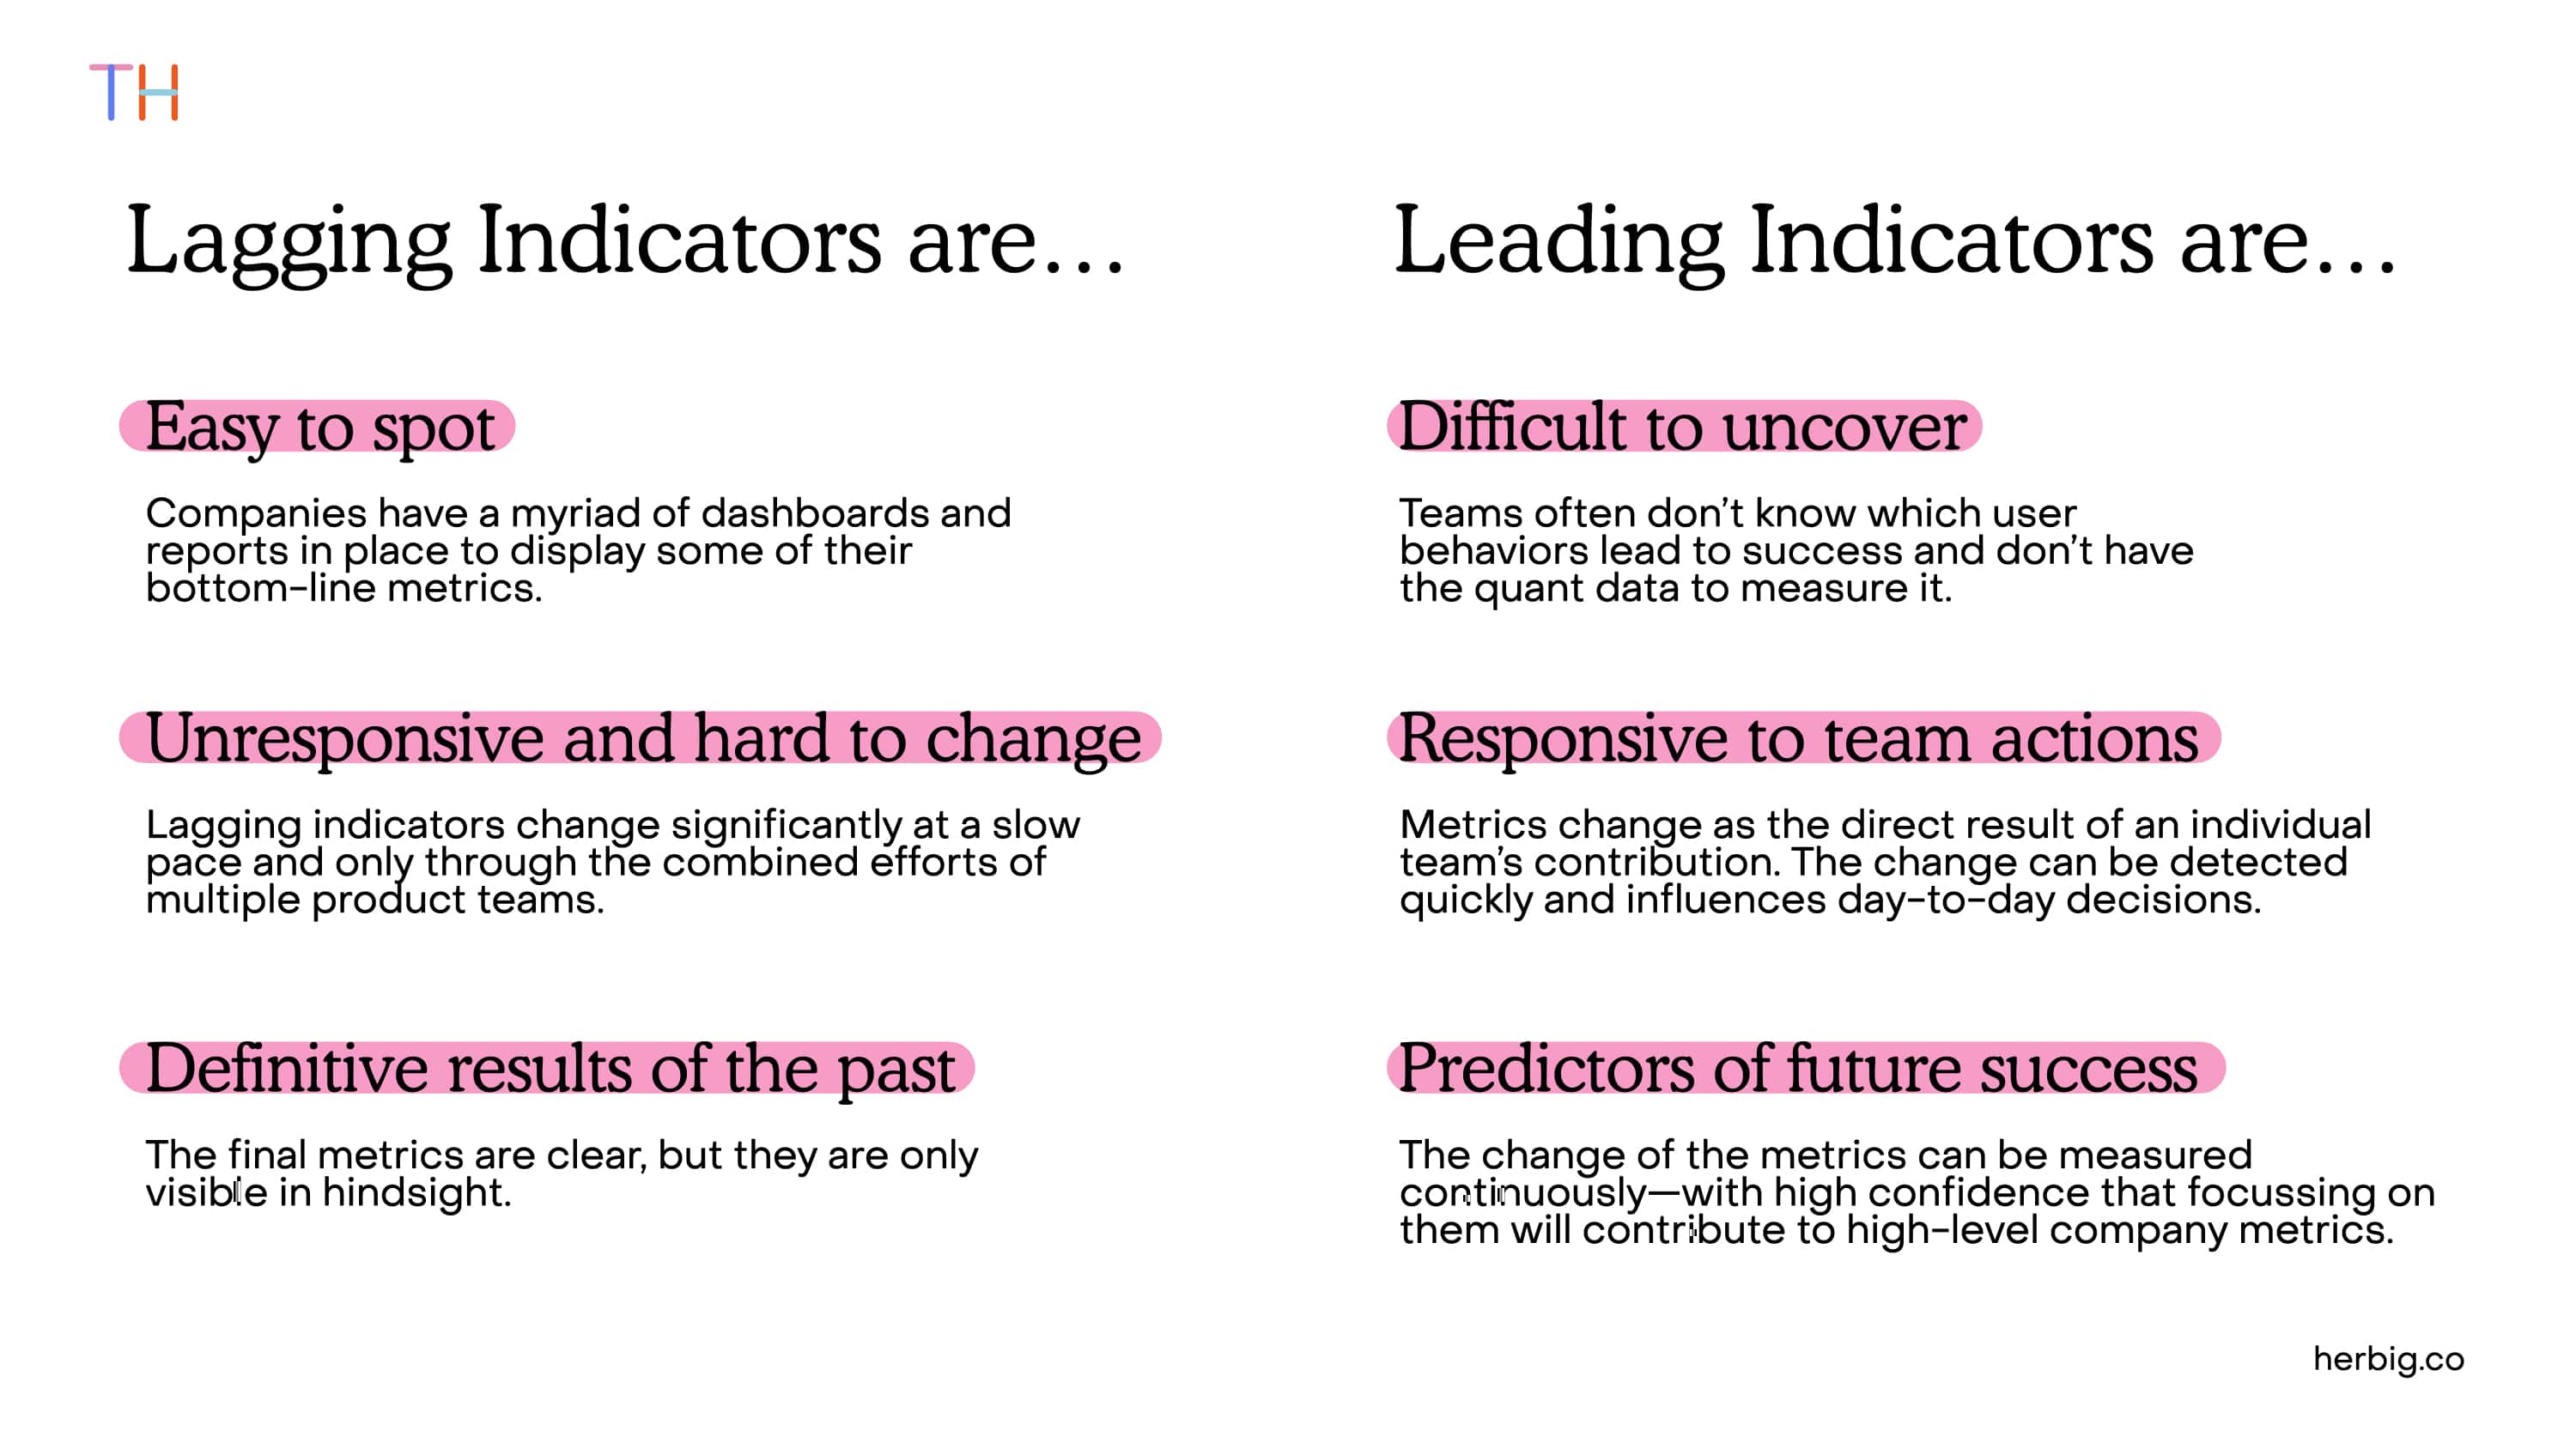
Leading indicators predict future price movements, giving traders insights before trends happen. Examples include moving averages and momentum indicators. Lagging indicators, on the other hand, confirm trends after they occur, like the moving average convergence divergence (MACD) or relative strength index (RSI). In day trading, leading indicators help identify entry points, while lagging indicators assist in confirming the strength of a trend.
How do I set up real-time indicators on my trading platform?
To set up real-time indicators on your trading platform, follow these steps:
1. Open Your Trading Platform: Launch the trading software or web application you use for day trading.
2. Select a Chart: Choose the asset you want to analyze and open its chart.
3. Add Indicators: Look for an "Indicators" or "Studies" option in the menu. Click it to see a list of available indicators.
4. Choose Your Indicators: Select the real-time indicators you want, such as moving averages, RSI, or MACD. Click to add them to your chart.
5. Customize Settings: Adjust the settings for each indicator to fit your trading strategy, such as timeframes or parameters.
6. Apply and Save: Once configured, apply the changes and save your chart layout for future use.
7. Monitor in Real-Time: Ensure your platform is set to real-time updates so you can see indicator changes live as market conditions shift.
Check your platform's user guide for specific steps, as the process may vary slightly.
What are the most commonly used technical indicators in day trading?
The most commonly used technical indicators in day trading are:
1. Moving Averages: Help identify the trend direction by smoothing price data.
2. Relative Strength Index (RSI): Measures momentum to identify overbought or oversold conditions.
3. Bollinger Bands: Show volatility and potential price reversals by plotting standard deviations around a moving average.
4. MACD (Moving Average Convergence Divergence): Indicates momentum changes and trend direction through the relationship between two moving averages.
5. Stochastic Oscillator: Compares a security's closing price to its price range over a specific period, indicating potential reversals.
6. Volume: Confirms trends and signals strength or weakness based on trading volume changes.
These indicators aid in making quick, informed decisions during trading sessions.
How do volume indicators affect day trading strategies?
Volume indicators are crucial for day trading strategies as they provide insights into market strength and potential price movements. High volume often signals strong interest in a stock, confirming trends, while low volume can indicate weak momentum. Traders use volume to identify breakouts or reversals; for example, a price increase on high volume suggests a solid move, while a price rise on low volume may be suspect. Additionally, volume can help in setting entry and exit points, allowing traders to manage risk more effectively.
Can real-time indicators predict market trends accurately?
Real-time indicators can provide insights into market trends but are not foolproof for accurate predictions. They help traders gauge momentum, volatility, and potential reversals, enhancing decision-making in day trading. However, reliance solely on these indicators can lead to false signals. Combining them with other analysis methods increases accuracy and effectiveness.
How do I combine multiple indicators for better analysis?
To combine multiple indicators for better analysis in real-time day trading, follow these steps:
1. Select Complementary Indicators: Choose indicators that provide different insights, such as a trend indicator (like Moving Averages) and a momentum indicator (like RSI or MACD).
2. Set Parameters: Adjust the settings of each indicator to fit your trading style and the specific market conditions.
3. Look for Convergence: Use multiple indicators to confirm trade signals. For example, if both the RSI is overbought and the price is near a resistance level, it strengthens the sell signal.
4. Timeframe Alignment: Ensure the indicators are analyzed on the same timeframe to maintain consistency in your analysis.
5. Backtest Combinations: Test different combinations of indicators on historical data to identify which pairs yield the best results.
6. Monitor Market Conditions: Be aware of the current market environment, as certain indicators may perform better in trending markets versus ranging markets.
7. Use Alerts: Set alerts for specific indicator levels to help you react quickly in real-time trading situations.
By strategically combining indicators, you can enhance your analysis and make more informed trading decisions.
What is the role of moving averages in real-time analysis?
Moving averages smooth out price data to identify trends in real-time analysis for day trading. They help traders spot entry and exit points by filtering out market noise. Short-term moving averages react quickly to price changes, highlighting immediate trends, while long-term averages provide a broader perspective. Using them together can signal potential trend reversals or continuations, making them essential tools for decision-making in fast-paced trading environments.
How do I customize real-time indicators for my trading style?
To customize real-time indicators for day trading, start by identifying your trading style and goals. Choose indicators that align with your strategy, such as moving averages, RSI, or MACD.
Next, adjust the settings of these indicators to fit your preferred time frames—shorter for scalping, longer for swing trading. Experiment with different parameters to see what works best for your trades.
Incorporate multiple indicators for confirmation; for example, use volume alongside price action indicators. Regularly review and tweak your indicators based on market conditions and your trading performance. Finally, utilize trading platforms that allow for easy customization of your indicators for quick adjustments.
Learn about How to Customize Day Trading Indicators
What are the risks of relying on real-time indicators?
Relying on real-time indicators in day trading carries several risks. First, they can create false signals, leading to impulsive trades based on market noise rather than solid trends. Second, latency issues may cause delays in data, resulting in missed opportunities or losses. Third, over-reliance can lead to neglecting fundamental analysis, which is crucial for understanding market context. Finally, emotional trading driven by real-time alerts can increase the likelihood of rash decisions, amplifying losses.
How often should I update my real-time indicators?
Update your real-time indicators every few minutes during active trading sessions. This ensures you have the latest market data to make informed decisions. Adjust the frequency based on market volatility; in fast-moving markets, update more frequently. Regularly reviewing your indicators helps you stay aligned with current trends and price movements.
What is the impact of news on real-time trading indicators?
News significantly impacts real-time trading indicators by causing rapid price fluctuations and increased volatility. Positive news can trigger bullish sentiment, leading to rising indicators like moving averages and RSI. Conversely, negative news often results in bearish momentum, causing indicators to drop. Traders use news to refine their strategies, adjusting indicators based on market reactions to stay ahead in day trading. Understanding this relationship helps in making informed trading decisions.
How do I interpret signals from real-time indicators?
To interpret signals from real-time indicators in day trading, follow these steps:
1. Identify Key Indicators: Focus on popular indicators like Moving Averages, RSI, MACD, and Bollinger Bands.
2. Look for Divergences: Check if price movements diverge from indicator signals. For example, if prices rise but RSI falls, it may indicate weakening momentum.
3. Confirm with Volume: Analyze trading volume alongside indicators. A strong signal should be supported by high volume.
4. Set Thresholds: Define specific levels for your indicators (like overbought/oversold for RSI) to help make clear buy or sell decisions.
5. Combine Indicators: Use multiple indicators to validate signals. For instance, a bullish crossover in MACD combined with a price above the Moving Average strengthens the buy signal.
6. Monitor Timeframes: Use different timeframes to confirm trends. A daily trend may differ from an hourly trend, so align your trades accordingly.
7. Adapt to Market Conditions: Be flexible and adjust your interpretations based on overall market sentiment and news events.
By following these steps, you can effectively interpret signals from real-time indicators for better trading decisions.
Conclusion about Real-Time Indicator Analysis for Day Trading
Incorporating real-time indicators into your day trading strategy is essential for making informed decisions and maximizing potential profits. Understanding the differences between leading and lagging indicators, utilizing volume analysis, and customizing your tools can enhance your trading effectiveness. While real-time indicators provide valuable insights, it's crucial to remain aware of the associated risks and the impact of external factors like news events. By leveraging these tools thoughtfully, you can navigate the complexities of the market with greater confidence. Partner with DayTradingBusiness to further refine your approach and stay ahead in your trading journey.
Learn about Advanced Techniques for Indicator Analysis in Day Trading
Sources:
- Indicators | Data
- New Indicators for Tracking Growth in Real Time; by Troy Matheson ...
- Capital Flow Data – A Guide for Empirical Analysis and Real-Time ...
- P2P trading mode for real-time coupled electricity and carbon ...
- Ultra-short-term forecasting for photovoltaic power plants and real ...
- Impact of forecasted heat demand on day-ahead optimal scheduling ...