Did you know that the MACD indicator is often referred to as the "MACD-ificent" tool for traders? This article dives deep into the MACD, a crucial tool for day traders looking to optimize their strategies. We explain what MACD is and how it functions, alongside its key components and interpretation methods. Discover practical strategies for using MACD in your trading, learn about its advantages and limitations, and find out how to set it up effectively on trading platforms. We also cover the best time frames for MACD, how to avoid false signals, and real-life trading examples. Finally, we provide resources to enhance your understanding of MACD. With insights from DayTradingBusiness, you'll be well-equipped to make informed trading decisions.
What is MACD and How Does It Work for Day Trading?
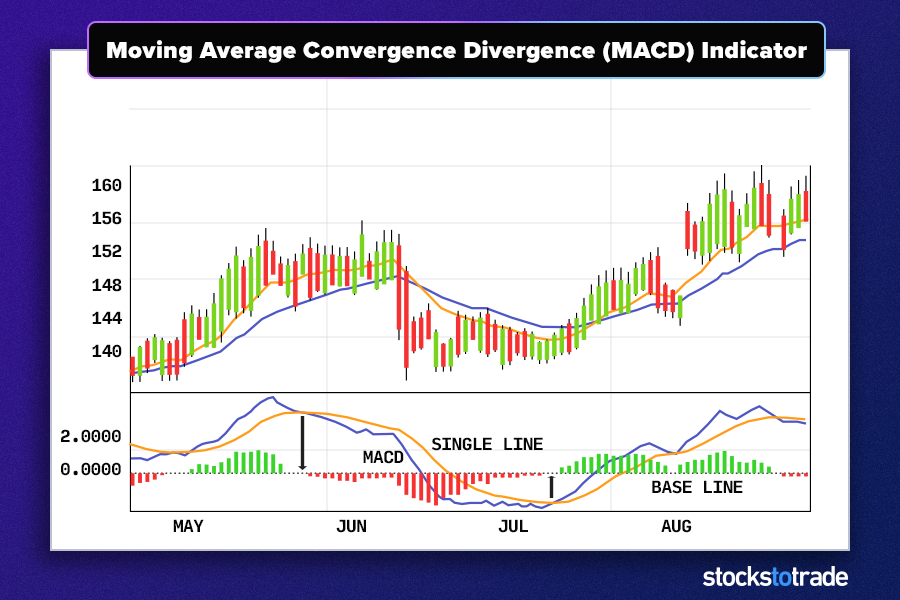
MACD, or Moving Average Convergence Divergence, is a momentum indicator used in day trading to identify potential buy and sell signals. It consists of two lines: the MACD line, which is the difference between two exponential moving averages (EMAs), and the signal line, which is an EMA of the MACD line.
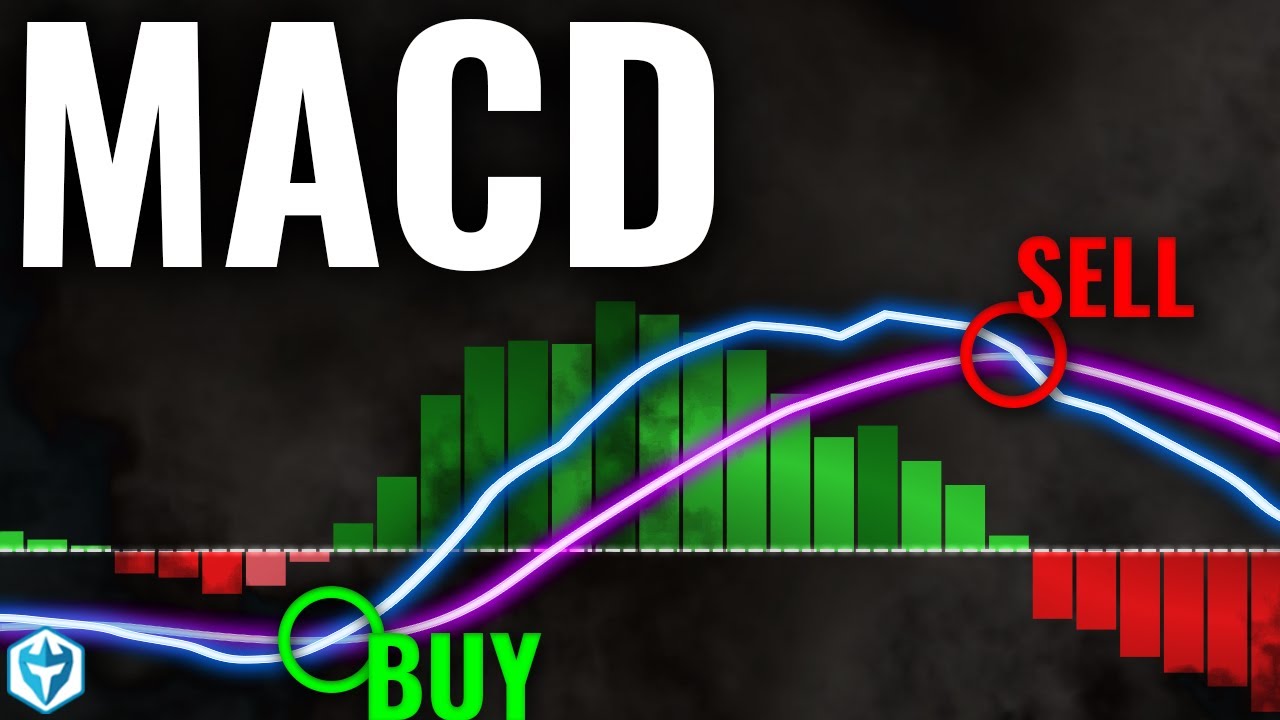
Traders look for crossovers between the MACD line and the signal line. A bullish crossover (MACD line crossing above the signal line) suggests a buying opportunity, while a bearish crossover indicates a potential sell signal. Additionally, divergence between MACD and price action can signal reversals.
Day traders often use MACD in conjunction with other indicators to confirm trends and enhance decision-making.
How Can I Use MACD for Day Trading Strategies?
To use MACD for day trading, follow these steps:
1. Identify MACD Lines: Look at the MACD line and the signal line. A crossover occurs when the MACD line crosses above the signal line, signaling a potential buy. Conversely, a crossover below indicates a sell signal.
2. Watch for Divergence: Check for divergence between MACD and price. If prices are making new highs while MACD isn't, it may signal a reversal.
3. Confirm with Volume: Use volume as a confirmation tool. Increased volume during a MACD crossover strengthens the signal.
4. Set Entry and Exit Points: Enter trades at MACD crossovers and set stop-loss orders just below recent lows or above highs to manage risk.
5. Combine with Other Indicators: Enhance your strategy by combining MACD with other indicators like RSI or moving averages for better accuracy.
6. Practice Risk Management: Always manage your risk by determining position sizes and setting a maximum loss for each trade.
Implement these tactics to effectively use MACD in your day trading strategies.
What Are the Key Components of the MACD Indicator?
The key components of the MACD indicator are:
1. MACD Line: The difference between the 12-day and 26-day exponential moving averages (EMAs).
2. Signal Line: A 9-day EMA of the MACD line, used to generate buy and sell signals.
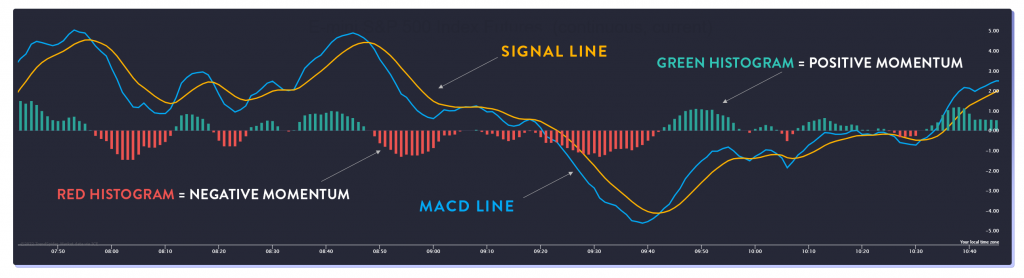
3. Histogram: Represents the difference between the MACD line and the signal line, indicating momentum strength.
These elements help day traders identify trends, potential reversals, and entry or exit points.
How Do I Interpret MACD Signals for Day Trading?
To interpret MACD signals for day trading, focus on the following:
1. Crossover: Buy when the MACD line crosses above the signal line; sell when it crosses below. This indicates a potential trend change.
2. Divergence: Look for divergence between MACD and price. If prices are rising while MACD is falling, it may signal a reversal.
3. Histogram: Analyze the histogram for momentum. A rising histogram suggests increasing bullish momentum; a falling one indicates bearish pressure.
4. Zero Line: Watch for crossings above or below the zero line. Above suggests bullish conditions; below indicates bearish conditions.
Use these signals in conjunction with other indicators for better accuracy.
What Are the Common MACD Trading Strategies for Day Traders?
Common MACD trading strategies for day traders include:
1. MACD Crossover: Buy when the MACD line crosses above the signal line; sell when it crosses below.
2. Divergence: Look for price divergence with MACD. If prices are making new highs but MACD is not, it signals a potential reversal.
3. MACD Histogram: Use the histogram to gauge momentum. A rising histogram suggests strong momentum; consider entering trades in the direction of the trend.
4. Signal Line Rejections: If the MACD line bounces off the signal line without crossing, it can indicate a continuation of the current trend.
5. Timeframe Confluence: Combine MACD signals across different timeframes to confirm trade setups for better accuracy.
These strategies help day traders identify entry and exit points based on momentum and trend strength using the MACD indicator.
How Can I Combine MACD with Other Indicators for Better Results?
To combine MACD with other indicators for better results, consider using the following strategies:
1. RSI (Relative Strength Index): Use MACD to confirm buy/sell signals from RSI. For example, if MACD crosses above the signal line and RSI is below 30, it indicates a potential buy opportunity.
2. Moving Averages: Pair MACD with moving averages (like the 50-day and 200-day) to identify trends. A MACD crossover above the signal line alongside a price above the moving average suggests a strong bullish trend.
3. Bollinger Bands: Look for MACD signals at the upper or lower bands. If MACD shows bullish divergence while price touches the lower band, it may signal a reversal.
4. Volume Indicators: Confirm MACD signals with volume. Increased volume on a MACD crossover can validate the strength of the trend.
5. Stochastic Oscillator: Use it alongside MACD to avoid false signals. If both indicators show overbought or oversold conditions, it strengthens the case for a trade.
By integrating these indicators with MACD, you can enhance your trading strategy and make more informed decisions.
What Are the Advantages of Using MACD in Day Trading?
The MACD (Moving Average Convergence Divergence) offers several advantages for day trading. First, it helps identify trend direction through its signal and MACD lines, allowing traders to make informed buy or sell decisions. Second, the MACD histogram provides insights into momentum, signaling potential reversals or continuations. Third, its convergence and divergence patterns can indicate overbought or oversold conditions, helping traders spot entry and exit points. Lastly, MACD is straightforward to interpret, making it accessible for both novice and experienced traders.
What Are the Limitations of MACD for Day Traders?
The limitations of MACD for day traders include lagging signals, as it relies on historical price data, which can lead to late entries or exits. It can generate false signals in choppy markets, causing traders to act on noise rather than trends. Additionally, MACD may not effectively capture rapid price movements, making it less reliable in volatile conditions. Over-reliance on MACD can also lead to ignoring other important indicators or market conditions, potentially missing better trading opportunities.
How Do I Set Up MACD on Trading Platforms?
To set up MACD on trading platforms, follow these steps:
1. Open Your Trading Platform: Log into your account.
2. Select a Chart: Choose the asset or currency pair you want to analyze.
3. Add Indicators: Look for an option to add indicators or studies, often found in a toolbar or menu.
4. Find MACD: Search for "MACD" in the indicator list.
5. Customize Settings (Optional): Default settings are usually 12, 26, and 9 for the fast EMA, slow EMA, and signal line, respectively. Adjust if needed.
6. Apply the Indicator: Click to add MACD to your chart.
Now you can analyze trends and potential buy/sell signals using the MACD tool.
What Time Frames Work Best with MACD for Day Trading?
For day trading with MACD, the best time frames are typically 5-minute, 15-minute, and 30-minute charts. These shorter time frames provide quicker signals and help capitalize on intraday price movements. Many traders combine the 15-minute chart for trend direction with the 5-minute chart for entry and exit points. Adjust based on your trading style and market conditions for optimal results.
How Can I Avoid False Signals When Using MACD?
To avoid false signals when using MACD, focus on these strategies:
1. Confirm with Price Action: Look for confirmation in price movements before acting on MACD signals. Check for support and resistance levels.
2. Use Multiple Time Frames: Analyze MACD across different time frames. A signal on a longer time frame can validate a shorter-term signal.
3. Combine with Other Indicators: Use MACD alongside other indicators like RSI or moving averages to filter out false signals.
4. Watch for Divergences: Be cautious of MACD divergences, as they often indicate potential reversals that may not align with the current trend.
5. Adjust MACD Settings: Tailor the MACD settings to suit your trading style. A longer EMA can reduce noise and false signals.
Implementing these techniques will enhance your MACD trading accuracy.
What Are Some Real-Life Examples of MACD Day Trading?
1. AAPL (Apple Inc.): A day trader noticed the MACD line crossing above the signal line during the morning, indicating a bullish trend. They bought shares, capitalizing on the price surge before selling in the afternoon.
2. TSLA (Tesla, Inc.): A trader observed a MACD divergence where the stock price rose but the MACD showed a downward trend. They shorted the stock, profiting when the price corrected later in the day.
3. SPY (S&P 500 ETF): A day trader used the MACD to confirm a buy signal after a strong breakout above a resistance level. They entered the trade and exited once the MACD showed signs of weakening momentum.
4. NFLX (Netflix): After the MACD crossed below the signal line, a trader shorted shares, anticipating a downturn. They closed the position when the MACD reversed, securing profits.
5. GOOGL (Alphabet Inc.): A trader waited for a MACD crossover to enter a long position after a period of consolidation, riding the upward trend and exiting as the MACD neared overbought territory.
How Does MACD Compare to Other Technical Indicators?
MACD (Moving Average Convergence Divergence) is a momentum indicator that shows the relationship between two moving averages of a security’s price. Compared to other technical indicators like RSI (Relative Strength Index) and Bollinger Bands, MACD is more effective for identifying trends and momentum shifts. While RSI focuses on overbought or oversold conditions, MACD helps traders pinpoint buy and sell signals through crossovers. Bollinger Bands measure volatility and price levels but lack the momentum insights MACD provides. Overall, MACD offers a balance of trend analysis and momentum, making it essential for day traders.
What Should I Look for in MACD Divergence?
When looking for MACD divergence, focus on these key points:
1. Identify Divergence: Look for discrepancies between the MACD line and the price action. If prices are making new highs or lows but the MACD isn’t, it signals potential reversals.
2. Check Signal Line Crossovers: Ensure the MACD line crosses the signal line in the direction of your trade after identifying divergence for confirmation.
3. Volume Analysis: Confirm divergence with volume trends. Increased volume on the divergence can strengthen the signal.
4. Timeframe Alignment: Use multiple timeframes to validate the divergence. A divergence on a longer timeframe can be more significant than on a short one.
5. Combine with Other Indicators: Incorporate other tools, like support/resistance levels or RSI, to enhance the reliability of your divergence signals.
These steps will help you effectively utilize MACD divergence in your day trading strategy.
How Can I Practice Using MACD Before Day Trading Live?
To practice using MACD before day trading live, follow these steps:
1. Use a Demo Account: Open a demo trading account with a broker that offers MACD tools. This allows you to trade without risking real money.
2. Backtest Strategies: Analyze historical price data using MACD. Identify entry and exit points and see how your strategies would have performed.
3. Paper Trading: Simulate trades on paper. Track your trades, decisions, and outcomes based on MACD signals.
4. Charting Software: Utilize charting platforms like TradingView or ThinkorSwim. Customize MACD settings and practice recognizing patterns.
5. Join Trading Communities: Engage with forums or social media groups focused on day trading. Share insights and get feedback on your MACD strategies.
6. Record and Review: Keep a journal of your practice trades. Note the MACD signals you followed and the results to refine your approach.
By following these steps, you'll build confidence in using MACD effectively in live day trading.
Learn about How to Analyze Historical Data Using Day Trading Charts
What Resources Are Available to Learn More About MACD?
To learn more about MACD, check out these resources:
1. Books: "Technical Analysis of the Financial Markets" by John Murphy covers MACD in detail.
2. Online Courses: Websites like Investopedia and Coursera offer courses on technical analysis, including MACD.
3. YouTube: Channels like Rayner Teo and The Trading Channel provide tutorials and practical examples of using MACD.
4. Trading Platforms: Many platforms like TradingView offer built-in tutorials and community forums discussing MACD strategies.
5. Blogs: Sites like StockCharts and BabyPips have articles explaining MACD and its applications in day trading.
These resources will enhance your understanding and application of MACD in trading.
Conclusion about MACD: An Essential Tool for Day Traders
Incorporating the MACD indicator into your day trading strategy can enhance your decision-making process, offering insights into market momentum and potential reversals. By understanding its components and how to interpret signals, traders can develop effective strategies while remaining aware of its limitations. For those looking to deepen their trading knowledge and skills, resources from DayTradingBusiness can provide invaluable guidance on mastering MACD and optimizing your trading performance.