Did you know that even a broken clock is right twice a day? Just like that, stochastic indicators can be a trader's best friend—or worst enemy—if not properly understood. In this article, we’ll dive into the essentials of stochastic indicators in day trading. You'll learn what they are, how they work, and the formula for calculating them. We’ll cover interpretation of values, different types available, and optimal setup on your trading platform.
Discover the best settings, strategies for identifying overbought or oversold conditions, and how to avoid false signals. We’ll also touch on the ideal time frames for effective use and the process of backtesting your strategies. While there are clear advantages to using stochastic indicators, we'll also discuss their limitations. By the end, you’ll be equipped to use stochastic indicators for precise entry and exit points, enhancing your day trading skills with insights from DayTradingBusiness.
What are stochastic indicators in day trading?
Stochastic indicators in day trading are momentum indicators that compare a security's closing price to its price range over a specific period. They help traders identify overbought or oversold conditions.
To use stochastic indicators effectively, look for values above 80 to signal overbought conditions and below 20 for oversold conditions. Combine them with other indicators or price action for confirmation before making trades. This approach can enhance entry and exit points, improving your trading strategy.
How do stochastic indicators work in trading?
Stochastic indicators measure momentum by comparing a security's closing price to its price range over a specific period. They consist of two lines: %K, which indicates the current price relative to the range, and %D, a moving average of %K.
In day trading, use stochastic indicators to identify overbought or oversold conditions. When the %K line crosses above the %D line below the 20 level, it signals a potential buy. Conversely, when %K crosses below %D above the 80 level, it suggests a potential sell.
Combine these signals with other indicators for confirmation, like volume or trend lines, to enhance accuracy.
What is the formula for calculating stochastic indicators?
The formula for calculating the stochastic indicator is:
%K = 100 * (Current Close – Lowest Low) / (Highest High – Lowest Low)
Where:
– Current Close is the most recent closing price.
– Lowest Low is the lowest price over the specified period.
– Highest High is the highest price over the specified period.
To find the %D line, which is a smoothed version of %K, use a simple moving average (SMA) of %K over a set number of periods, often 3.
In day trading, use these values to identify overbought or oversold conditions, typically with thresholds of 80 for overbought and 20 for oversold.
How can I interpret stochastic indicator values?
To interpret stochastic indicator values, look at the values between 0 and 100. A reading above 80 indicates overbought conditions, suggesting a potential price reversal. A reading below 20 signals oversold conditions, indicating a possible price increase. Focus on the crossover of the %K line and %D line; a %K crossing above %D can signal a buy, while crossing below can indicate a sell. Use these signals alongside other indicators for confirmation.
What are the different types of stochastic indicators?
The main types of stochastic indicators are:
1. Stochastic Oscillator: Measures momentum by comparing a security's closing price to its price range over a specific period. It generates two lines: %K (the main line) and %D (the signal line).
2. Full Stochastic: A variation that smooths the %K line, making it less sensitive to price fluctuations, which can help identify trends more clearly.
3. Slow Stochastic: Similar to the full stochastic but uses a longer period for smoothing, providing fewer signals and potentially reducing false positives.
4. Fast Stochastic: Reacts quickly to price changes and helps traders catch short-term movements, but may lead to more noise.
Use these indicators in day trading to identify overbought or oversold conditions, helping you make informed buy or sell decisions.
How do I set up stochastic indicators on my trading platform?
To set up stochastic indicators on your trading platform, follow these steps:
1. Open Your Trading Platform: Launch your trading software.
2. Select a Chart: Choose the asset you want to trade and open its chart.
3. Add Indicator: Look for an “Indicators” or “Studies” option, usually found in the top menu or toolbar.
4. Search for Stochastic: Type “Stochastic” in the search bar or find it in the list of indicators.
5. Configure Settings: Click on the stochastic indicator to customize parameters, typically including %K and %D periods. Common settings are 14 for %K and 3 for %D.
6. Apply the Indicator: Confirm your settings and apply the indicator to your chart.
7. Analyze: Use the stochastic indicator to identify overbought or oversold conditions in your day trading strategy.
Once set up, monitor the indicator alongside price action for optimal trading decisions.
What are the best settings for stochastic indicators?
The best settings for stochastic indicators in day trading typically use a %K period of 14 and a %D period of 3. You can also set the slowing period to 3 for smoother signals. Adjusting the %K to a shorter period, like 5, can provide more sensitivity for quick trades. However, always test these settings on your specific chart and market conditions to find what works best for you.
How do stochastic indicators help identify overbought or oversold conditions?
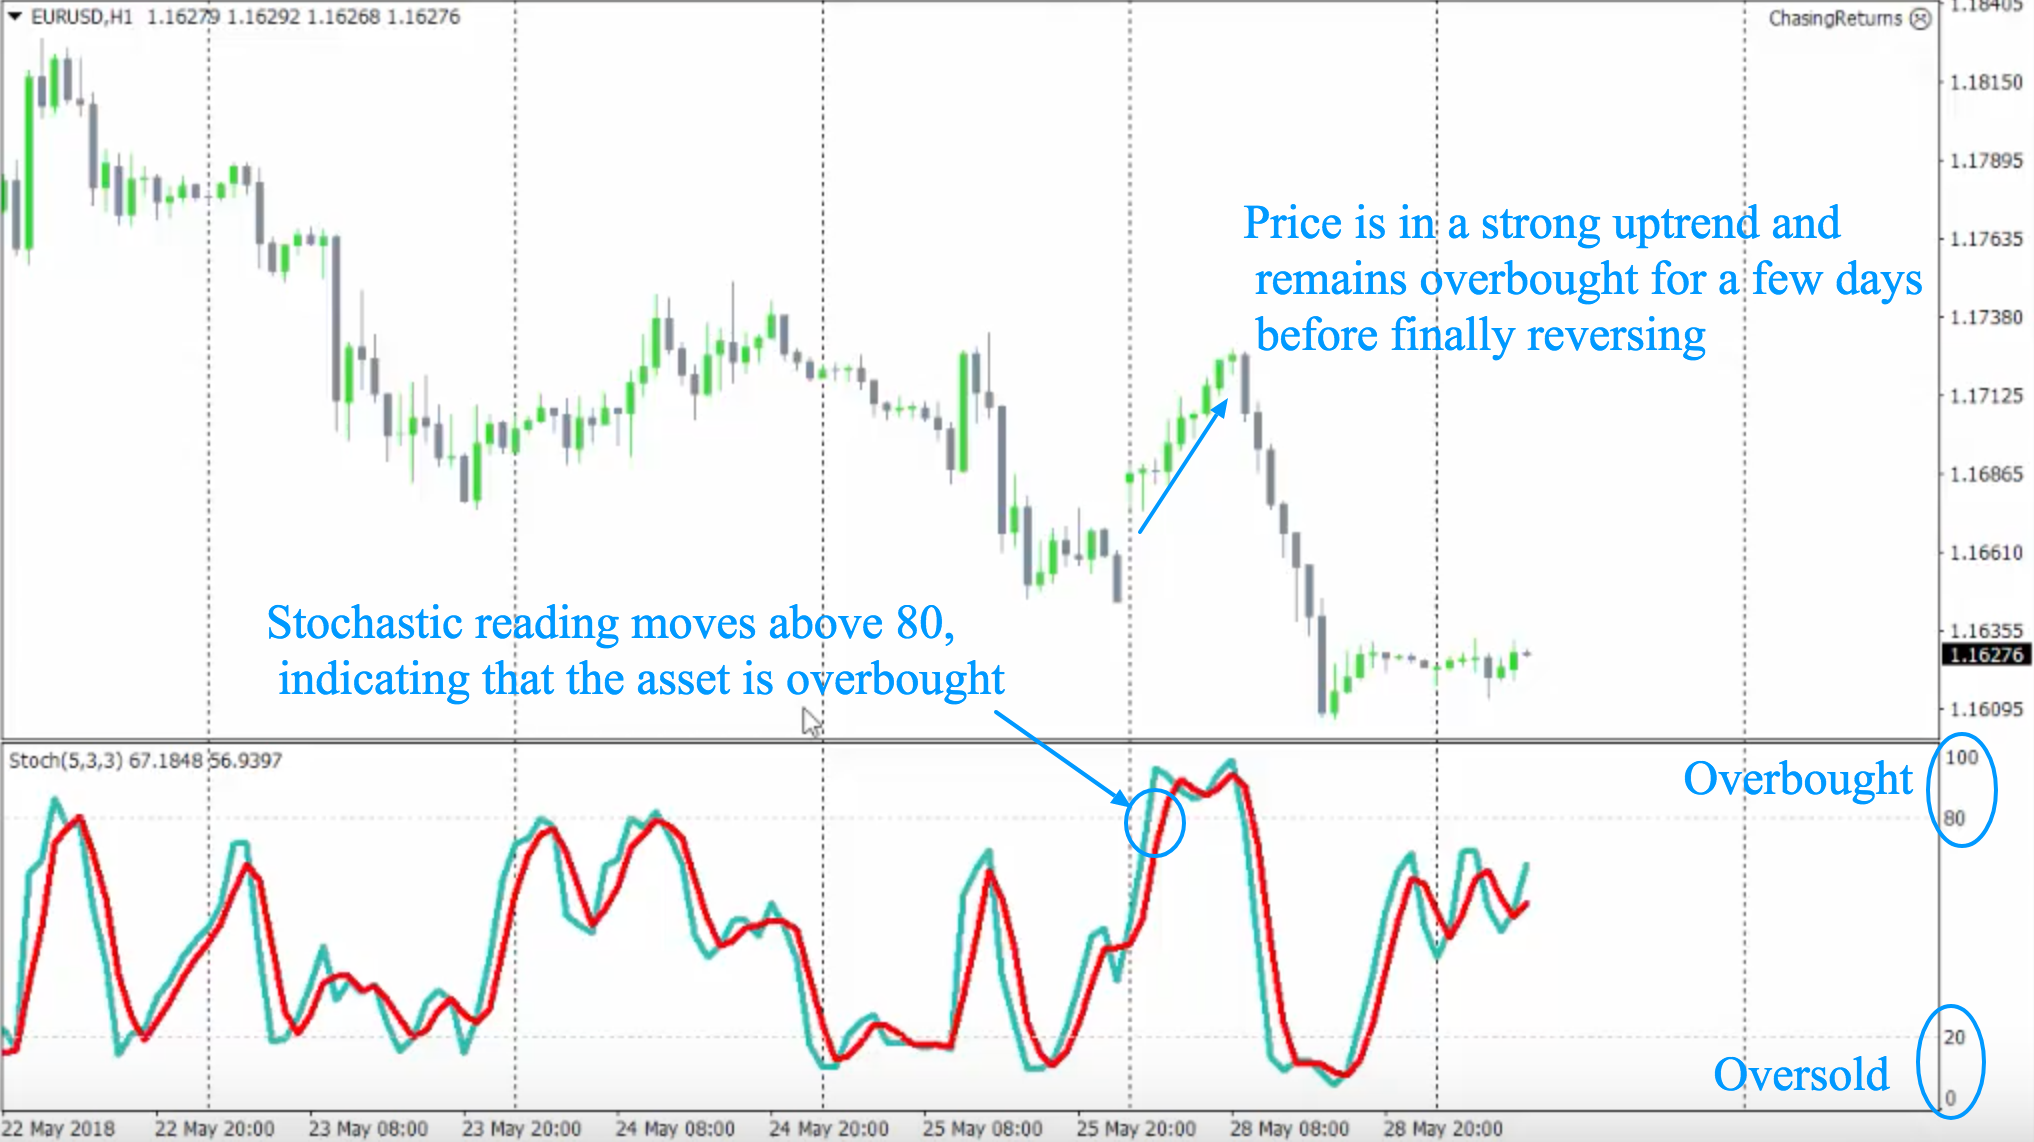
Stochastic indicators help identify overbought or oversold conditions by comparing a security's closing price to its price range over a specific period. When the stochastic value is above 80, it signals overbought conditions, suggesting a potential price decline. Conversely, a value below 20 indicates oversold conditions, hinting at a possible price increase. Day traders use these thresholds to make informed decisions about entry and exit points, capitalizing on potential reversals in price trends.
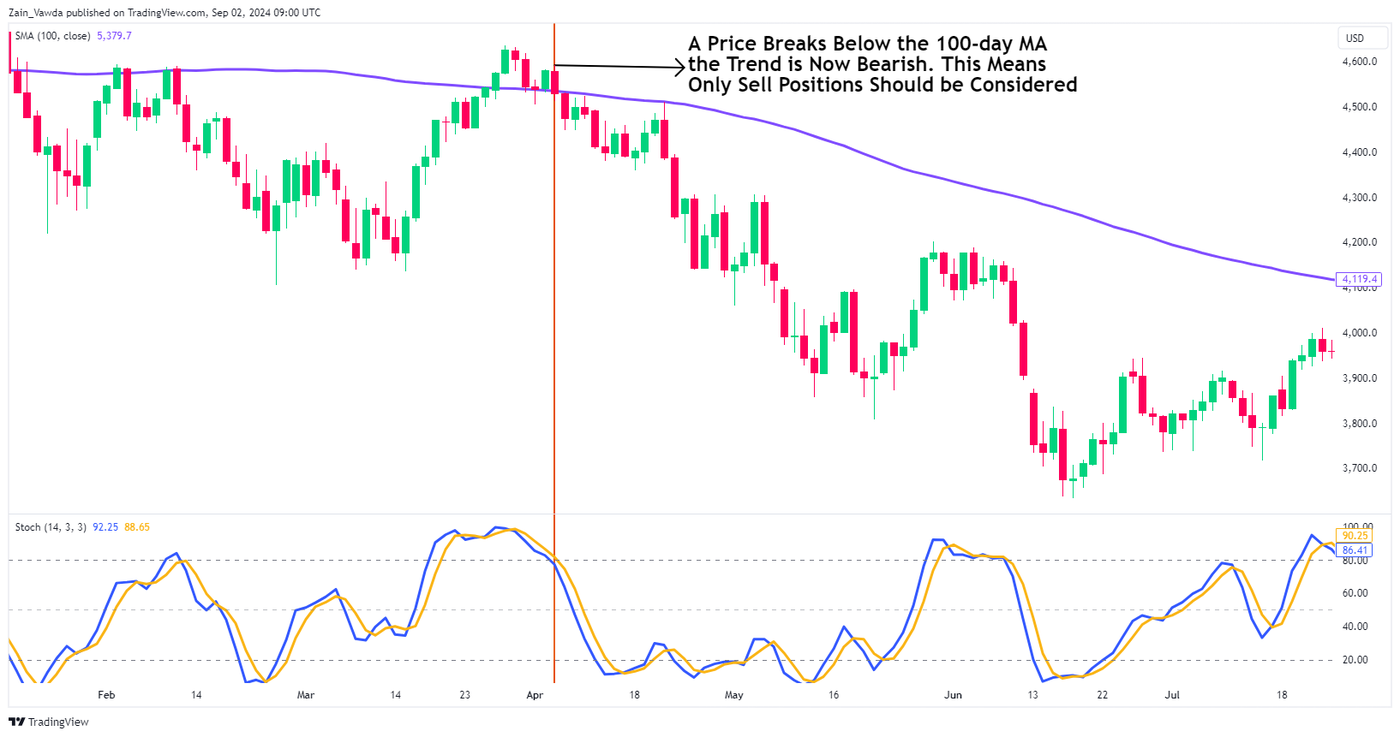
Can stochastic indicators be used in combination with other indicators?
Yes, stochastic indicators can be effectively combined with other indicators in day trading. For instance, pairing the stochastic oscillator with moving averages can help confirm trends. You might also use it alongside RSI to identify overbought or oversold conditions more accurately. This combination enhances decision-making by providing multiple signals for entry and exit points.
What are the common strategies for using stochastic indicators in day trading?
Common strategies for using stochastic indicators in day trading include:
1. Overbought/Oversold Conditions: Use the stochastic oscillator to identify overbought (above 80) and oversold (below 20) levels, signaling potential reversals.
2. Crossovers: Look for the %K line crossing above the %D line as a buy signal and crossing below as a sell signal.
3. Divergence: Watch for divergence between the stochastic indicator and price action; if prices make new highs while stochastic does not, it may indicate a reversal.
4. Trend Confirmation: In a strong trend, use the indicator to confirm the trend direction; buy in an uptrend when stochastic dips below 20 and then crosses back above.
5. Multiple Timeframe Analysis: Combine signals from different timeframes; for example, confirm a signal on a 5-minute chart with a higher timeframe.
6. Setting Stop Losses: Use stochastic levels to set stop losses; place them just outside the overbought/oversold regions based on your entry point.
Implementing these strategies can enhance decision-making in day trading with stochastic indicators.
How can I avoid false signals with stochastic indicators?
To avoid false signals with stochastic indicators in day trading, follow these strategies:
1. Use Multiple Time Frames: Check stochastic readings on different time frames to confirm trends.
2. Combine with Other Indicators: Pair stochastic indicators with tools like moving averages or RSI for stronger signals.
3. Look for Divergence: Watch for divergence between price action and the stochastic indicator; this can indicate potential reversals.
4. Set Thresholds: Adjust the overbought and oversold levels (typically 80/20) to better fit the current market conditions.
5. Confirm with Price Action: Wait for price action confirmation, such as candlestick patterns, before acting on stochastic signals.
6. Avoid Whipsaws in Sideways Markets: Be cautious in ranging markets, as stochastic can generate false signals. Wait for clear breakouts.
By applying these techniques, you can enhance the accuracy of your stochastic indicator signals in day trading.
What time frames are best for using stochastic indicators in day trading?
The best time frames for using stochastic indicators in day trading are typically 5-minute, 15-minute, and 30-minute charts. These shorter intervals allow traders to capture quick price movements and identify overbought or oversold conditions effectively. Use the stochastic oscillator to spot entry and exit points, focusing on divergence and crossovers for optimal signals.
Learn about What Are the Best Practices for Using AI in Day Trading?
How do I backtest stochastic indicator strategies?

To backtest stochastic indicator strategies, follow these steps:
1. Choose a Trading Platform: Use software like MetaTrader, TradingView, or any platform that supports backtesting.
2. Select Your Asset: Pick the stocks, forex pairs, or commodities you want to test.
3. Define Your Strategy: Specify your entry and exit rules based on stochastic signals. For example, buy when the stochastic crosses above 20 and sell when it crosses below 80.
4. Gather Historical Data: Ensure you have sufficient historical price data for the asset.
5. Set Parameters: Configure the stochastic settings (e.g., %K, %D) according to your strategy.
6. Run the Backtest: Execute the backtest to simulate trades based on historical data, applying your defined rules.
7. Analyze Results: Review metrics like win rate, profit factor, and drawdown to evaluate performance.
8. Refine Your Strategy: Adjust parameters or rules based on insights from the backtest.
9. Repeat: Conduct multiple backtests across different time frames and market conditions for robustness.
What are the advantages of using stochastic indicators in day trading?
Stochastic indicators help identify overbought or oversold conditions, allowing traders to spot potential reversal points. They provide clear entry and exit signals based on momentum, enhancing decision-making. By comparing a security’s closing price to its price range over a specific period, they help traders gauge market sentiment. Stochastic indicators can also confirm trends when used alongside other tools, increasing the accuracy of trades. Overall, they enhance trading strategies by adding a layer of analysis focused on price momentum.
Are there any limitations to using stochastic indicators?
Yes, there are limitations to using stochastic indicators in day trading. They can produce false signals during strong trends, leading to misleading buy or sell opportunities. Stochastic indicators may also lag behind price action, causing delayed reactions. Additionally, they are less effective in sideways or choppy markets, where they can generate frequent whipsaws. It's essential to combine them with other indicators or tools for confirmation to improve accuracy.
How do I use stochastic indicators for entry and exit points?
To use stochastic indicators for entry and exit points in day trading, follow these steps:
1. Identify Overbought and Oversold Levels: Use the standard setting of 80 for overbought and 20 for oversold on the stochastic oscillator.
2. Look for Crossovers: Enter a buy position when the %K line crosses above the %D line in the oversold zone (below 20). Exit when the %K crosses below %D in the overbought zone (above 80).
3. Confirm with Price Action: Check for bullish or bearish candlestick patterns to confirm entry and exit signals.
4. Set Stop Losses: Always place stop losses below the recent swing low for buy orders and above the swing high for sell orders to manage risk.
5. Monitor Divergence: Look for divergences between the stochastic indicator and the price trend. If prices are making new highs while the indicator is not, it may signal a potential reversal.
By applying these methods, you can effectively use stochastic indicators to determine optimal entry and exit points in day trading.
Conclusion about How to Use Stochastic Indicators in Day Trading
Incorporating stochastic indicators into your day trading strategy can enhance your ability to identify market trends and potential entry and exit points. Understanding their calculation, interpretation, and best practices is crucial for effective trading. While they offer advantages such as spotting overbought and oversold conditions, it's important to be aware of their limitations and avoid false signals by combining them with other indicators. For a comprehensive approach to mastering trading techniques, consider leveraging the expertise and resources available through DayTradingBusiness.
Learn about How to Use Technical Indicators with Day Trading Patterns