Did you know that some day traders rely on indicators so much, they might as well have a crystal ball on their desk? In this article, we dive into the effectiveness of various day trading indicators, covering the most popular options and how to choose the right ones for your trading style. Discover the role of moving averages, the impact of momentum and volume indicators, and the best technical tools for beginners. We also explore key concepts like RSI, Bollinger Bands, MACD, and the significance of support and resistance levels. Learn how to evaluate the reliability of indicators, their limitations, and how to combine them for optimal results. Plus, we’ll highlight free tools to test your strategies and discuss how market conditions can influence indicator effectiveness. With insights from DayTradingBusiness, you’ll be better equipped to enhance your day trading success.
What are the most popular day trading indicators?
The most popular day trading indicators include:
1. Moving Averages (MA): Used to identify trends by smoothing price data. Common types are the Simple Moving Average (SMA) and Exponential Moving Average (EMA).
2. Relative Strength Index (RSI): Measures the speed and change of price movements to identify overbought or oversold conditions.
3. Moving Average Convergence Divergence (MACD): Shows the relationship between two moving averages to signal potential buy or sell opportunities.
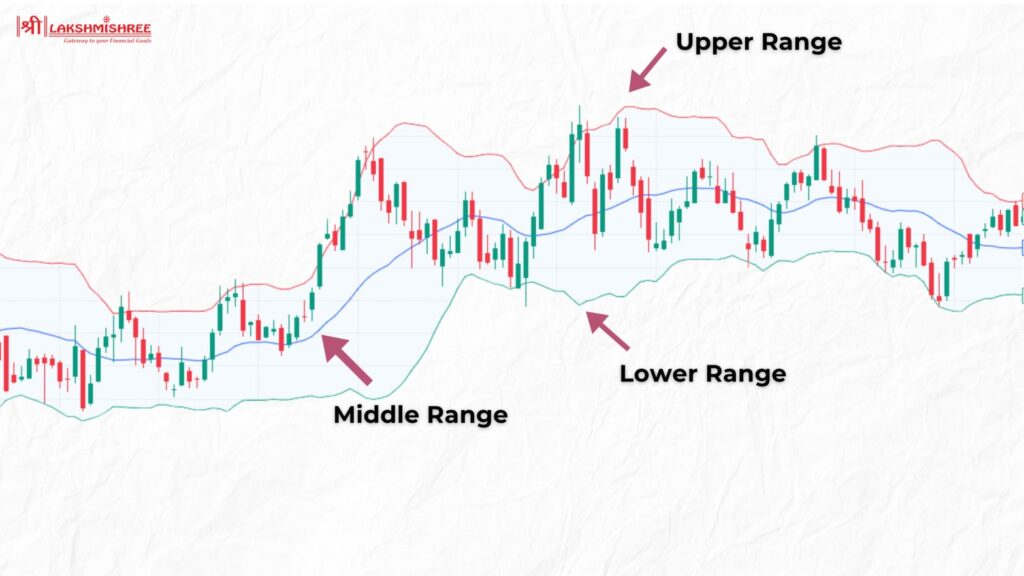
4. Bollinger Bands: Consists of a middle band (SMA) and two outer bands that indicate volatility and potential price reversals.
5. Volume: Analyzing trading volume helps confirm trends and signals; higher volume often indicates stronger moves.
6. Stochastic Oscillator: Compares a security’s closing price to its price range over a specific period, helping identify overbought or oversold conditions.
These indicators help day traders make informed decisions based on market momentum, trends, and price action.
How do I choose the right indicators for day trading?
To choose the right indicators for day trading, first identify your trading strategy. Common indicators include moving averages for trend direction, RSI for overbought/oversold conditions, and MACD for momentum. Test these indicators on historical data to see how they perform with your chosen assets. Focus on indicators that complement each other and provide clear signals. Monitor their effectiveness in real-time trading and adjust as needed based on your results. Always prioritize simplicity and clarity to avoid analysis paralysis.
What is the role of moving averages in day trading?
Moving averages in day trading serve to smooth out price data, helping traders identify trends and potential reversal points. They act as dynamic support and resistance levels, enabling traders to make informed buy or sell decisions. Short-term moving averages, like the 10-day or 20-day, are often used for quick signals, while longer ones, such as the 50-day, help confirm overall trends. By analyzing crossovers—when a short-term moving average crosses above or below a long-term average—traders can spot entry and exit points effectively.
How effective are momentum indicators for day trading?
Momentum indicators can be quite effective for day trading when used correctly. They help identify potential price trends and reversals by measuring the speed of price movements. Popular momentum indicators like the RSI or MACD can signal overbought or oversold conditions, aiding traders in making timely decisions. However, their effectiveness can vary based on market conditions and the trader's strategy. It's crucial to combine them with other tools and risk management techniques for optimal results.
Can volume indicators improve my day trading strategy?
Yes, volume indicators can significantly enhance your day trading strategy. They provide insights into market strength and help confirm price movements. For example, rising prices with increasing volume suggest strong buying interest, while falling prices with high volume may indicate selling pressure. Using volume indicators like the Volume Moving Average or On-Balance Volume can help you make more informed trading decisions and identify potential reversals or breakouts.
What are the best technical indicators for day trading beginners?
The best technical indicators for day trading beginners are:
1. Moving Averages (MA): Helps smooth price data and identify trends. The 50-day and 200-day MAs are popular choices.
2. Relative Strength Index (RSI): Measures momentum and identifies overbought or oversold conditions, aiding in entry and exit points.
3. Bollinger Bands: Show volatility and price levels. When prices touch the bands, it can indicate potential reversals.
4. Volume: Confirms trends and signals strength. Higher volume often precedes price moves, making it essential for day trading.
5. MACD (Moving Average Convergence Divergence): Tracks momentum and trend direction, useful for spotting potential buy/sell signals.
Using these indicators can help beginners make informed trading decisions.
How do I interpret RSI for day trading success?
To interpret the RSI (Relative Strength Index) for day trading, follow these steps:
1. Identify Overbought/Oversold Levels: An RSI above 70 indicates overbought conditions, while below 30 signals oversold. Look for potential reversals near these levels.
2. Watch for Divergence: If the price moves in one direction but the RSI moves in the opposite, it can signal a potential trend reversal.
3. Use Trend Confirmation: If the RSI is rising while prices are also increasing, it confirms bullish momentum. Conversely, a falling RSI with declining prices signals bearish momentum.
4. Set Entry/Exit Points: Use RSI readings to time your entries and exits. For example, consider buying when the RSI crosses above 30 and selling when it drops below 70.
5. Combine with Other Indicators: To enhance accuracy, use RSI alongside other indicators like moving averages or MACD for confirmation.
By integrating these strategies, you can effectively leverage RSI to improve your day trading success.
What are the advantages of using Bollinger Bands in day trading?
Bollinger Bands offer several advantages for day trading. They help identify volatility, showing when a stock may be overbought or oversold. The bands expand and contract based on market conditions, providing clear signals for entry and exit points. Traders can use the bands to spot trends and potential reversals, enhancing decision-making. Additionally, they can combine Bollinger Bands with other indicators for more robust analysis. Overall, they enhance risk management and improve the timing of trades.
How can I use MACD to enhance my day trading?
To enhance your day trading with MACD, use it to identify momentum and trend reversals. Look for MACD line crossovers: a bullish crossover (when the MACD line crosses above the signal line) suggests buying, while a bearish crossover indicates selling. Pay attention to divergence; if price moves in the opposite direction of MACD, it could signal a reversal. Combine MACD with other indicators like volume or moving averages for confirmation. Set clear entry and exit points based on MACD signals to manage risk effectively.
What is the importance of support and resistance levels in day trading?
Support and resistance levels are crucial in day trading because they indicate where prices may reverse or stall. Support is the price level where buying interest overcomes selling pressure, while resistance is where selling interest exceeds buying. These levels help traders identify entry and exit points, set stop-loss orders, and gauge potential price movements. Recognizing these levels can enhance decision-making and improve overall trading effectiveness.
Learn about Identifying Support and Resistance Levels in Day Trading
How do I evaluate the reliability of day trading indicators?
To evaluate the reliability of day trading indicators, follow these steps:
1. Backtesting: Test the indicator on historical data. Check its performance across different market conditions to see if it consistently generates profitable signals.
2. Timeframe Analysis: Assess how the indicator performs on various timeframes. Some indicators may be reliable on shorter timeframes but not on longer ones.
3. Statistical Analysis: Use metrics like win rate, risk-reward ratio, and drawdown to quantify effectiveness. A higher win rate paired with a solid risk-reward ratio indicates reliability.
4. Combine Indicators: Use multiple indicators to confirm signals. For example, pairing a momentum indicator with a trend-following indicator can enhance reliability.
5. Market Conditions: Consider the current market environment. Some indicators perform better in trending markets, while others are suited for ranging markets.
6. User Feedback: Look for reviews or testimonials from other traders who have used the indicator. Real-world experiences can provide insights into its reliability.
7. Adaptability: Ensure the indicator can adapt to changing market conditions. Indicators that require constant tweaking may not be dependable.
By applying these methods, you can effectively gauge the reliability of day trading indicators.
Learn about How Do Prop Firms Evaluate Day Trading Performance?
What are the limitations of using indicators in day trading?
Indicators in day trading have several limitations:
1. Lagging Nature: Many indicators are based on past data, which can delay signals and lead to missed opportunities.
2. False Signals: Indicators can produce unreliable signals during volatile market conditions, resulting in poor trades.
3. Over-reliance: Traders may depend too much on indicators, neglecting market context and price action.
4. Complexity: Some indicators can be confusing, leading to misinterpretation and decision paralysis.
5. Market Changes: Indicators may not adapt well to changes in market conditions, making them less effective over time.
Understanding these limitations is crucial for effective day trading.
How can I combine multiple indicators for better trading results?
To combine multiple indicators for better trading results, start by selecting indicators that complement each other. For example, use a trend indicator like the Moving Average alongside a momentum indicator like the RSI. Look for signals that align, such as a bullish crossover in the Moving Average coinciding with an RSI below 30. This strengthens your entry point.
Avoid redundancy; don’t use indicators that provide the same information, like two momentum indicators. Test your combination through backtesting to ensure effectiveness. Finally, adjust your strategy based on market conditions and maintain a disciplined risk management approach to enhance your trading performance.
What are the best free tools for testing day trading indicators?
The best free tools for testing day trading indicators include:
1. TradingView: Offers a wide range of technical analysis tools and customizable indicators. You can backtest strategies using historical data.
2. StockCharts: Provides robust charting capabilities and various technical indicators, allowing for effective analysis.
3. Thinkorswim by TD Ameritrade: Offers a paper trading feature where you can test indicators in real-time without risking actual money.
4. MetaTrader 4 (MT4): A popular platform for backtesting and optimizing trading strategies with various technical indicators.
5. Investing.com: Features a comprehensive set of charts and indicators for real-time analysis and strategy testing.
These tools help traders evaluate the effectiveness of their day trading indicators efficiently.
Learn about Best Free Day Trading Software Available
How do market conditions affect the effectiveness of trading indicators?
Market conditions significantly influence the effectiveness of trading indicators. In trending markets, indicators like moving averages can provide clear signals, helping traders identify entry and exit points. Conversely, in sideways or choppy markets, these same indicators may give false signals, leading to losses. Volatility also plays a role; during high volatility, indicators might react too slowly, causing missed opportunities. Economic news and events can further distort indicator reliability by causing sudden price movements. Therefore, understanding current market conditions is crucial for effectively utilizing trading indicators.
Learn about How Does Market Microstructure Affect Day Trading Strategies?
What strategies can I use to validate my day trading indicators?
To validate your day trading indicators, use these strategies:
1. Backtesting: Apply your indicators to historical data to see how they would have performed. Analyze metrics like win rate and risk-reward ratio.
2. Forward Testing: Implement your indicators in a simulated environment or with a small live account. Monitor their performance over time to assess reliability.
3. Diversification: Combine multiple indicators to confirm signals. This can reduce false positives and enhance accuracy.
4. Statistical Analysis: Use tools like correlation coefficients to evaluate how well your indicators predict price movements compared to actual outcomes.
5. Market Conditions: Test your indicators across different market conditions (bull, bear, and sideways) to ensure they work consistently.
6. Peer Review: Share your indicators with experienced traders for feedback. Their insights can help identify strengths and weaknesses.
7. Continuous Learning: Stay updated on market trends and adapt your indicators as needed. This helps maintain their effectiveness over time.
Conclusion about Evaluating the Effectiveness of Day Trading Indicators
In conclusion, effectively evaluating day trading indicators requires a clear understanding of their roles, strengths, and limitations. By carefully choosing and interpreting indicators like moving averages, RSI, and MACD, traders can refine their strategies to adapt to market conditions. Combining multiple indicators and utilizing free testing tools can further enhance trading outcomes. For those looking to deepen their trading knowledge and improve their strategies, DayTradingBusiness offers valuable insights and resources to support your journey.