Did you know that even a broken clock is right twice a day? In day trading, the right indicators at the right settings can make all the difference in your trading success. This article dives into essential indicator settings tailored for day trading, covering how to select indicators, optimize moving averages, and effectively use tools like Bollinger Bands, RSI, and MACD. We'll also explore volume indicators, Fibonacci retracement setups, and the Stochastic Oscillator, while providing insights on customizing indicators for various markets. Plus, discover the best timeframes for day trading and tips for backtesting your strategies. Avoid common pitfalls and learn how to combine multiple indicators for optimal results. With the expertise from DayTradingBusiness, you’ll be equipped to enhance your trading strategy and boost your performance.
What are the best indicator settings for day trading?
The best indicator settings for day trading vary by strategy, but commonly used settings include:
1. Moving Averages: Use the 9 EMA (Exponential Moving Average) for short-term trends and the 21 EMA for slightly longer trends.
2. Relative Strength Index (RSI): Set at 14 periods, with overbought at 70 and oversold at 30.
3. Bollinger Bands: Use a 20-period SMA with standard deviations set to 2 for volatility assessment.
4. MACD: Set the fast EMA to 12, the slow EMA to 26, and the signal line to 9.
5. Volume: Monitor volume spikes against the average for confirmation of price movements.
Adjust these settings based on your specific trading style and asset.
How do I choose the right indicators for day trading?
To choose the right indicators for day trading, focus on a few key types: trend indicators, momentum indicators, and volume indicators.
1. Trend Indicators: Use moving averages (like the 50-day and 200-day) to identify market direction. Shorter averages (like the 9-day or 20-day) can provide entry signals.
2. Momentum Indicators: Consider the Relative Strength Index (RSI) for overbought or oversold conditions. A setting of 14 periods is common, but adjust based on your trading style.
3. Volume Indicators: Look at volume bars or the On-Balance Volume (OBV) to confirm trends. High volume on price moves can indicate strength.
Combine these indicators based on your strategy. Test them in a demo account to see which settings align with your trading style and risk tolerance.
What is the ideal moving average setting for day trading?
The ideal moving average setting for day trading is typically the 9-period and 21-period exponential moving averages (EMAs). The 9 EMA reacts quickly to price changes, while the 21 EMA provides a smoother trend line. Traders often use the crossover of these two EMAs to identify entry and exit points. For additional confirmation, you can also consider the 50 EMA for trend direction.
How do Bollinger Bands work for day trading?
Bollinger Bands consist of a middle band (simple moving average) and two outer bands that represent volatility. For day trading, set the middle band to a 20-period SMA. The outer bands are typically set at two standard deviations above and below the middle band.
Traders use these bands to identify overbought or oversold conditions. When the price touches the upper band, it may signal a sell opportunity; when it hits the lower band, it might indicate a buy opportunity. Additionally, a squeeze, where the bands come close together, suggests low volatility and potential price expansion, making it a key signal for day traders to watch. Adjust settings based on the asset's volatility and your trading style for optimal results.
What settings should I use for RSI in day trading?
For day trading with the Relative Strength Index (RSI), set your RSI period to 14. Use overbought and oversold levels at 70 and 30, respectively. Consider adjusting the period to 9 for a more sensitive response in fast-moving markets. Monitor for divergence with price action to enhance signals.
How can I optimize MACD settings for day trading?
To optimize MACD settings for day trading, adjust the standard parameters of 12, 26, and 9 to suit shorter time frames. Consider using a faster setting like 5, 13, and 5 to capture quicker price movements. Test these settings on a demo account to see how they perform with your trading style. Look for crossovers, divergences, and confirm signals with other indicators like RSI or volume for better accuracy. Regularly review and tweak your settings based on market conditions and your trading results.
What are the best volume indicators for day trading?
The best volume indicators for day trading include:
1. Volume: Basic but essential, it shows the number of shares traded. Look for spikes to gauge interest.
2. On-Balance Volume (OBV): Combines price and volume to indicate buying or selling pressure. Rising OBV suggests accumulation, while falling indicates distribution.
3. Accumulation/Distribution Line (A/D): Measures the cumulative flow of money into and out of an asset. A rising line indicates more buying pressure.
4. Chaikin Money Flow (CMF): Combines price and volume over a specific period. Positive CMF indicates buying pressure; negative suggests selling.
5. Average True Range (ATR): While primarily a volatility indicator, it can help assess volume trends and price movement.
Use these indicators to identify entry and exit points based on volume trends.
How do I set up Fibonacci retracement for day trading?
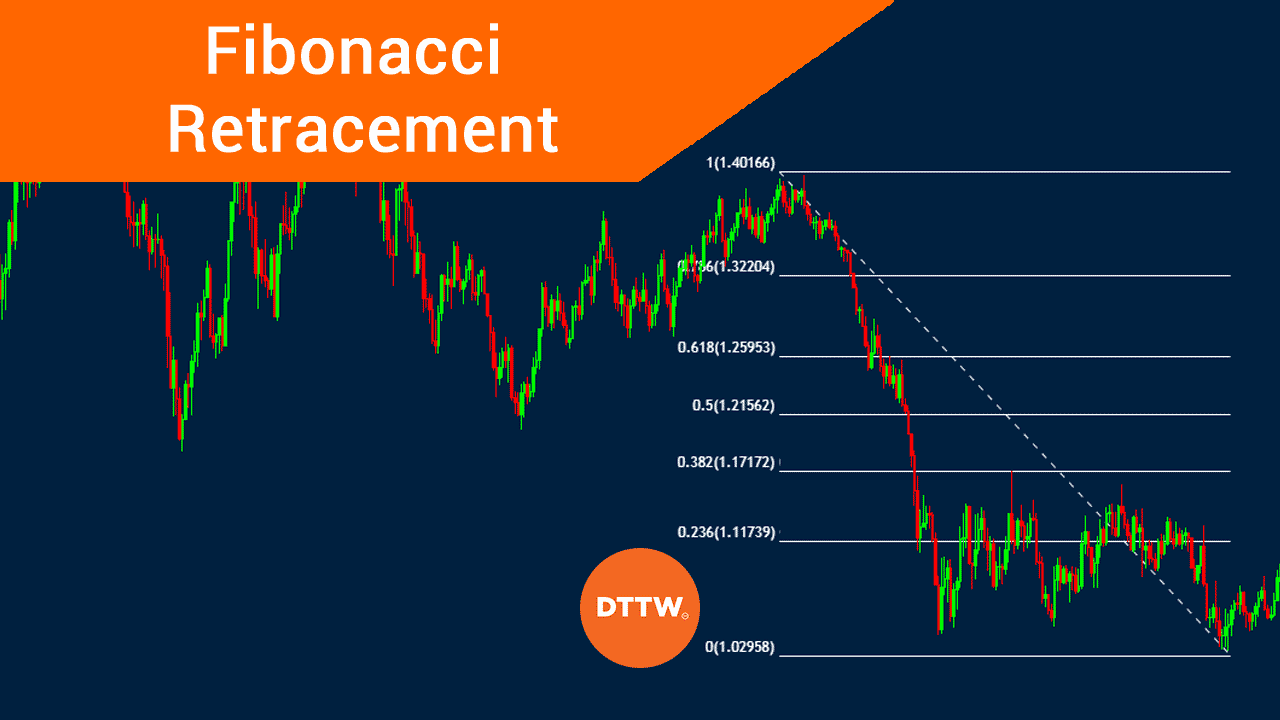
To set up Fibonacci retracement for day trading, follow these steps:
1. Identify the Trend: Determine the recent significant high and low on your chart.
2. Select the Tool: Use the Fibonacci retracement tool from your trading platform.
3. Draw the Levels: Click at the recent high, then drag the tool down to the recent low (for a downtrend) or from the low to the high (for an uptrend).
4. Observe Key Levels: The key Fibonacci levels to watch are 23.6%, 38.2%, 50%, 61.8%, and 78.6%.
5. Look for Confirmation: Wait for price action signals, such as candlestick patterns or volume spikes, at these levels before making a trade.
6. Set Stop Loss and Target: Use the Fibonacci levels for setting stop-loss orders and profit targets based on potential retracement.
Implement this method consistently for effective day trading.
What are the key settings for Stochastic Oscillator in day trading?
The key settings for the Stochastic Oscillator in day trading are typically a %K period of 14, a %D period of 3, and a slowing period of 3. You may also consider adjusting the %K period to 5 for faster signals. Use overbought levels at 80 and oversold levels at 20 to identify potential reversal points. Tailor these settings based on your trading style and market conditions for optimal results.
How can I effectively use ATR for day trading?
To effectively use the Average True Range (ATR) for day trading, set your ATR period to 14 for a balance between responsiveness and reliability. Use ATR to gauge market volatility; a higher ATR indicates more volatility, which can signal potential price movements.
Incorporate ATR to set stop-loss levels—multiply the ATR value by a factor (like 1.5 or 2) to determine your stop distance from the entry point. This helps avoid getting stopped out in normal fluctuations.
Also, consider using ATR to size your positions. A smaller ATR suggests tighter stops and smaller position sizes, while a larger ATR allows for wider stops and potentially larger positions. Adjust your strategy based on ATR readings to align with market conditions.
Learn about How Do Institutional Traders Use Leverage in Day Trading?
What are the recommended settings for Ichimoku Cloud in day trading?
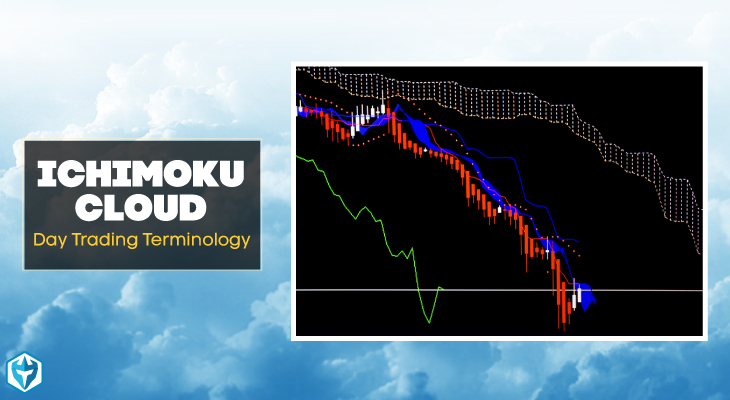
For day trading with the Ichimoku Cloud, use the following settings:
1. Tenkan-sen (Conversion Line): 9 periods
2. Kijun-sen (Base Line): 26 periods
3. Senkou Span A: (Tenkan-sen + Kijun-sen) / 2, shifted forward 26 periods
4. Senkou Span B: 52 periods, shifted forward 26 periods
5. Chikou Span (Lagging Line): Close price, shifted back 26 periods
These settings help identify trends and potential reversal points effectively in short time frames. Adjust as necessary based on the asset and market conditions.
How do I customize my trading indicators for different markets?
To customize your trading indicators for different markets, start by understanding the market's volatility and trading volume. Adjust the parameters of your indicators based on these factors. For example, in a highly volatile market, use shorter time frames and sensitive settings for indicators like the Moving Average or RSI to capture quick price movements. In contrast, for stable markets, longer time frames may be more effective.
Next, tailor your indicators to specific strategies. If you're day trading, consider using scalping indicators like the Stochastic Oscillator with tighter settings. For trend-following, adjust your Moving Averages to reflect the market's pace.
Finally, backtest your custom settings on historical data to ensure they perform well in the current market conditions. Regularly review and tweak them as market dynamics change.
Learn about How to Customize Day Trading Indicators
What timeframe is best for day trading indicators?

For day trading, the best timeframe for indicators is typically between 1 minute to 15 minutes. Many traders use the 5-minute and 15-minute charts as they provide a balance between detail and trend visibility. Consider also using daily charts for overall trend context. Adjust your indicators like moving averages and RSI according to your chosen timeframe for optimal results.
How can I backtest my indicator settings for day trading?
To backtest your indicator settings for day trading, follow these steps:
1. Choose a Trading Platform: Use platforms like TradingView, MetaTrader, or NinjaTrader that offer backtesting features.
2. Select Historical Data: Gather historical price data for the assets you plan to trade. Ensure it covers various market conditions.
3. Implement Your Indicator: Apply your indicators, such as moving averages or RSI, to the historical data.
4. Set Parameters: Adjust your indicator settings (like period lengths) based on your strategy.
5. Run the Backtest: Execute the backtest to see how your indicators would have performed over the selected historical period.
6. Analyze Results: Review metrics like win rate, average profit/loss, and drawdowns to gauge effectiveness.
7. Refine Settings: Adjust your indicators based on the results, and backtest again to optimize performance.
Repeat this process until you're satisfied with your indicator settings for day trading.
What common mistakes should I avoid with day trading indicators?
Avoid these common mistakes with day trading indicators:
1. Overcomplicating Your Setup: Stick to a few key indicators. Too many can lead to confusion and conflicting signals.
2. Ignoring Timeframes: Ensure your indicators match the timeframe you’re trading. Using daily indicators for a 5-minute chart can result in poor decisions.
3. Neglecting Market Conditions: Indicators can behave differently in trending versus ranging markets. Adapt your strategy accordingly.
4. Failing to Backtest: Before using indicators in live trades, backtest them on historical data to see how they perform.
5. Disregarding Risk Management: Relying solely on indicators without proper risk management can lead to significant losses. Always set stop-loss levels.
6. Chasing Indicators: Don’t switch indicators frequently based on short-term results. Stick to a proven set to build consistency.
7. Ignoring Confirmation: Always look for confirmation from multiple indicators before making a trade decision to increase your chances of success.
By avoiding these pitfalls, you can enhance your day trading strategy and make more informed decisions.
Learn about Common Mistakes in Day Trading Analysis to Avoid
How do I combine multiple indicators for day trading success?
To combine multiple indicators for day trading success, start by selecting a mix of trend, momentum, and volume indicators. For trend, use a moving average (e.g., 20-day SMA) to identify the market direction. Pair it with a momentum indicator like the Relative Strength Index (RSI) set to 14 periods to spot overbought or oversold conditions. Add a volume indicator, such as the On-Balance Volume (OBV), to confirm price movements.
Set your indicators to align on the same timeframe, typically 5 or 15 minutes for day trading. Look for confluence: when the RSI indicates overbought conditions while the price is near a resistance level identified by the moving average, consider selling. Conversely, if the price hits a support level with low RSI, look for buying opportunities.
Backtest your combination and adjust settings based on historical performance. Keep it simple; too many indicators can lead to confusion. Focus on those that complement each other and fit your trading style.
Learn about How to Combine Charting with Day Trading Strategies
Conclusion about Essential Indicator Settings for Day Trading
In summary, selecting the right indicator settings is crucial for effective day trading. By understanding the nuances of each indicator, such as moving averages, Bollinger Bands, and RSI, traders can enhance their decision-making processes. Customizing these settings based on market conditions and backtesting their effectiveness will lead to improved trading strategies. Remember, the right combination of indicators can significantly impact your success in the market, so leverage the expertise and insights provided by DayTradingBusiness to refine your approach.