Did you know that the average day trader spends more time analyzing charts than a chef does deciding which herbs to use? In this comprehensive guide to day trading with technical indicators, we explore essential tools that can elevate your trading game. Discover the best technical indicators, including moving averages, RSI, MACD, and Bollinger Bands, and learn how to interpret candlestick patterns and volume analysis. We’ll discuss the importance of support and resistance levels, the differences between lagging and leading indicators, and how to identify trends effectively. Plus, we’ll cover the advantages of using multiple indicators, setting stop-loss orders, common pitfalls to avoid, and how to combine indicators for optimal results. Finally, we’ll provide resources for further learning and tips on backtesting your trading strategies. Join us at DayTradingBusiness for a deep dive into mastering technical indicators for successful day trading!
What are the best technical indicators for day trading?
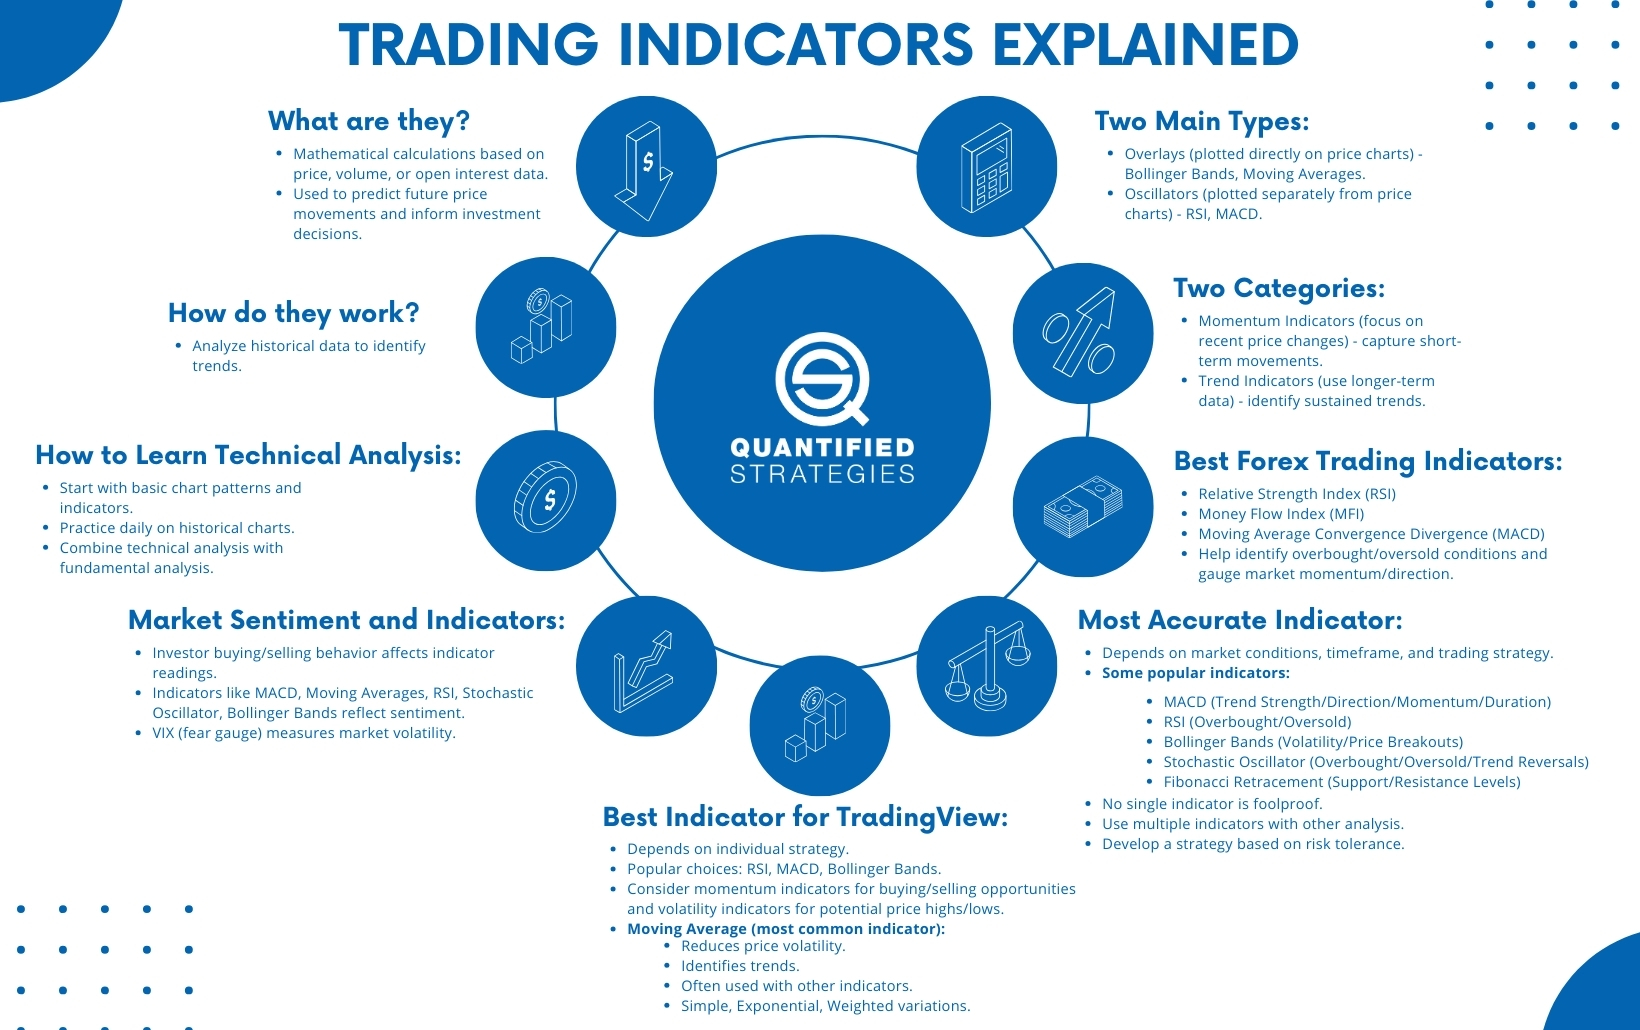
The best technical indicators for day trading include:
1. Moving Averages (MA): Helps identify trends. Use the 50-day and 200-day moving averages for support and resistance levels.
2. Relative Strength Index (RSI): Measures momentum. An RSI above 70 indicates overbought conditions, while below 30 signals oversold.
3. MACD (Moving Average Convergence Divergence): Shows trend direction and potential reversals. Look for crossovers for entry and exit points.
4. Bollinger Bands: Indicate volatility. Prices touching the upper band suggest overbought, while touching the lower band indicates oversold.
5. Stochastic Oscillator: Compares a security's closing price to its price range over a specific period. Values above 80 are overbought; below 20 are oversold.
6. Volume: Confirms trends. Increasing volume during a price move suggests strength.
Combine these indicators to enhance your day trading strategy and improve decision-making.
How do moving averages help in day trading?
Moving averages help in day trading by smoothing out price data to identify trends and potential reversal points. They can signal buy or sell opportunities when shorter-term moving averages cross above or below longer-term ones. Traders use moving averages to set entry and exit points, gauge momentum, and filter out market noise, allowing for clearer decision-making in volatile conditions.
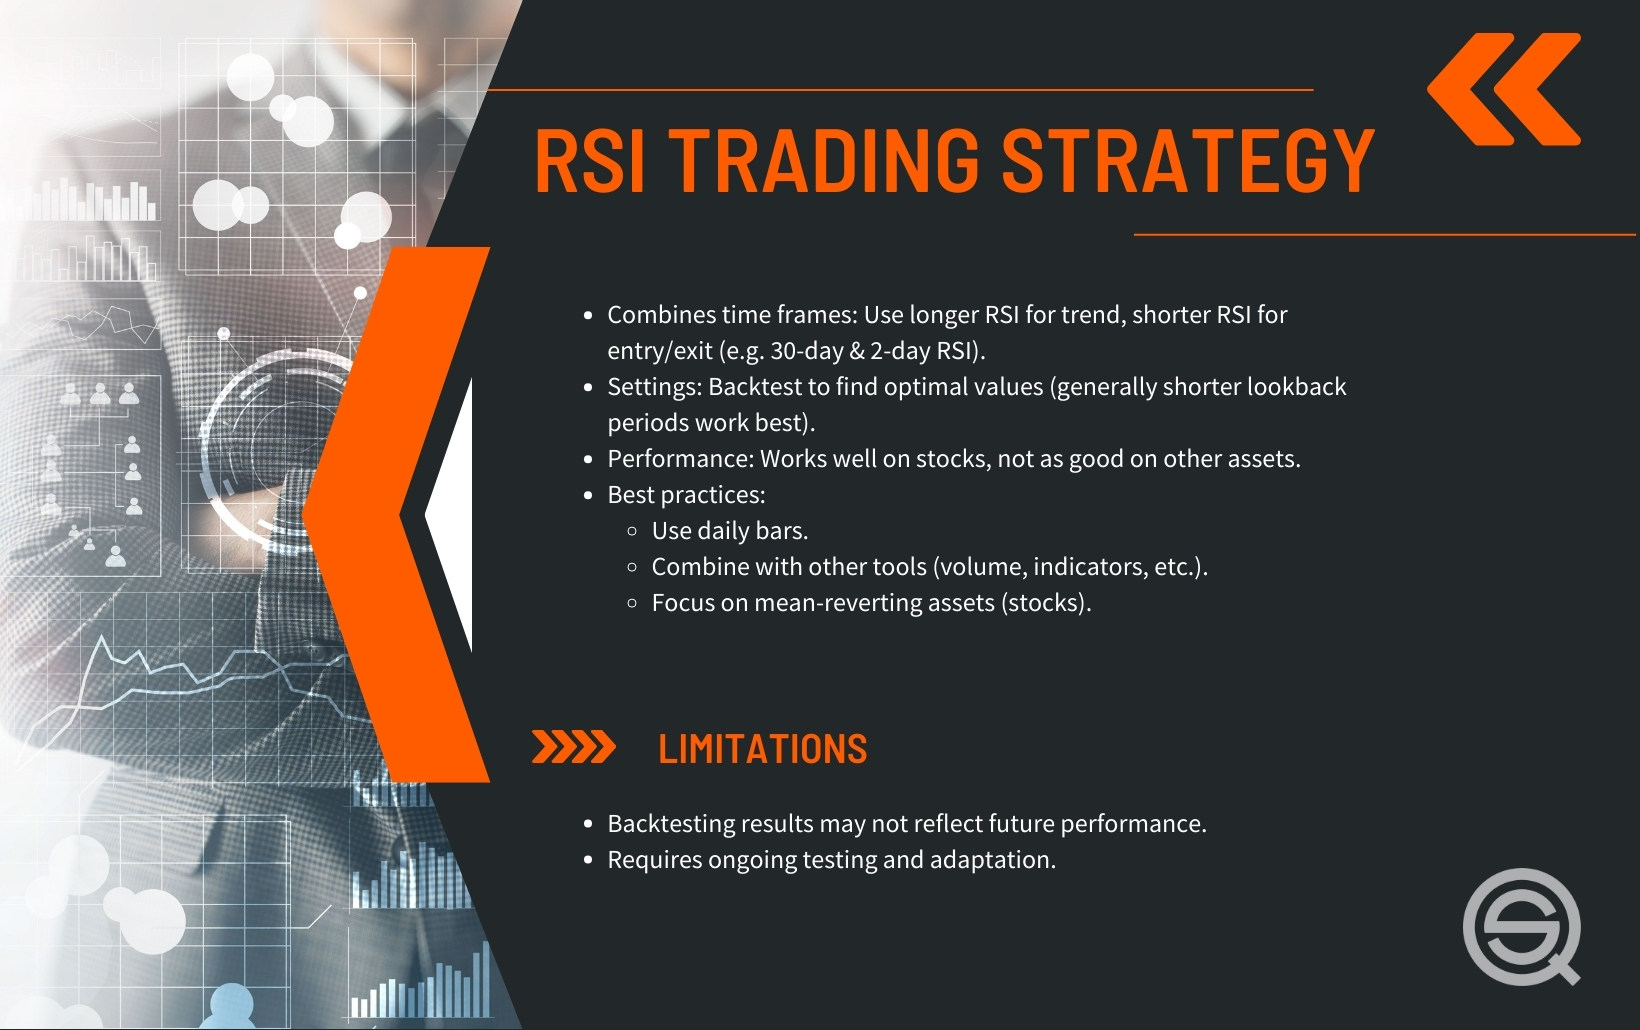
What is the significance of RSI in day trading strategies?
RSI, or Relative Strength Index, is significant in day trading strategies as it helps traders identify overbought or oversold conditions in a stock. An RSI above 70 indicates potential overbought conditions, signaling a possible sell, while an RSI below 30 suggests oversold conditions, indicating a potential buy. This momentum oscillator aids traders in making informed decisions about entry and exit points, enhancing the effectiveness of their trading strategies. By incorporating RSI, day traders can better anticipate price reversals and improve their risk management.
How can MACD be used for day trading decisions?
MACD can be used for day trading by identifying potential buy and sell signals. Look for MACD line crossovers above or below the signal line; a crossover above indicates a buy signal, while below suggests a sell signal. Additionally, pay attention to MACD divergence from price trends; if prices rise but MACD falls, it may signal a reversal. Use MACD in conjunction with other indicators like moving averages for confirmation. Keep your time frame short, focusing on 5-minute or 15-minute charts for quick trades.
What role do Bollinger Bands play in day trading?
Bollinger Bands help day traders identify volatility and potential price reversals. The bands consist of a moving average and two standard deviation lines, indicating overbought or oversold conditions. When prices touch the upper band, it may signal a sell opportunity; touching the lower band can indicate a buy opportunity. Traders often use the squeeze, when bands contract, to anticipate significant price movements. This tool enhances entry and exit strategies in day trading.
How to interpret candlestick patterns for day trading?
To interpret candlestick patterns for day trading, focus on the following key patterns:
1. Doji: Indicates indecision. Watch for follow-up candles to gauge market direction.
2. Hammer: Suggests a potential reversal after a downtrend. Look for confirmation with a bullish candle.
3. Shooting Star: Signals a potential reversal after an uptrend. Confirm with a bearish follow-up.
4. Engulfing Patterns: A bullish engulfing indicates strong buying pressure; a bearish engulfing suggests strong selling. Look for these patterns at support or resistance levels.
5. Morning Star & Evening Star: These are three-candle patterns indicating reversals; morning star is bullish, evening star is bearish.
Always combine candlestick patterns with other indicators like volume or moving averages for better accuracy in your day trading strategy.
What is the importance of volume in day trading analysis?
Volume is crucial in day trading analysis because it indicates the strength of a price movement. High volume often confirms trends, signaling that many traders support the price change. Conversely, low volume can suggest weak momentum, making a price move less reliable. Traders use volume to identify entry and exit points, ensuring they're trading with or against the market's strength. Additionally, volume patterns can help spot potential reversals, enhancing decision-making. Overall, incorporating volume into technical analysis provides clarity, boosting the chances of successful trades.
How can traders use support and resistance levels?
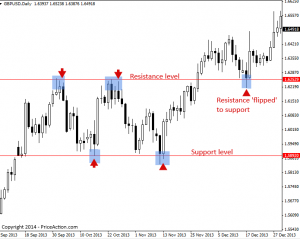
Traders use support and resistance levels to identify entry and exit points in day trading. Support levels indicate where a price tends to stop falling, suggesting a potential buy opportunity. Resistance levels show where prices often stop rising, signaling a potential sell opportunity.
When prices approach support, traders may buy, expecting a bounce. Conversely, when prices reach resistance, they might sell or short, anticipating a drop. Breakouts above resistance or below support can indicate strong momentum, prompting traders to enter trades in the direction of the breakout.
Using these levels along with technical indicators like moving averages can enhance decision-making and improve trading strategies.
What are the key differences between lagging and leading indicators?
Lagging indicators reflect past price movements and trends, helping confirm what has already happened. Examples include moving averages and the Relative Strength Index (RSI). Leading indicators, on the other hand, predict future price movements, allowing traders to anticipate market shifts. Examples include the Stochastic Oscillator and Fibonacci retracement levels. In short, lagging indicators confirm trends, while leading indicators signal potential reversals or continuations.
How can traders identify trends using technical indicators?
Traders can identify trends using technical indicators by following these methods:
1. Moving Averages: Use simple moving averages (SMA) or exponential moving averages (EMA) to smooth price data and identify the direction of the trend. A rising moving average indicates an uptrend, while a falling one indicates a downtrend.
2. Relative Strength Index (RSI): This momentum oscillator measures the speed and change of price movements. An RSI above 70 suggests overbought conditions (potential trend reversal), while below 30 indicates oversold conditions.
3. MACD (Moving Average Convergence Divergence): The MACD line crossing above the signal line suggests a bullish trend, while crossing below indicates a bearish trend.
4. Trend Lines: Draw trend lines on price charts to visualize support and resistance levels. An upward trend is confirmed when price consistently bounces off an ascending trend line.
5. Bollinger Bands: These bands expand and contract based on market volatility. Prices touching the upper band suggest overbought conditions (potential trend reversal), while prices at the lower band indicate oversold conditions.
Use these indicators together for stronger trend confirmation.
What are the advantages of using multiple indicators in day trading?
Using multiple indicators in day trading offers several advantages:
1. Confirmation: Different indicators can confirm each other, reducing the risk of false signals. For example, if both a moving average and an RSI indicate a buy, it strengthens your decision.
2. Comprehensive Analysis: Multiple indicators provide a well-rounded view of market conditions, covering trends, momentum, and volatility. This helps in making informed trades.
3. Flexibility: Combining indicators allows traders to adapt to different market environments. For instance, some indicators work better in trending markets, while others excel in sideways markets.
4. Risk Management: By using various indicators, traders can better assess potential entry and exit points, leading to improved risk management strategies.
5. Enhanced Strategy Development: Multiple indicators can help refine trading strategies, allowing for backtesting and optimization based on different market scenarios.
Incorporating a mix of indicators can significantly improve trading outcomes by providing deeper insights and reducing uncertainty.
How do you set stop-loss orders with technical indicators?
To set stop-loss orders using technical indicators, first identify key support and resistance levels on your chart. Use indicators like the Average True Range (ATR) to determine volatility; set your stop-loss a multiple of the ATR below your entry point. Alternatively, use moving averages: if the price crosses below a significant moving average, place your stop-loss just below it. For trend-following strategies, consider placing the stop-loss below a recent swing low. Always adjust your stop-loss as the trade moves in your favor to protect profits.
Learn about How to set effective stop-loss orders to limit risk
What mistakes should day traders avoid with indicators?
Day traders should avoid relying solely on indicators without considering market context. They often misinterpret signals due to lagging indicators, leading to poor entry and exit points. Ignoring multiple time frames can result in missed opportunities or false trends. Overtrading based on indicator noise can drain accounts quickly. Lastly, neglecting proper risk management and position sizing can lead to devastating losses. Focus on using indicators as a tool, not a crutch.
How to combine indicators for better day trading results?
To combine indicators for better day trading results, start with a mix of trend indicators like moving averages and momentum indicators such as the RSI. Use moving averages to identify the trend direction, then confirm entry points with the RSI indicating overbought or oversold conditions. Add volume indicators to validate price movements; for example, a breakout accompanied by high volume is more reliable. Finally, consider incorporating a volatility indicator like the Bollinger Bands to assess potential price swings. This combination helps you make informed trading decisions and manage risk effectively.
Learn about How to Combine Charting with Day Trading Strategies
What resources are available for learning about technical indicators?
For learning about technical indicators in day trading, consider these resources:
1. Books: "Technical Analysis of the Financial Markets" by John Murphy and "A Beginner's Guide to Forex Trading" by Matthew Driver provide solid foundational knowledge.
2. Online Courses: Websites like Udemy, Coursera, and Investopedia offer courses focused on technical indicators and their applications in trading.
3. YouTube Channels: Channels like Rayner Teo and Trading 212 explain various indicators and trading strategies clearly and visually.
4. Webinars: Many brokerage firms host free webinars that cover technical indicators and day trading tactics.
5. Trading Platforms: Tools like TradingView and MetaTrader offer tutorials and community forums to learn about indicators in action.
6. Forums and Communities: Engage in communities like Reddit’s r/Daytrading or Elite Trader to share insights and ask questions about technical indicators.
Explore these resources to deepen your understanding of technical indicators in day trading.
How can I backtest my trading strategy with indicators?
To backtest your trading strategy with indicators, follow these steps:
1. Select Your Indicators: Choose relevant technical indicators, like moving averages or RSI, based on your strategy.
2. Gather Historical Data: Obtain historical price data for the asset you're trading. This data should include open, high, low, close, and volume.
3. Set Up Your Trading Platform: Use trading software or platforms that allow backtesting, such as MetaTrader or TradingView.
4. Define Your Strategy: Clearly your entry and exit rules based on your indicators. Specify conditions for buying and selling.
5. Run the Backtest: Input your strategy into the trading platform and run the backtest over your selected historical data period.
6. Analyze Results: Review metrics like win rate, profit factor, and drawdown. Adjust your strategy as needed based on performance.
7. Refine and Retest: Make improvements and retest multiple times to ensure consistency and reliability in various market conditions.
This process helps you validate your trading strategy's effectiveness before risking real capital.
Conclusion about Day Trading with Technical Indicators: A Guide
In conclusion, mastering technical indicators is crucial for successful day trading. By understanding tools like moving averages, RSI, MACD, and Bollinger Bands, traders can make informed decisions and enhance their strategies. Utilizing support and resistance levels, recognizing trends, and avoiding common pitfalls are key to optimizing performance. For those looking to deepen their knowledge and skills, DayTradingBusiness offers valuable resources and insights to help navigate the complexities of technical analysis.
Learn about Day Trading Futures: A Guide to Technical Analysis