Did you know that even the most seasoned traders sometimes rely on indicators as much as a GPS while navigating rush hour traffic? Understanding day trading indicators is crucial for maximizing your trading potential. This article dives deep into various types of indicators, from moving averages and the Relative Strength Index (RSI) to Bollinger Bands and volume indicators. You'll learn how candlestick patterns, the MACD, and Fibonacci retracement levels can enhance your strategies. We also discuss the distinction between lagging and leading indicators, the importance of support and resistance levels, and how news can impact your trading decisions. Plus, we share tips for beginners and common pitfalls to avoid. With insights from DayTradingBusiness, you'll discover how backtesting can refine your approach to using these powerful tools effectively.
What are day trading indicators and why are they important?
Day trading indicators are tools that help traders analyze price movements and market trends. They include moving averages, Relative Strength Index (RSI), and Bollinger Bands, among others. These indicators are important because they provide insights into market momentum, potential entry and exit points, and help manage risk. By using day trading indicators, traders can make informed decisions, improve their timing, and increase their chances of profitability.
How do moving averages act as day trading indicators?
Moving averages act as day trading indicators by smoothing price data to identify trends and potential reversals. Traders use short-term moving averages, like the 5 or 10-day, to spot quick changes in price direction, while longer-term averages, such as the 50-day, help confirm overall trends. Crossovers, where a short-term moving average crosses above or below a long-term average, signal buy or sell opportunities. Additionally, moving averages can serve as dynamic support and resistance levels, helping traders make informed decisions in volatile markets.
What role does the Relative Strength Index (RSI) play in day trading?
The Relative Strength Index (RSI) helps day traders identify overbought or oversold conditions in a stock. When the RSI is above 70, it signals that a stock may be overbought, suggesting a potential price drop. Conversely, an RSI below 30 indicates that a stock might be oversold, hinting at a possible price increase. Traders use these signals to make timely buy or sell decisions, aiming to capitalize on short-term price movements. Additionally, RSI divergence can indicate potential trend reversals, adding another layer to trading strategies.
How can Bollinger Bands enhance day trading strategies?
Bollinger Bands enhance day trading strategies by providing clear visual indicators of market volatility and price levels. When prices touch the upper band, it often signals overbought conditions, suggesting a potential sell opportunity. Conversely, when prices hit the lower band, it indicates oversold conditions, signaling a potential buy. Traders can use the width of the bands to gauge volatility; wider bands indicate higher volatility, while narrower bands suggest lower volatility. This information helps traders make informed decisions, set stop-loss orders, and identify breakout opportunities. Integrating Bollinger Bands with other indicators, like moving averages, can further refine entry and exit points.
What are the benefits of using volume indicators in day trading?
Volume indicators in day trading help identify market strength, confirm trends, and signal potential reversals. They show how much of an asset is being traded, indicating whether a price movement is supported by significant interest. High volume during price increases can confirm a bullish trend, while high volume during declines may signal a bearish trend. Additionally, volume indicators can help traders spot breakouts or breakdowns, enhancing entry and exit strategies. Overall, they provide crucial insights that can lead to more informed trading decisions.
How do candlestick patterns serve as effective day trading indicators?
Candlestick patterns are effective day trading indicators because they visually represent market sentiment and price action in a concise format. Traders use these patterns to identify potential reversals or continuations in trends. For instance, a bullish engulfing pattern suggests a reversal to the upside, while a bearish engulfing indicates a potential downturn. They help traders make quick decisions based on real-time data, enhancing their ability to enter or exit trades profitably. By analyzing these patterns along with volume, traders can gauge the strength of a price movement, improving their overall trading strategy.
What is the significance of the MACD indicator in day trading?
The MACD (Moving Average Convergence Divergence) indicator is significant in day trading because it helps identify potential buy and sell signals based on momentum and trend direction. It consists of two moving averages and a histogram that shows the relationship between them. Traders use MACD to spot divergences, which can indicate potential reversals, and to confirm trends when the MACD line crosses above or below the signal line. This makes it a valuable tool for making quick, informed trading decisions.
How do traders use Fibonacci retracement levels in day trading?
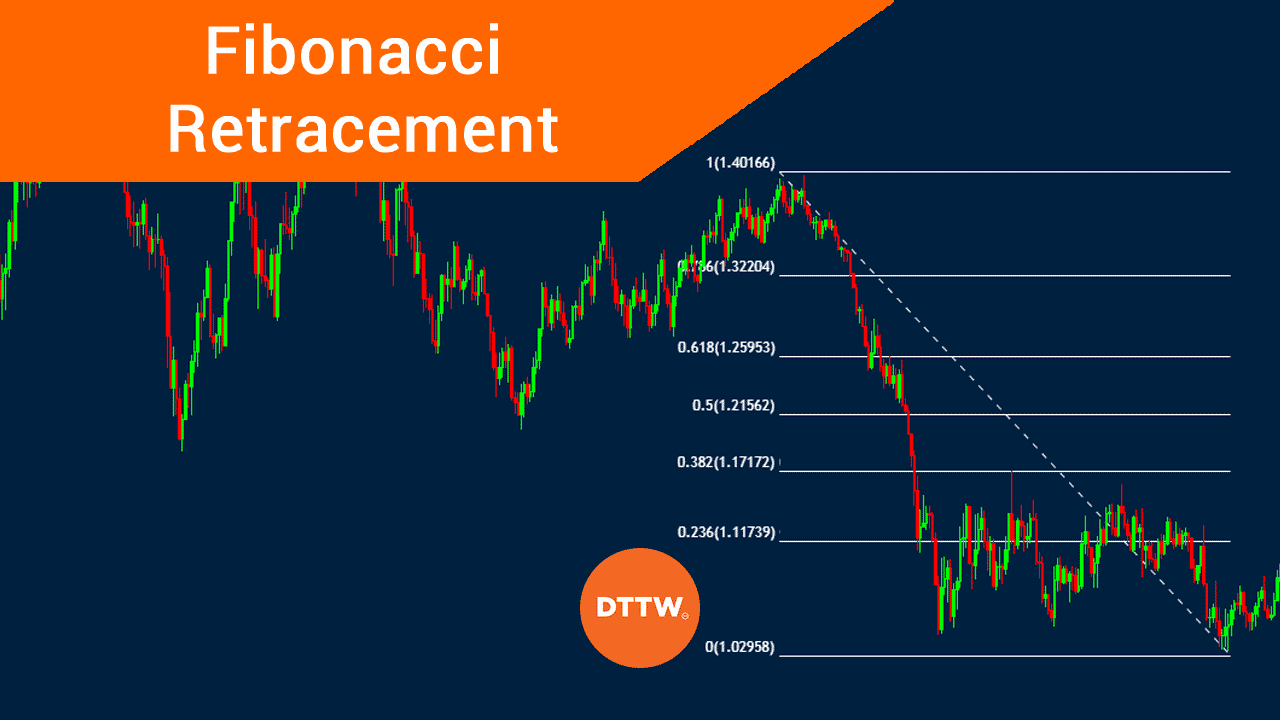
Traders use Fibonacci retracement levels in day trading to identify potential reversal points in price movements. They plot key Fibonacci levels (23.6%, 38.2%, 50%, 61.8%, and 76.4%) on a chart after a significant price move. When the price retraces to these levels, traders look for confirmation signals, like candlestick patterns or volume spikes, to enter trades. For instance, if the price bounces off the 61.8% level, it may signal a continuation of the trend. This strategy helps traders set target prices and stop-loss orders effectively, enhancing their decision-making process.
What are the best day trading indicators for beginners?
The best day trading indicators for beginners include:
1. Moving Averages: Simple and Exponential Moving Averages help identify trends and potential reversal points.
2. Relative Strength Index (RSI): Measures momentum and identifies overbought or oversold conditions.
3. Bollinger Bands: Show price volatility and potential breakouts or reversals.
4. MACD (Moving Average Convergence Divergence): Highlights momentum changes and trend direction.
5. Volume: Indicates the strength of a price move; higher volume can confirm trends.
These indicators help beginners make informed trading decisions and manage risk effectively.
How can you combine multiple indicators for day trading success?
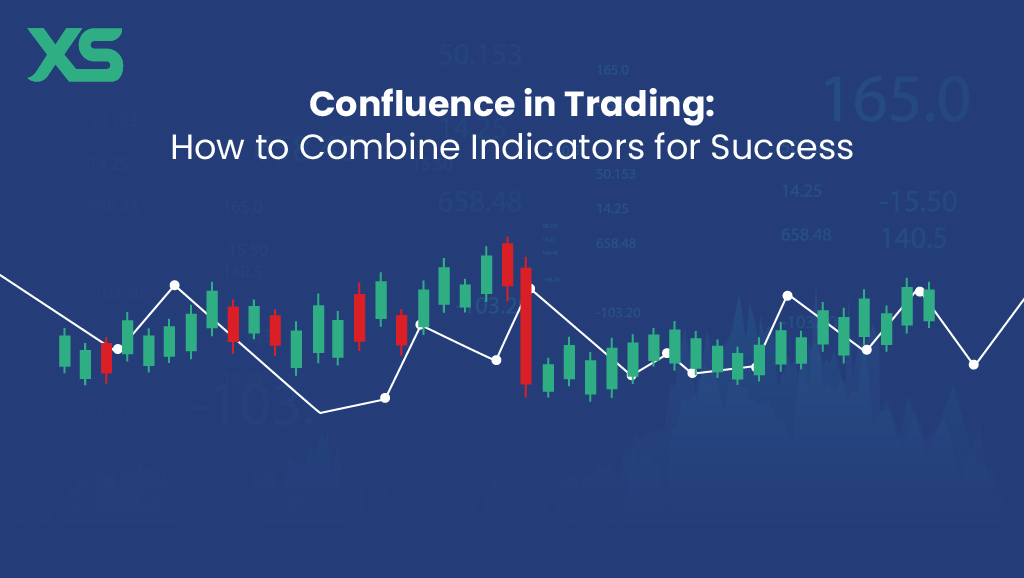
To combine multiple indicators for day trading success, start with a mix of trend-following and momentum indicators. For example, use moving averages to identify the trend direction and the Relative Strength Index (RSI) to gauge overbought or oversold conditions.
Look for confluence: if a moving average crossover aligns with an RSI signal, it strengthens your trading decision. Additionally, incorporate volume indicators to confirm price movements.
Set specific criteria, like entering a trade when the price is above the moving average and the RSI is below 30. This approach enhances accuracy and reduces false signals. Always backtest your strategy to ensure its effectiveness in real market conditions.
Learn about How to Combine Charting with Day Trading Strategies
What are lagging vs. leading indicators in day trading?
Lagging indicators are metrics that reflect past price movements, such as moving averages or the Relative Strength Index (RSI). They help confirm trends but react slowly to market changes. Leading indicators, like the Moving Average Convergence Divergence (MACD) or momentum indicators, predict future price movements and signal potential reversals. In day trading, using both types can enhance decision-making and timing.
Learn about Understanding Lagging vs. Leading Indicators in Day Trading
How do support and resistance levels function as day trading indicators?
Support and resistance levels are crucial day trading indicators as they help traders identify potential entry and exit points. Support levels indicate where a stock might stop falling and potentially bounce back up, while resistance levels show where the price may struggle to rise further. Traders use these levels to set buy orders near support and sell orders near resistance, aiming to capitalize on price reversals. Additionally, if a price breaks through a support or resistance level, it can signal a trend continuation, prompting traders to adjust their strategies accordingly. Understanding these levels enhances decision-making and risk management in day trading.
Learn about Identifying Support and Resistance Levels in Day Trading
What is the impact of news indicators on day trading decisions?
News indicators significantly impact day trading decisions by providing real-time information that can influence market volatility and stock prices. Traders use news indicators, such as earnings reports, economic data releases, and geopolitical events, to identify potential price movements. Positive news can lead to quick upward trends, while negative news often triggers sell-offs.
Day traders monitor these indicators closely to make informed buy or sell decisions, aiming to capitalize on short-term fluctuations. For example, a better-than-expected earnings report may prompt a trader to buy shares, anticipating a rise, while disappointing economic data could lead to a rapid sell-off. Overall, staying updated on news indicators is crucial for making timely and strategic trading choices.
Learn about How Do Fear and Greed Impact Day Trading Decisions?
How do you choose the right indicators for your day trading strategy?
Choose the right indicators for your day trading strategy by considering the following:
1. Market Conditions: Match indicators to current market trends—use momentum indicators in trending markets and oscillators in sideways markets.
2. Time Frame: Select indicators suitable for your trading time frame. Shorter time frames benefit from faster indicators like moving averages, while longer frames can use trend-following indicators.
3. Simplicity: Stick to a few key indicators to avoid analysis paralysis. Common choices include the Relative Strength Index (RSI), Moving Average Convergence Divergence (MACD), and Bollinger Bands.
4. Personal Preference: Use indicators that resonate with your trading style. Test a few and see which ones you’re comfortable interpreting.
5. Backtesting: Validate your indicators by backtesting them on historical data to ensure they provide reliable signals.
Focus on these aspects to effectively tailor your day trading strategy.
Learn about How to Choose the Right Indicators for Day Trading
What are the common mistakes to avoid with day trading indicators?
Common mistakes to avoid with day trading indicators include:
1. Over-reliance on a single indicator: Use multiple indicators for confirmation to avoid false signals.
2. Ignoring market context: Consider broader market trends and news, not just indicator readings.
3. Failing to backtest: Test indicators on historical data to ensure they work for your strategy.
4. Neglecting risk management: Always set stop-loss orders, regardless of indicator signals.
5. Chasing indicators after losses: Stick to your plan; don’t let emotions drive decisions.
6. Misinterpreting signals: Understand what each indicator really represents to make informed trades.
Learn about Common Mistakes in Day Trading Analysis to Avoid
How can backtesting improve your use of day trading indicators?
Backtesting helps you evaluate the effectiveness of day trading indicators by testing them against historical data. This process reveals how well indicators would have performed in past market conditions, allowing you to fine-tune strategies before risking real capital. By identifying patterns and optimizing parameters, backtesting increases your confidence in using indicators, ultimately enhancing your decision-making in day trading.
Learn about How to Use Backtesting to Improve Your Day Trading Performance
Conclusion about Day Trading Indicators: Why They Matter
Incorporating effective day trading indicators is crucial for making informed trading decisions and enhancing strategy performance. Understanding tools like moving averages, RSI, and Bollinger Bands can provide valuable insights into market trends and potential entry or exit points. By combining various indicators and avoiding common pitfalls, traders can improve their chances of success. For deeper insights and guidance on day trading, consider the resources available at DayTradingBusiness.