Did you know that 90% of day traders lose money, often because they fail to use the right indicators? In the fast-paced world of day trading, understanding market trends is crucial for success. This article dives into the best day trading indicators that can help predict market movements, including moving averages, RSI, MACD, and volume indicators. We'll explore the significance of Bollinger Bands, Fibonacci retracement levels, and candlestick patterns, as well as the importance of support and resistance levels. Learn how to effectively combine leading and lagging indicators, avoid common pitfalls, and leverage economic indicators to enhance your strategies. Additionally, discover tools for optimizing your analysis and the benefits of backtesting to refine your approach. With insights from DayTradingBusiness, you'll be better equipped to navigate the complexities of day trading.
What are the best day trading indicators for market trends?
The best day trading indicators for market trends include:
1. Moving Averages (MA): Simple and exponential moving averages help identify the direction of the trend.
2. Relative Strength Index (RSI): This momentum oscillator indicates overbought or oversold conditions, signaling potential reversals.
3. MACD (Moving Average Convergence Divergence): This trend-following momentum indicator shows the relationship between two moving averages, helping to spot buy and sell signals.
4. Bollinger Bands: These bands adjust to market volatility and can indicate potential price breakouts or reversals.
5. Volume: Analyzing volume trends can confirm the strength of a price movement.
6. Average True Range (ATR): This measures market volatility, helping to set stop-loss levels and gauge potential price movements.
Use a combination of these indicators for a more accurate analysis of market trends in day trading.
How do moving averages help in day trading?
Moving averages help in day trading by smoothing price data to identify trends and potential entry or exit points. They provide a clear visual representation of the market's direction. Traders often use the crossover strategy, where a short-term moving average crosses above a long-term moving average to signal a buy, and vice versa for a sell. This helps to minimize noise from price fluctuations, allowing for more informed decisions based on established trends. Additionally, moving averages can act as dynamic support and resistance levels, guiding traders on where to set stop-loss orders or take profits.
What role do RSI and MACD play in predicting market movements?
RSI (Relative Strength Index) and MACD (Moving Average Convergence Divergence) are key indicators in day trading that help predict market movements.
RSI measures the speed and change of price movements, indicating whether a stock is overbought or oversold. A reading above 70 suggests overbought conditions, while below 30 indicates oversold conditions, guiding traders on potential reversal points.
MACD tracks momentum by showing the relationship between two moving averages. When the MACD line crosses above the signal line, it signals a potential upward trend; when it crosses below, it suggests a downward trend.
Using these indicators together can enhance decision-making in day trading by identifying entry and exit points based on market trends.
How can volume indicators enhance day trading strategies?
Volume indicators enhance day trading strategies by providing insights into market strength and potential price movements. High volume often confirms price trends, signaling whether a move will likely continue or reverse. Indicators like On-Balance Volume (OBV) and Volume Moving Average help traders identify bullish or bearish sentiment. By analyzing volume spikes, traders can spot entry and exit points more effectively, improving their chances of profitable trades. Overall, incorporating volume indicators helps day traders make informed decisions based on market activity.
What is the significance of Bollinger Bands in day trading?
Bollinger Bands are significant in day trading because they help traders identify volatility and potential price reversals. The bands consist of a middle line representing the moving average and two outer bands that indicate standard deviations from this average. When the price approaches the upper band, it may signal overbought conditions, while touching the lower band can indicate oversold conditions. This can guide traders in making entry and exit decisions. Additionally, the narrowing of the bands often precedes strong price movements, highlighting potential breakout opportunities.
How do traders use Fibonacci retracement levels?
Traders use Fibonacci retracement levels to identify potential reversal points in the market. They draw horizontal lines at key Fibonacci levels—typically 23.6%, 38.2%, 50%, 61.8%, and 100%—after a significant price movement. When the price retraces to these levels, traders look for signals like candlestick patterns or volume spikes to enter trades. This helps them capitalize on price corrections before the trend resumes, making it a valuable tool for day trading.
What are the key benefits of using candlestick patterns?
Candlestick patterns provide clear visual cues about market sentiment, helping traders identify potential reversals or continuations. They enhance decision-making by illustrating price action and volume dynamics, making it easier to spot trends. Patterns like dojis and hammers signal indecision or reversals, while engulfing patterns indicate strong momentum shifts. Using candlestick patterns alongside other indicators can improve trade timing and risk management, ultimately increasing profitability in day trading.
How can trend lines assist in market trend predictions?
Trend lines assist in market trend predictions by visually representing price movements and identifying support and resistance levels. They help traders spot the direction of the market—upward, downward, or sideways—allowing for informed decisions. By connecting significant price points, trend lines reveal patterns that indicate potential future price movements. This makes them crucial for day trading, as they enhance the accuracy of entry and exit points.
What is the importance of support and resistance levels?
Support and resistance levels are crucial in day trading as they indicate where prices are likely to reverse or consolidate. Support levels are price points where buying interest is strong enough to overcome selling pressure, while resistance levels are where selling pressure can thwart upward movement. Traders use these levels to identify entry and exit points, manage risk, and set stop-loss orders. Recognizing these levels helps traders predict market trends and make more informed decisions, increasing the chances of successful trades.
How do chart patterns aid in day trading decisions?
Chart patterns help day traders identify potential price movements and market trends. Patterns like flags, triangles, and head-and-shoulders indicate bullish or bearish trends, guiding entry and exit points. Recognizing these formations can enhance decision-making by signaling when to buy or sell based on historical price behavior. Additionally, patterns provide context for setting stop-loss orders and profit targets, making risk management more effective.
Learn about How to Use Chart Patterns for Day Trading Analysis
What indicators are considered leading vs. lagging for day traders?
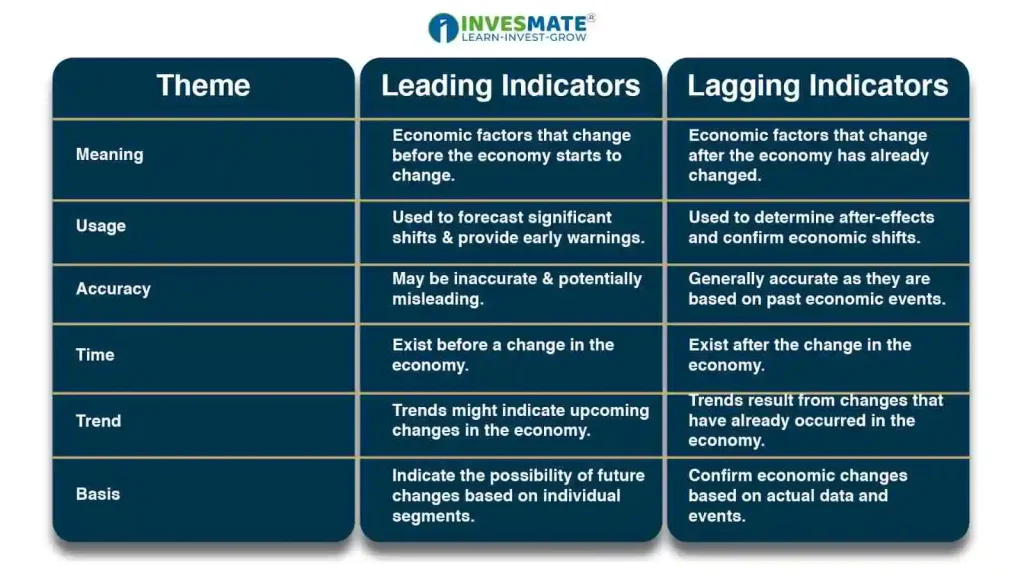
Leading indicators for day traders include the Relative Strength Index (RSI), Moving Average Convergence Divergence (MACD), and stochastic oscillators. These tools help predict future price movements based on momentum and trend strength.
Lagging indicators include moving averages, Bollinger Bands, and the Average True Range (ATR). These indicators confirm trends after they occur, providing signals based on past price movements.
Learn about Understanding Lagging vs. Leading Indicators in Day Trading
How can traders effectively combine multiple indicators?
Traders can effectively combine multiple indicators by using a strategy that aligns their strengths. Start with a trend indicator, like moving averages, to identify the market direction. Then, add momentum indicators, such as the Relative Strength Index (RSI), to gauge the strength of that trend.
Use volume indicators to confirm the trend's strength—rising volume often supports a price move. Finally, incorporate a volatility indicator, like Bollinger Bands, to identify potential reversal points.
Make sure the indicators complement each other without redundancy. Test your combination in a demo account to refine your approach before applying it in live trades.
What are the common mistakes to avoid with trading indicators?
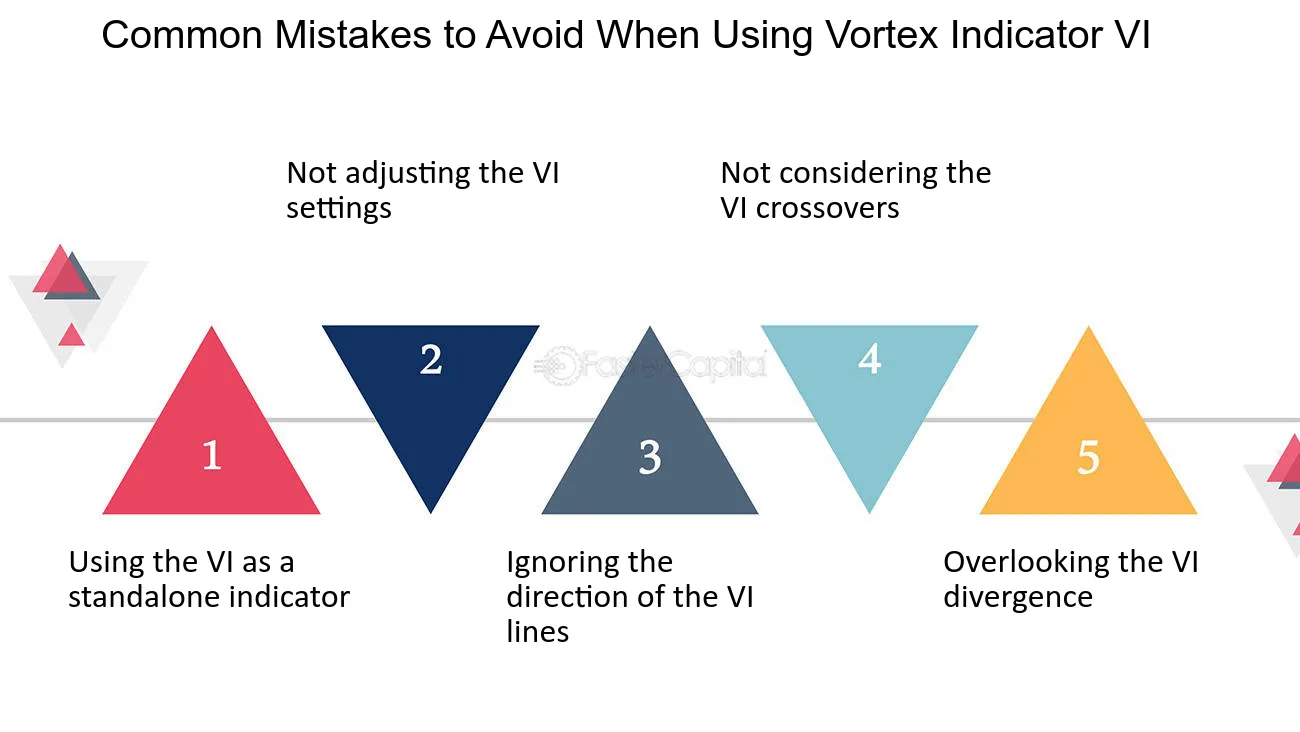
1. Over-reliance on a single indicator: Relying solely on one trading indicator can lead to poor decisions. Use a combination of indicators for better insights.
2. Ignoring market context: Always consider the broader market conditions. Indicators can give misleading signals during unusual events or high volatility.
3. Lack of backtesting: Failing to backtest indicators on historical data can result in missed opportunities or losses. Test your strategy first.
4. Not adjusting settings: Many indicators have customizable settings. Don’t stick to defaults; tweak them based on the specific market or timeframe.
5. Misinterpreting signals: Understand what signals mean. Buy/sell signals can vary based on market conditions; don’t act blindly.
6. Neglecting risk management: Indicators don’t eliminate risk. Always use stop-loss orders and position sizing to protect your capital.
7. Emotional trading: Don’t let emotions override indicator signals. Stick to your strategy, even when tempted to deviate.
Learn about Common Mistakes in Day Trading Analysis to Avoid
How do economic indicators influence day trading?
Economic indicators influence day trading by providing insights into market trends and potential price movements. Key indicators like GDP growth, unemployment rates, and inflation can impact trader sentiment and volatility. For example, strong employment data may lead to bullish momentum, prompting traders to buy, while poor economic reports can trigger sell-offs. Traders often monitor these indicators in real-time to make quick decisions, aiming to capitalize on short-term market fluctuations.
What tools and software can optimize indicator analysis?
To optimize indicator analysis for day trading, consider these tools and software:
1. TradingView: Offers advanced charting tools, customizable indicators, and social networking features for sharing insights.
2. MetaTrader 4/5: Popular for forex trading, it provides robust technical analysis tools and automated trading options.
3. ThinkorSwim: A powerful platform with extensive indicator capabilities and real-time data.
4. NinjaTrader: Great for futures and forex, featuring advanced charting, backtesting, and strategy development.
5. StockCharts: Provides a variety of technical indicators and charting options tailored for stocks and ETFs.
6. TradeStation: Offers comprehensive analysis tools, including custom indicators and strategy testing.
7. Sierra Chart: Known for its flexibility in creating and customizing indicators for various asset classes.
These tools enhance your ability to analyze indicators effectively and predict market trends.
How can backtesting improve indicator effectiveness in day trading?
Backtesting can significantly enhance the effectiveness of indicators in day trading by allowing traders to evaluate how well an indicator would have performed in past market conditions. By analyzing historical data, traders can identify patterns and optimize indicator parameters for better accuracy. This process helps in refining trading strategies, reducing the risk of losses, and increasing the likelihood of profitable trades. Ultimately, backtesting provides empirical evidence of an indicator's reliability in predicting market trends, enabling traders to make informed decisions.
Learn about How to Use Backtesting to Improve Your Day Trading Performance
Conclusion about Day Trading Indicators That Predict Market Trends
Incorporating the right day trading indicators is essential for predicting market trends effectively. Moving averages, RSI, MACD, and volume indicators provide valuable insights, while tools like Bollinger Bands and Fibonacci retracement levels enhance your strategy. Understanding candlestick patterns, trend lines, and support and resistance levels can further refine decision-making. Remember to distinguish between leading and lagging indicators and to combine them thoughtfully. Avoid common pitfalls and leverage economic indicators, along with advanced tools and backtesting, for optimal results. For comprehensive support in mastering these techniques, DayTradingBusiness is here to guide you through your trading journey.
Learn about Using Order Flow to Predict Market Trends in Day Trading