Did you know that the average day trader spends more time analyzing charts than most people do deciding what to have for lunch? In the fast-paced world of day trading, selecting the right indicators can make or break your strategy. This article dives into essential day trading indicators tailored for stocks, forex, cryptocurrencies, and futures markets. We’ll explore how moving averages, volume indicators, RSI, Bollinger Bands, and candlestick patterns can enhance your trading approach. You’ll also learn the importance of combining indicators, the distinction between lagging and leading indicators, and how news impacts trading signals. Join us at DayTradingBusiness as we unpack these critical tools for trading success!
What are the best day trading indicators for stocks?
The best day trading indicators for stocks include:
1. Moving Averages: Use the 50-day and 200-day moving averages to identify trends.
2. Relative Strength Index (RSI): Helps gauge momentum and overbought/oversold conditions.
3. Exponential Moving Average (EMA): More responsive than simple moving averages, particularly the 9 and 21-day EMAs.
4. Bollinger Bands: Show volatility and potential price reversals.
5. Volume: Confirm trends and breakouts; high volume can indicate strong moves.
6. MACD (Moving Average Convergence Divergence): Helps identify changes in momentum and trend direction.
These indicators can enhance your day trading strategy and improve decision-making.
How do I choose day trading indicators for forex?
Choose day trading indicators for forex by focusing on a few key types: trend indicators like moving averages to identify market direction, momentum indicators such as the Relative Strength Index (RSI) to gauge overbought or oversold conditions, and volatility indicators like the Average True Range (ATR) to assess market fluctuations. Test these indicators on a demo account to see which combinations work best for your trading style. Ensure they align with your strategy and risk management approach.
What indicators should I use for day trading cryptocurrencies?
For day trading cryptocurrencies, use these key indicators:
1. Moving Averages (MA): Identify trends with short-term (like 9-day) and long-term (like 50-day) MAs.
2. Relative Strength Index (RSI): Gauge overbought or oversold conditions, typically above 70 or below 30.
3. Bollinger Bands: Measure volatility; price touching the upper band may indicate overbought conditions, while the lower band suggests oversold.
4. Volume: Analyze trading volume to confirm price movements; increasing volume during a price rise supports the trend.
5. MACD (Moving Average Convergence Divergence): Spot momentum changes by looking at the MACD line crossing above or below the signal line.
6. Fibonacci Retracement Levels: Identify potential reversal levels by plotting key Fibonacci levels on price charts.
Use these indicators in combination for better accuracy in your trading strategies.
Which technical indicators are most effective for futures trading?
The most effective technical indicators for futures trading include:
1. Moving Averages (MA): Simple and exponential moving averages help identify trends and potential reversal points.
2. Relative Strength Index (RSI): This momentum oscillator indicates overbought or oversold conditions.
3. Bollinger Bands: They measure market volatility and help identify potential breakouts.
4. MACD (Moving Average Convergence Divergence): This trend-following momentum indicator shows the relationship between two moving averages.
5. Volume: Analyzing volume helps confirm trends and potential reversals.
6. Fibonacci Retracement: This tool identifies potential support and resistance levels.
Using a combination of these indicators can enhance decision-making in futures trading.
How do moving averages function as day trading indicators?
Moving averages function as day trading indicators by smoothing out price data to identify trends and potential entry or exit points. Traders use the simple moving average (SMA) to spot overall trends and the exponential moving average (EMA) for quicker responses to price changes. Crossovers between short-term and long-term moving averages signal potential buy or sell opportunities. For example, when a short-term EMA crosses above a long-term SMA, it could indicate a bullish trend, prompting a buy. Conversely, a crossover below may suggest a bearish trend, signaling a sell.
What role do volume indicators play in day trading?
Volume indicators help day traders assess market strength and potential price movements. They indicate how much of an asset is being traded, which can signal trends. High volume often confirms a price move, while low volume may suggest weakness. Traders use volume indicators like On-Balance Volume (OBV) and Volume Moving Average to identify entry and exit points. In essence, they provide crucial insights into market activity, helping traders make informed decisions.
How can I use RSI for day trading strategies?
To use the Relative Strength Index (RSI) for day trading, follow these steps:
1. Identify Overbought or Oversold Conditions: Use the RSI values; above 70 indicates overbought, while below 30 suggests oversold. Look for potential reversals near these levels.
2. Look for Divergences: Compare price movements with RSI. If the price makes a new high but RSI doesn't, it may signal a reversal.
3. Confirm Trends: Use RSI to confirm existing trends. If the RSI stays above 50 during an uptrend, it's a bullish sign.
4. Set Entry and Exit Points: Consider entering trades when the RSI crosses above 30 (for buys) or below 70 (for sells). Set stop-losses based on support and resistance levels.
5. Combine with Other Indicators: Enhance your strategy by pairing RSI with moving averages or MACD for better accuracy.
6. Timeframe Consideration: Use shorter timeframes like 5-min or 15-min charts for day trading to capture quick movements.
Apply these techniques consistently to refine your day trading strategies with RSI.
What is the significance of Bollinger Bands in day trading?
Bollinger Bands are significant in day trading because they help identify volatility and potential price reversals. The bands consist of a moving average and two standard deviation lines, indicating when an asset is overbought or oversold. Traders use them to spot breakouts or trend reversals; prices often bounce between the bands. A squeeze of the bands signals low volatility and potential for a strong price move. Thus, they are key for making informed entry and exit decisions in various markets.
How do candlestick patterns serve as day trading indicators?
Candlestick patterns serve as day trading indicators by providing visual insights into market sentiment and potential price movements. Patterns like dojis signal indecision, while bullish engulfing patterns suggest upward momentum. Traders use these formations to identify entry and exit points, helping them capitalize on short-term price fluctuations. For instance, a hammer pattern at support might indicate a reversal, prompting a buy signal. By analyzing these patterns in different time frames, traders can make informed decisions tailored to specific markets.
What are the advantages of using MACD in day trading?
The advantages of using MACD in day trading include its ability to identify trends and momentum shifts effectively. It helps traders spot potential buy and sell signals through the crossing of the MACD line and the signal line. Additionally, MACD can indicate overbought or oversold conditions, aiding in timing entries and exits. Its versatility allows application across various markets, making it a reliable tool for day traders seeking to optimize their strategies.
How can chart patterns enhance my day trading approach?
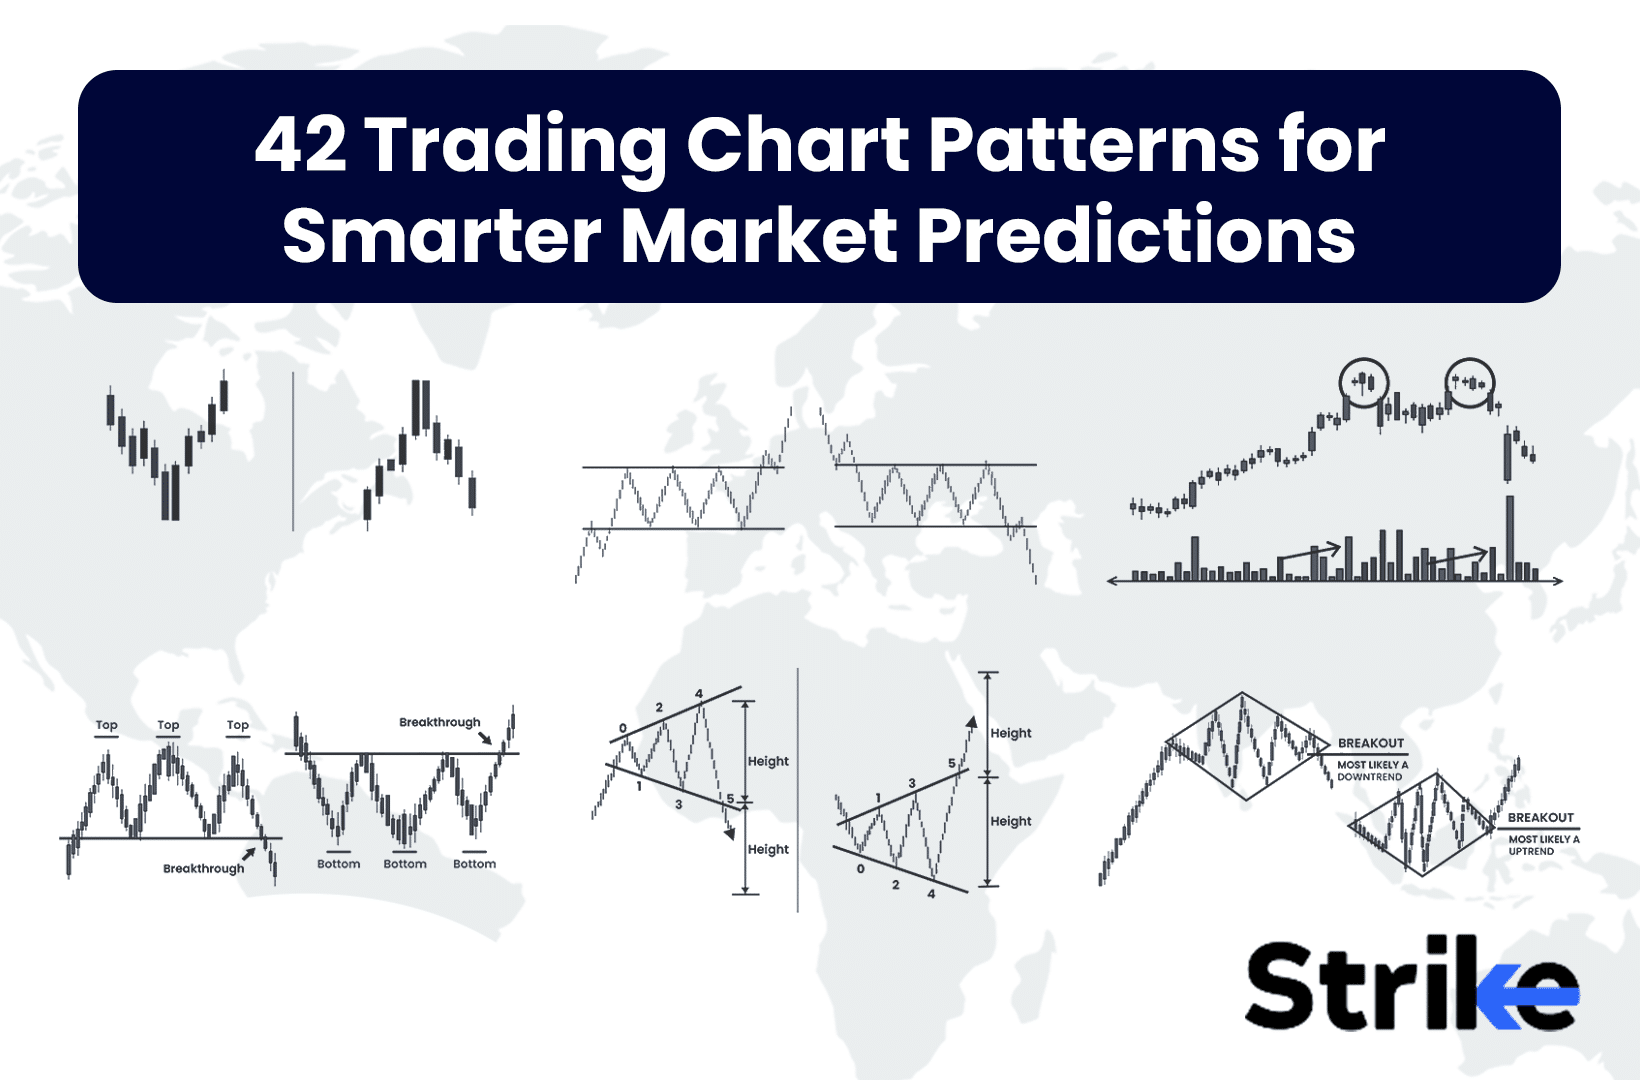
Chart patterns can enhance your day trading approach by providing visual cues for potential price movements. Recognizing patterns like head and shoulders, triangles, or flags can help you identify entry and exit points. For instance, a breakout from a triangle pattern often signals a strong move, allowing you to capitalize on momentum. Additionally, using these patterns alongside other indicators, like volume or moving averages, can confirm signals and reduce risk. Ultimately, mastering chart patterns sharpens your decision-making and increases your chances of successful trades.
Learn about How to Use Chart Patterns for Day Trading Analysis
What day trading indicators work best in volatile markets?
In volatile markets, the best day trading indicators include:
1. Bollinger Bands: They help identify price volatility and potential reversal points.
2. Average True Range (ATR): This measures market volatility and can guide stop-loss placements.
3. Relative Strength Index (RSI): It indicates overbought or oversold conditions, which is crucial in fast-moving markets.
4. Volume: High trading volume can confirm price trends and signal strong movements.
5. Moving Averages: Short-term moving averages can help pinpoint entry and exit points amidst price swings.
Using these indicators effectively can enhance your decision-making in volatile conditions.
Learn about Best Day Trading Indicators for Beginners
How do I combine indicators for day trading success?
To combine indicators for day trading success, start by selecting a mix of trend, momentum, and volume indicators. Use a moving average (like the 50-day MA) to identify the trend, the Relative Strength Index (RSI) for momentum, and the Volume Oscillator to gauge buying or selling strength.
Look for confluences where these indicators align. For instance, if the price is above the moving average, RSI is above 50, and volume is increasing, that suggests a strong buying opportunity. Test combinations on a demo account to find what works best for your trading style and the specific market you’re in. Adjust your strategy based on market conditions and keep it flexible.
Learn about How to Combine Charting with Day Trading Strategies
What are lagging vs. leading indicators in day trading?
Lagging indicators are tools that reflect past price movements, helping traders confirm trends after they have occurred. Examples include moving averages and the Relative Strength Index (RSI). Leading indicators, on the other hand, predict future price movements, allowing traders to anticipate market changes. Common leading indicators include the Stochastic Oscillator and the MACD. In day trading, using both types can help balance confirmation and prediction for better decision-making.
Learn about Understanding Lagging vs. Leading Indicators in Day Trading
How can I effectively interpret day trading signals?
To effectively interpret day trading signals, focus on key indicators relevant to your market. Use moving averages to identify trends; look for crossovers as buy or sell signals. Analyze volume to confirm price movements—high volume can validate a trend. Utilize RSI to gauge overbought or oversold conditions, helping you spot potential reversals. For forex, pay attention to news events and economic indicators, as they can significantly impact price. In stocks, watch for chart patterns like flags or triangles for entry and exit points. Always combine multiple indicators for a clearer picture and manage risk with stop-loss orders.
Learn about How to Use AI for Day Trading Signals?
What is the impact of news on day trading indicators?
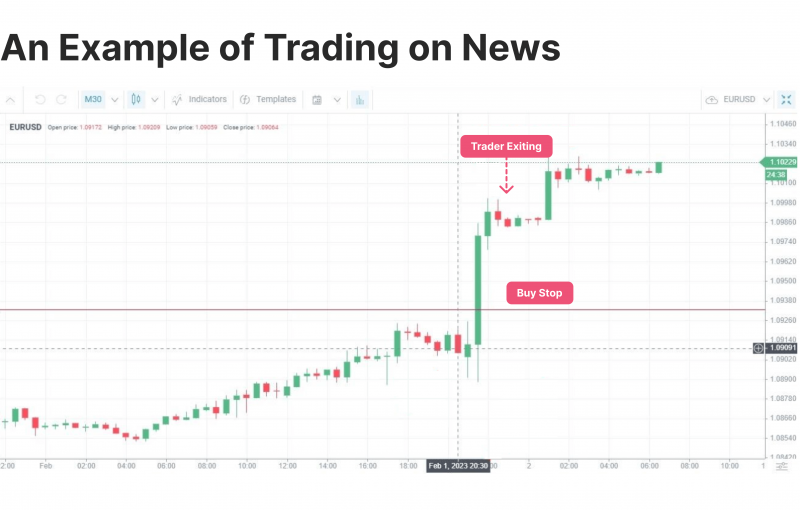
News significantly impacts day trading indicators by causing volatility and influencing price movements. Traders often rely on economic reports, earnings announcements, and geopolitical events to gauge market sentiment. For instance, positive news can lead to bullish trends, prompting indicators like moving averages or Relative Strength Index (RSI) to signal buy opportunities. Conversely, negative news can trigger sell-offs, altering volume and momentum indicators. Thus, day traders must stay informed, as timely news can create actionable signals on charts, affecting their trading strategies across different markets.
Learn about The Impact of News on Day Trading Chart Patterns
Conclusion about Day Trading Indicators for Different Markets
In summary, selecting the right day trading indicators is crucial for success across various markets, including stocks, forex, cryptocurrencies, and futures. Each indicator, from moving averages to RSI and Bollinger Bands, offers unique insights that can enhance your trading strategies. Understanding how to interpret these signals, along with the influence of volume and market news, is essential for making informed decisions. For comprehensive guidance on utilizing these tools effectively, consider the resources available through DayTradingBusiness.
Learn about How to Adapt Day Trading Patterns to Different Markets