Did you know that many traders think “bull market” is just a fancy term for a stampede at a livestock auction? While the stock market might not feature actual bulls, understanding the right indicators is crucial for successful day trading. In this article, we’ll explore the best indicators for day trading strategies, from moving averages to RSI and MACD, and how to combine them effectively. We’ll dive into the significance of volume, the use of Bollinger Bands, and the integration of Fibonacci retracement levels. Plus, we’ll discuss how to avoid indicator overload and backtest your strategies, ensuring you maximize your trading potential. Join us at DayTradingBusiness for a comprehensive guide that will sharpen your trading skills and help you navigate market conditions like a pro!
What are the best indicators for day trading strategies?
The best indicators for day trading strategies include:
1. Moving Averages (MA): Use the 50-day and 200-day MAs to identify trends.
2. Relative Strength Index (RSI): Helps determine overbought or oversold conditions.
3. MACD (Moving Average Convergence Divergence): Signals potential buy or sell opportunities.
4. Bollinger Bands: Indicate volatility and potential price reversals.
5. Volume: Confirms the strength of a price movement or trend.
Combine these indicators for a more robust strategy, like using RSI with MACD for entry and exit points.
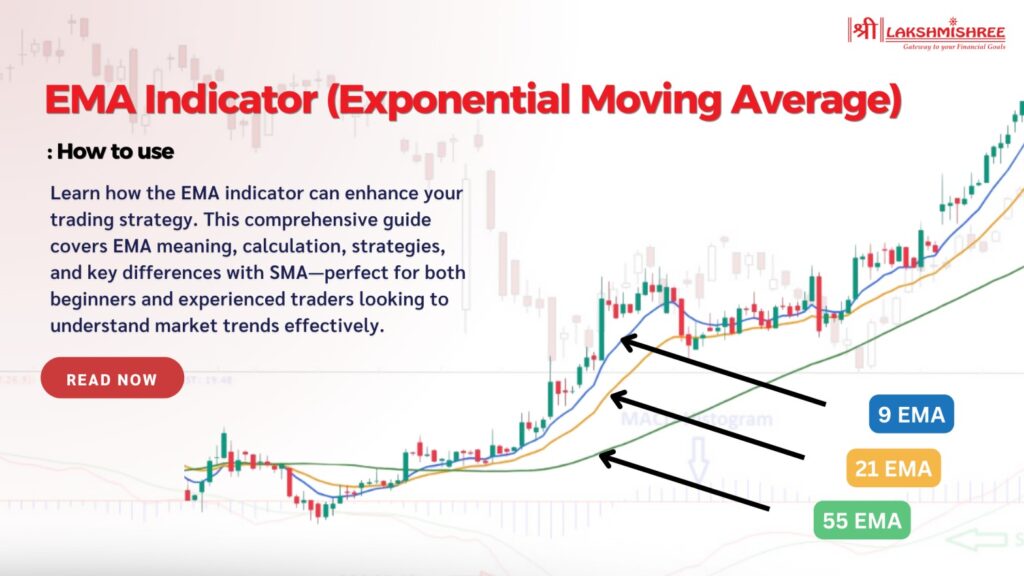
How do I combine moving averages for effective day trading?
To combine moving averages for effective day trading, use two types: a short-term moving average (like the 9 or 20-period) and a longer-term moving average (like the 50 or 200-period).
1. Crossover Strategy: Buy when the short-term moving average crosses above the long-term average, signaling an uptrend. Sell when it crosses below, indicating a downtrend.
2. Trend Confirmation: Ensure both moving averages are sloping in the same direction for stronger signals. This confirms the trend’s strength.
3. Support and Resistance: Use moving averages as dynamic support or resistance levels. Price bouncing off these averages can indicate potential entry and exit points.
4. Adjust for Volatility: Consider adjusting the moving average periods based on market volatility to optimize responsiveness.
5. Combine with Other Indicators: Pair moving averages with momentum indicators like RSI or MACD for additional confirmation of trade signals.
This approach helps you make informed decisions in day trading by effectively utilizing moving averages.
What role do RSI and MACD play in day trading?
RSI (Relative Strength Index) helps identify overbought or oversold conditions, signaling potential reversal points in day trading. A reading above 70 suggests overbought, while below 30 indicates oversold. MACD (Moving Average Convergence Divergence) shows momentum and trend direction, helping traders spot buy or sell signals through crossovers.
Combining RSI and MACD enhances trading strategies. For instance, if RSI indicates oversold while MACD shows a bullish crossover, it strengthens the case for a buy. This synergy allows traders to make more informed decisions, increasing the chances of profitable trades.
How can I use Bollinger Bands in my day trading strategy?
To use Bollinger Bands in your day trading strategy, follow these steps:
1. Identify Trends: Use Bollinger Bands to spot trend direction. When prices consistently touch the upper band, it indicates a bullish trend; touching the lower band suggests a bearish trend.
2. Look for Breakouts: Watch for price movements outside the bands. A breakout above the upper band may signal a strong upward trend, while a move below the lower band could indicate a downward trend.
3. Combine with Other Indicators: Pair Bollinger Bands with other indicators like RSI or MACD for confirmation. For instance, if the price breaks the upper band and the RSI is above 70, it may be a good time to take profits.
4. Set Entry and Exit Points: Use the middle band (the moving average) as a potential entry point. Enter when the price retraces to the middle band in an uptrend, and consider exiting near the outer bands.
5. Manage Risk: Set stop-loss orders just outside the bands to protect against false breakouts. This helps limit losses if the price reverses unexpectedly.
Implement these strategies to enhance your day trading effectiveness with Bollinger Bands.
What is the significance of volume in day trading indicators?
Volume is crucial in day trading indicators because it confirms price movements and trends. High volume indicates strong interest and can signal potential reversals or continuations. When combined with other indicators like moving averages or RSI, volume enhances the reliability of signals. For instance, a breakout on high volume suggests a strong trend, while low volume during a price increase may indicate weakness. Using volume alongside price action helps traders make informed decisions, increasing the chances of successful trades.
How do I integrate Fibonacci retracement levels in day trading?
To integrate Fibonacci retracement levels in day trading, first identify a significant price move—either upward or downward. Draw Fibonacci retracement lines from the high to the low of that move. Look for key levels (23.6%, 38.2%, 50%, 61.8%) where price may reverse or consolidate.
Combine these levels with other indicators like moving averages or RSI for confirmation. For example, if the price retraces to the 61.8% level and the RSI shows oversold conditions, consider entering a long position. Always set stop-loss orders just below key Fibonacci levels to manage risk effectively.
Can I use candlestick patterns alongside technical indicators?
Yes, you can use candlestick patterns alongside technical indicators in your day trading strategies. Combining these tools enhances your analysis, helping you identify trends and potential reversal points more effectively. For instance, you might use a candlestick pattern like a doji to signal indecision, then confirm it with an RSI or MACD indicator to gauge momentum. This approach can lead to better-informed trading decisions.
What are the benefits of using multiple indicators in day trading?
Using multiple indicators in day trading enhances decision-making by providing a clearer market picture. Different indicators can confirm trends, reducing the risk of false signals. For instance, combining a moving average with RSI can indicate both price direction and momentum. This synergy improves entry and exit points, increasing potential profits. Also, diverse indicators can help identify overbought or oversold conditions, allowing traders to capitalize on reversals. Ultimately, using multiple indicators leads to more informed, strategic trading decisions.
How do I avoid indicator overload in my trading strategy?
To avoid indicator overload in your day trading strategy, focus on a few key indicators that complement each other. Choose a mix of trend, momentum, and volume indicators. For example, use a moving average for trend direction, the RSI for momentum, and volume to confirm signals. Limit yourself to three or four indicators to maintain clarity. Regularly test and adjust your indicators based on market conditions. Simplifying your setup helps you make quicker, more informed decisions without confusion.
What is the best way to backtest combined indicators for day trading?
The best way to backtest combined indicators for day trading is to use a trading platform with backtesting capabilities, like TradingView or MetaTrader. First, define your strategy by selecting indicators (e.g., moving averages, RSI, MACD) and set specific entry and exit rules. Then, input these rules into the platform’s strategy builder or coding environment.
Run the backtest over historical data to evaluate performance metrics like win rate, average return, and drawdown. Analyze the results to refine your strategy, adjusting indicator parameters as necessary. Finally, ensure you conduct multiple backtests across different market conditions to validate robustness.
How can I effectively use trend lines with other indicators?
To effectively use trend lines with other indicators in day trading, start by identifying key trend lines on your chart. Once established, combine them with indicators like moving averages, RSI, or MACD. For example, when the price approaches a trend line and the RSI indicates overbought conditions, consider it a signal to sell. Similarly, if the price breaks a trend line while the MACD shows bullish momentum, it may be a good buying opportunity. Always look for confluence—when multiple indicators suggest the same direction, it strengthens your trading decision. Adjust your entry and exit points based on these confirmations for better risk management.
Learn about How to Use Trend Lines in Day Trading Charts
What are the top mistakes to avoid when combining indicators?
1. Overcomplicating: Using too many indicators can lead to confusion. Stick to a few that complement each other.
2. Redundant Indicators: Avoid indicators that provide the same information. For example, combining two momentum indicators can be unnecessary.
3. Ignoring Market Context: Don't apply indicators blindly without considering market conditions. Adjust your strategy based on whether the market is trending or ranging.
4. Lack of Backtesting: Failing to test your combination of indicators can lead to losses. Always backtest your strategy on historical data.
5. Neglecting Timeframes: Using indicators suited for different timeframes can create conflicting signals. Ensure all indicators align with your trading timeframe.
6. Disregarding Risk Management: Even the best indicators can't replace sound risk management. Set stop-losses and manage position sizes effectively.
7. Fixed Rules: Rigidly following indicator signals without adapting to market changes can be detrimental. Stay flexible and adjust your approach as needed.
How do market conditions affect indicator effectiveness in day trading?
Market conditions greatly influence the effectiveness of indicators in day trading. In trending markets, momentum indicators like the RSI or MACD can provide clearer signals. However, in choppy or sideways markets, these indicators may give false signals or whipsaws.
Volume indicators become crucial during high volatility, as they help confirm price movements. In contrast, during low-volume periods, indicators may lag or lead to unreliable trades.
Combining indicators tailored to current market conditions enhances strategy effectiveness. For example, using trend indicators alongside volatility measures can help refine entry and exit points. Adjusting your indicators based on market behavior is key to successful day trading.
Learn about How Do Market Makers and Liquidity Providers Affect Day Trading?
What indicators work best for scalping in day trading?
For scalping in day trading, effective indicators include:
1. Moving Averages: Use short-term moving averages (like the 5-period and 20-period) to identify trends quickly.
2. Relative Strength Index (RSI): An RSI below 30 indicates oversold conditions, while above 70 shows overbought conditions, helping you spot potential reversals.
3. Bollinger Bands: These help identify volatility and potential price breakouts. Prices touching the lower band suggest a buy signal, while touching the upper band indicates a sell.
4. Volume: High volume confirms trends and signals strength behind price movements, crucial for scalping.
5. Stochastic Oscillator: This helps identify overbought and oversold conditions, similar to RSI, but with a different calculation method.
Combining these indicators can enhance your scalping strategy by confirming entry and exit points effectively.
How can I develop a customized indicator combination for day trading?
To develop a customized indicator combination for day trading, start by identifying your trading style and goals. Choose indicators that align with these, such as moving averages for trend direction, RSI for momentum, and MACD for potential reversals. Experiment with different time frames to see which combinations yield the best results for your strategy.
Backtest your selected indicators using historical data to evaluate their effectiveness. Adjust parameters based on your findings and continue refining your combination. Always incorporate risk management tools, like stop-loss orders, to protect your capital. Finally, keep a trading journal to track performance and make necessary adjustments.
What is the impact of news events on day trading indicators?
News events significantly influence day trading indicators by causing rapid price movements and increased volatility. Traders often rely on indicators like moving averages and RSI to gauge market sentiment, but during major news releases, these indicators can generate false signals. For example, a positive earnings report might push stock prices up, but conflicting economic data could lead to a quick sell-off. Thus, combining indicators with news awareness allows traders to adapt their strategies, using tools like Bollinger Bands to identify breakout opportunities or volume indicators to confirm trends. In essence, staying tuned to news events while analyzing indicators enhances decision-making and risk management in day trading.
Learn about How News Events Impact Day Trading Decisions
Conclusion about Combining Indicators for Day Trading Strategies
Incorporating multiple indicators can significantly enhance your day trading strategies, allowing for a more nuanced understanding of market movements. By effectively combining tools like moving averages, RSI, MACD, and Bollinger Bands, you can make informed trading decisions that align with current market conditions. However, it's crucial to avoid indicator overload and to backtest your strategies to ensure effectiveness. By leveraging insights from DayTradingBusiness, you can refine your approach, minimize mistakes, and create a customized trading plan that maximizes your chances of success.
Learn about Combining Day Trading Strategies for Better Results