Did you know that 90% of day traders fail, often because they can't tell the difference between a candlestick and a popsicle stick? In this article, we delve into advanced techniques for indicator analysis in day trading, highlighting the key indicators that every trader should know. You'll discover how moving averages can refine your strategies and why the Relative Strength Index (RSI) is crucial for timing your trades. Learn the effective applications of Bollinger Bands and the MACD's role in short-term trading. We'll explore how volume indicators and Fibonacci retracements can influence your decisions, along with the importance of candlestick patterns. Additionally, we’ll cover advanced techniques to improve indicator accuracy, the impact of sentiment analysis, best practices for combining indicators, and how backtesting can enhance your trading effectiveness. Finally, we’ll discuss the common pitfalls in indicator analysis and how tech tools from DayTradingBusiness can elevate your trading game.
What are the key indicators used in day trading?
Key indicators used in day trading include:
1. Moving Averages: Help identify trends by smoothing price data.
2. Relative Strength Index (RSI): Measures momentum and overbought or oversold conditions.
3. MACD (Moving Average Convergence Divergence): Shows the relationship between two moving averages of a security’s price.
4. Bollinger Bands: Indicate volatility and potential price reversals.
5. Volume: Confirms trends and signals potential reversals based on trading activity.
6. Stochastic Oscillator: Compares a security’s closing price to its price range over a specific period.
Each of these indicators provides unique insights that can enhance trading decisions.
How do moving averages enhance trading strategies?
Moving averages enhance trading strategies by smoothing price data, helping to identify trends and potential reversal points. They reduce noise from market fluctuations, making it easier to spot entry and exit signals. Traders often use different types, like simple moving averages (SMA) and exponential moving averages (EMA), to gauge momentum. For instance, a crossover strategy, where a short-term EMA crosses above a long-term SMA, can signal a buy opportunity. Additionally, moving averages can help set stop-loss levels and target prices based on historical support and resistance.
What is the significance of RSI in day trading?
RSI, or Relative Strength Index, is crucial in day trading as it helps identify overbought or oversold conditions. A reading above 70 suggests an asset may be overbought, signaling a potential sell opportunity, while a reading below 30 indicates it may be oversold, suggesting a buy opportunity. Traders use RSI to spot reversals and confirm trends, enhancing decision-making. Properly interpreting RSI can lead to more strategic entries and exits, ultimately improving profitability.
How can Bollinger Bands be applied effectively?
Bollinger Bands can be applied effectively in day trading by using them to identify volatility and potential price reversals.
1. Trend Identification: When the price touches the upper band, it may indicate overbought conditions; when it touches the lower band, it may suggest oversold conditions.
2. Breakouts: Look for price to break above or below the bands. A breakout can signal the start of a strong trend.
3. Squeeze Strategy: A squeeze occurs when the bands narrow, indicating low volatility. Traders often look for a breakout in either direction following a squeeze.
4. Confirm with Other Indicators: Combine Bollinger Bands with other indicators like RSI or MACD for confirmation of signals to improve accuracy.
5. Set Stop-Loss Levels: Use the bands to set stop-loss orders. For instance, placing a stop just outside the bands can help manage risk.
Applying these techniques can enhance your trading strategy and improve decision-making in volatile markets.
What role does MACD play in short-term trading?
MACD, or Moving Average Convergence Divergence, helps short-term traders identify momentum and potential trend reversals. By analyzing the MACD line and the signal line, traders can pinpoint buy or sell signals. A MACD crossover—when the MACD line crosses above the signal line—suggests a bullish signal, while a crossover below indicates bearish momentum. Additionally, traders look for divergences between MACD and price action to spot potential reversals. This makes MACD a crucial tool for timing entries and exits in day trading.
How do volume indicators influence trading decisions?
Volume indicators influence trading decisions by providing insight into the strength of a price move. High volume during an uptrend suggests strong buying interest, signaling a potential continuation. Conversely, low volume can indicate weakness, prompting traders to be cautious. Volume spikes often precede significant price movements, helping traders identify entry and exit points. Furthermore, analyzing volume trends can reveal potential reversals or confirm breakout patterns, guiding traders in making informed decisions.
What are the benefits of using Fibonacci retracements?
Fibonacci retracements help identify potential reversal levels in day trading, enhancing entry and exit strategies. They provide traders with clear support and resistance zones, making it easier to set stop-loss orders. By using Fibonacci levels, traders can gauge market sentiment and anticipate price movements, improving decision-making. They also facilitate risk management by helping to define trade parameters. Overall, Fibonacci retracements offer a structured approach to analyzing price action and enhancing trading efficiency.
How can traders utilize candlestick patterns?
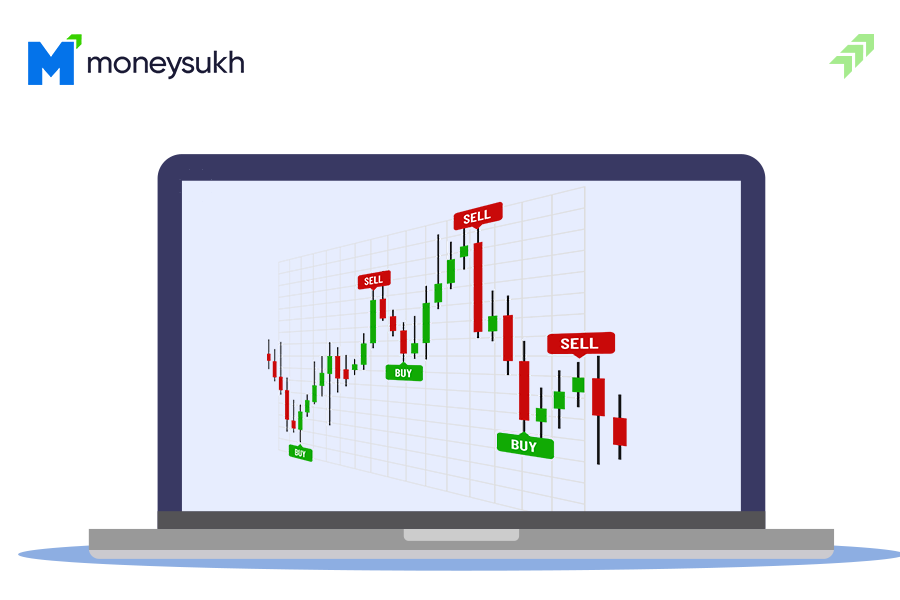
Traders can utilize candlestick patterns by identifying key formations that signal potential market reversals or continuations. For instance, a "hammer" may indicate a bullish reversal after a downtrend, while a "shooting star" can signal a bearish reversal after an uptrend.
By analyzing patterns like "engulfing" or "doji," traders can gain insights into market sentiment and momentum. They can combine candlestick analysis with other indicators, such as moving averages or RSI, to enhance decision-making.
Additionally, observing candlestick patterns within support and resistance levels can improve entry and exit points, increasing the chances of successful trades.
What advanced techniques improve indicator accuracy?
To improve indicator accuracy in day trading, consider these advanced techniques:
1. Multi-Timeframe Analysis: Use indicators across different timeframes to confirm signals and enhance reliability.
2. Divergence Analysis: Look for divergences between price and indicators like RSI or MACD to spot potential reversals.
3. Volume Analysis: Integrate volume data with indicators to validate breakouts and trends, ensuring signals are supported by market activity.
4. Custom Indicator Development: Create personalized indicators tailored to your trading strategy, combining existing ones for unique insights.
5. Machine Learning: Apply machine learning algorithms to analyze historical data and identify patterns that can improve indicator performance.
6. Market Context Evaluation: Factor in broader market conditions and news events, adjusting indicators to align with the overall market sentiment.
Utilizing these techniques can significantly enhance the accuracy of your trading indicators.
How does sentiment analysis affect trading indicators?
Sentiment analysis affects trading indicators by providing insights into market psychology. By evaluating social media, news, and forums, traders can gauge whether the sentiment is bullish or bearish. This data can enhance traditional indicators like moving averages or RSI by confirming or contradicting signals. For instance, if sentiment is positive while a stock is nearing a support level, it might indicate a strong buying opportunity. Conversely, negative sentiment can signal a potential sell, even if indicators suggest otherwise. Integrating sentiment analysis with technical indicators can lead to more informed trading decisions.
Learn about How to Build a Sentiment Analysis Dashboard for Day Trading
What are the best practices for combining multiple indicators?
1. Divergence Analysis: Use indicators like RSI or MACD to spot divergences with price movements for stronger signals.
2. Confirmation: Combine trend indicators (like moving averages) with momentum indicators (like Stochastic) to confirm trends before entering trades.
3. Time Frame Alignment: Ensure indicators are aligned across multiple time frames to validate signals and reduce noise.
4. Limit Overlap: Avoid using indicators that provide similar information. For example, don’t combine multiple momentum indicators; instead, pair different types like a trend and a volatility indicator.
5. Backtesting: Test combinations on historical data to see how they perform together before applying them in real-time trading.
6. Adjust Settings: Customize indicators’ parameters to fit the specific asset or market conditions for better accuracy.
7. Visual Clarity: Keep charts clean. Use different colors or styles for each indicator to easily distinguish them and avoid confusion.
8. Risk Management: Always incorporate stop-loss and take-profit levels based on combined indicator signals to manage risk effectively.
How can backtesting improve indicator effectiveness?
Backtesting improves indicator effectiveness by allowing traders to evaluate how well an indicator would have performed with historical data. This process helps identify the strengths and weaknesses of the indicator under different market conditions. By analyzing past performance, traders can fine-tune their strategies, optimize indicator parameters, and increase confidence in their trading decisions. Ultimately, backtesting reveals whether an indicator is reliable, leading to more informed and effective trading.
What is the impact of market news on indicator signals?
Market news significantly impacts indicator signals in day trading by causing volatility and influencing trader sentiment. Positive news can lead to bullish signals, while negative news often triggers bearish signals. For instance, an earnings report exceeding expectations may result in rising prices, aligning with momentum indicators. Conversely, adverse economic data can prompt a sell-off, affecting trend indicators. Traders must analyze such news alongside indicators to make informed decisions, as real-time reactions can create discrepancies between technical analysis and market reality.
How do traders adjust indicators for different markets?
Traders adjust indicators for different markets by customizing parameters based on market volatility and trading volume. For example, in a fast-moving market like cryptocurrencies, they might use shorter moving averages to capture quick price changes. In contrast, for a more stable market like blue-chip stocks, longer moving averages help identify broader trends.
They also consider the specific characteristics of each market; for instance, adjusting the Relative Strength Index (RSI) thresholds can help account for different price behaviors. Additionally, traders may use backtesting to refine indicator settings, ensuring they align with the unique patterns of the market they are analyzing. Ultimately, adapting indicators enhances their relevance and effectiveness in day trading across various assets.
What are the common pitfalls in indicator analysis?
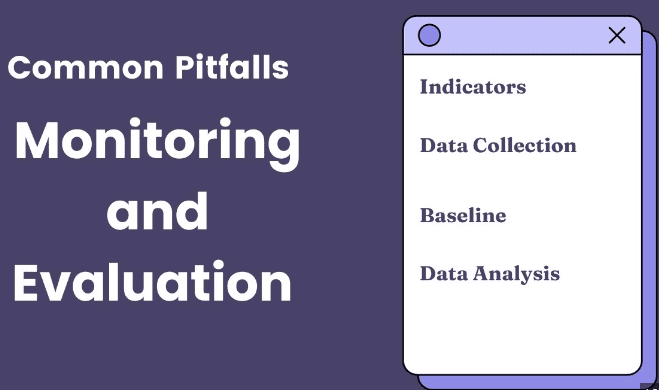
Common pitfalls in indicator analysis for day trading include over-reliance on a single indicator, ignoring market context, and failing to consider multiple time frames. Traders often misinterpret lagging indicators, leading to late entries or exits. Overtrading based on false signals from indicators can deplete capital quickly. Additionally, neglecting to factor in news events and market sentiment can result in poor decision-making. Lastly, using indicators without a solid trading plan can lead to inconsistent results.
How can tech tools enhance indicator analysis in day trading?
Tech tools enhance indicator analysis in day trading by providing real-time data, advanced charting capabilities, and automation. Platforms like TradingView or Thinkorswim allow traders to apply multiple indicators simultaneously, helping to identify trends and signals more effectively. Algorithms can automate the analysis process, quickly scanning for patterns and executing trades based on predefined criteria. Additionally, backtesting tools enable traders to evaluate indicator performance against historical data, refining strategies before live trading. Overall, these tools improve accuracy, speed, and decision-making in day trading.
Learn about How Does Machine Learning Enhance Day Trading?
Conclusion about Advanced Techniques for Indicator Analysis in Day Trading
Incorporating advanced techniques for indicator analysis can significantly refine your day trading strategies. Understanding key indicators like moving averages, RSI, and Bollinger Bands, along with effective use of volume indicators and Fibonacci retracements, enhances decision-making. Employing sentiment analysis, backtesting strategies, and leveraging technology further sharpens your trading edge. By recognizing common pitfalls and adapting indicators to varying market conditions, traders can maximize their potential for success. For comprehensive insights and support, rely on DayTradingBusiness to elevate your trading expertise.
Learn about Real-Time Indicator Analysis for Day Trading