Did you know that 90% of day traders lose money, often because they can't spot a trend even if it was dancing in front of them? In the world of day trading, identifying patterns is crucial for making informed decisions and improving your strategies. This article dives into the essential patterns you need to know, including candlestick, trend, reversal, and continuation patterns, and how they impact your trading outcomes. We’ll explore the significance of volume patterns, tools for effective pattern identification, and the role of technical analysis. Additionally, it highlights common pitfalls in recognizing patterns and how to differentiate between reliable and false signals. By mastering these concepts with insights from DayTradingBusiness, you can enhance your trading strategies and increase your chances of success in the market.
What are the main patterns in day trading analysis?
The main patterns in day trading analysis include:
1. Candlestick Patterns: Look for formations like dojis, hammers, and engulfing patterns to gauge market sentiment.
2. Chart Patterns: Identify shapes like flags, pennants, and head and shoulders that signal potential price movements.
3. Volume Patterns: Analyze trading volume spikes to confirm trends or reversals; higher volume often validates a price move.
4. Moving Averages: Use crossing moving averages (like the 50-day and 200-day) to identify bullish or bearish trends.
5. Support and Resistance Levels: Recognize price levels where stocks tend to reverse or consolidate, guiding entry and exit points.
6. Trend Lines: Draw trend lines to visualize market direction and potential breakouts.
By focusing on these patterns, day traders can make informed decisions and improve their trading strategies.
How do candlestick patterns influence day trading?
Candlestick patterns play a crucial role in day trading by helping traders identify potential market reversals and continuations. Patterns like doji, hammer, and engulfing indicate shifts in momentum. For example, a hammer suggests a bullish reversal after a downtrend, while an engulfing pattern may signal a strong move in the opposite direction. Traders use these patterns to make informed decisions about entry and exit points, manage risk, and set stop-loss orders. Recognizing these patterns enhances analysis and can lead to more profitable trades.
What is the significance of trend patterns in day trading?
Trend patterns in day trading are crucial for making informed decisions. They help traders identify the direction of price movements—whether upward, downward, or sideways. Recognizing these trends allows traders to time their entries and exits effectively, maximizing potential profits and minimizing losses. Patterns like flags, triangles, and head-and-shoulders reveal market sentiment and potential reversals, guiding strategies. By analyzing these trends, day traders can enhance their analysis, increase their winning trades, and manage risk better.
How can I identify reversal patterns in day trading?
To identify reversal patterns in day trading, look for specific formations on price charts. Key patterns include:
1. Head and Shoulders: This pattern signals a potential reversal after an uptrend. Look for three peaks: a higher peak (head) between two lower peaks (shoulders).
2. Double Top/Bottom: A double top indicates a bearish reversal after an uptrend, forming two peaks at similar levels. A double bottom signals a bullish reversal after a downtrend, creating two troughs.
3. Candlestick Patterns: Watch for key candlestick formations like the engulfing pattern, hammer, or shooting star. These often precede reversals.
4. Divergence: Monitor the relationship between price and indicators like RSI or MACD. If prices make new highs or lows while indicators don't, a reversal may be imminent.
5. Volume Confirmation: Look for increased volume on breakouts from reversal patterns. This adds credibility to the signal.
Combine these patterns with support and resistance levels for more reliable predictions.
What are continuation patterns in day trading strategies?
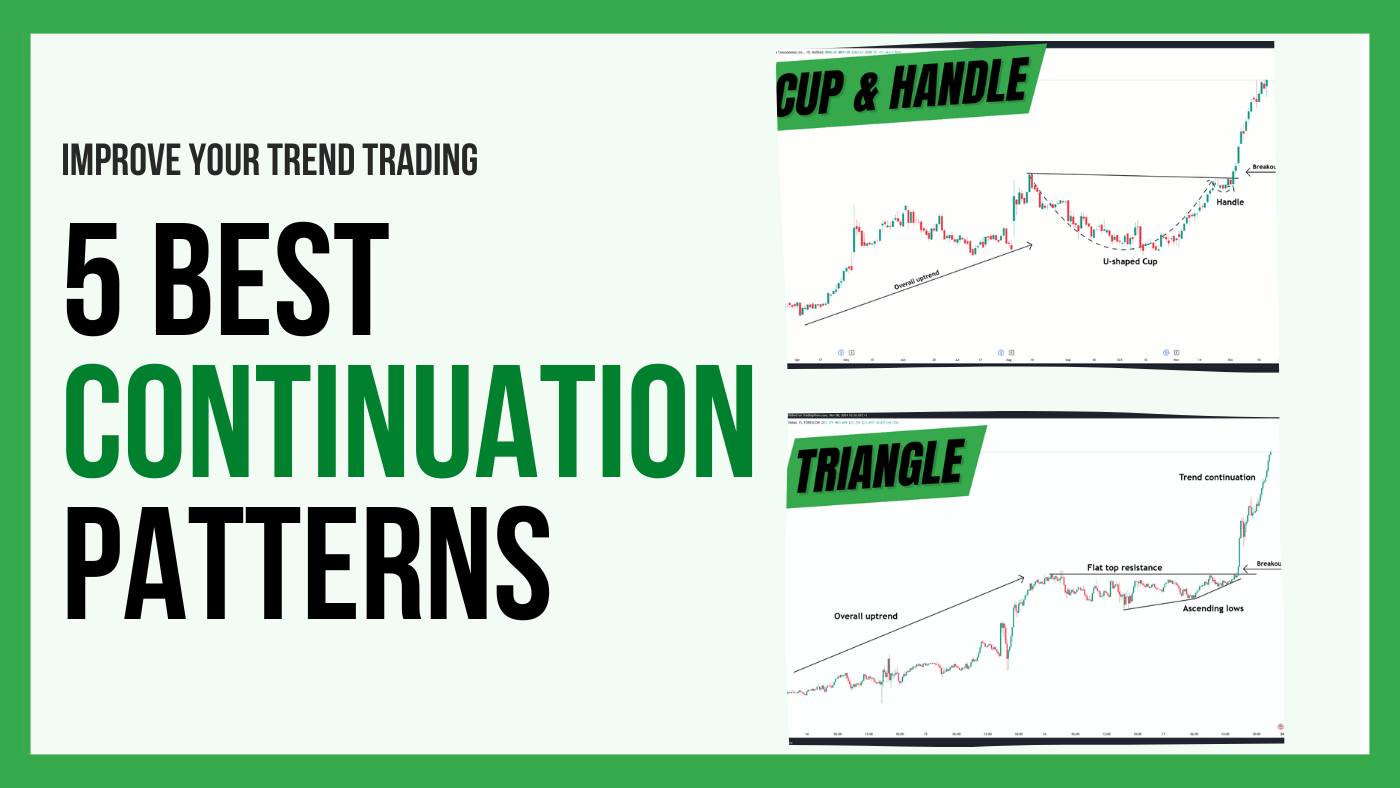
Continuation patterns in day trading strategies are formations that indicate a trend will likely continue after a brief pause. Common types include flags, pennants, and triangles. Traders identify these patterns to make informed decisions about entering or exiting trades, anticipating that the price will resume its previous direction. For example, a flag pattern appears after a strong move and suggests a continuation in the same direction. Recognizing these patterns helps traders capitalize on market momentum.
How do volume patterns affect day trading decisions?
Volume patterns are crucial for day trading decisions as they indicate market strength and potential price movement. High volume often confirms a trend, signaling traders to enter or exit positions. Conversely, low volume can suggest indecision, making it risky to trade. Identifying volume spikes alongside price changes helps traders spot breakouts or reversals. For example, if a stock surges with increased volume, it may indicate a strong buying interest, prompting a buy decision. Monitoring volume patterns allows traders to make informed choices based on market dynamics.
What tools can help identify patterns in day trading?
Tools that can help identify patterns in day trading include:
1. Charting Software: Platforms like TradingView and Thinkorswim offer advanced charting capabilities to visualize price movements and identify patterns.
2. Technical Indicators: Use indicators like Moving Averages, Bollinger Bands, and Relative Strength Index (RSI) to spot trends and potential reversals.
3. Pattern Recognition Software: Tools like PatternSmart and Trade Ideas automatically detect chart patterns and alert you.
4. Backtesting Tools: Programs like MetaTrader and NinjaTrader allow you to test strategies against historical data to see how patterns performed.
5. News Aggregators: Services like Benzinga and MarketWatch provide real-time news that can influence trading patterns.
These tools enhance your ability to spot and act on patterns effectively.
How does chart analysis reveal trading patterns?
Chart analysis reveals trading patterns by visually representing price movements over time, helping traders identify trends, support and resistance levels, and potential reversals. Patterns like head and shoulders, flags, and triangles indicate market sentiment and potential future price action. By analyzing these formations, traders can make informed decisions on entry and exit points, enhancing day trading strategies.
What role does technical analysis play in pattern identification?
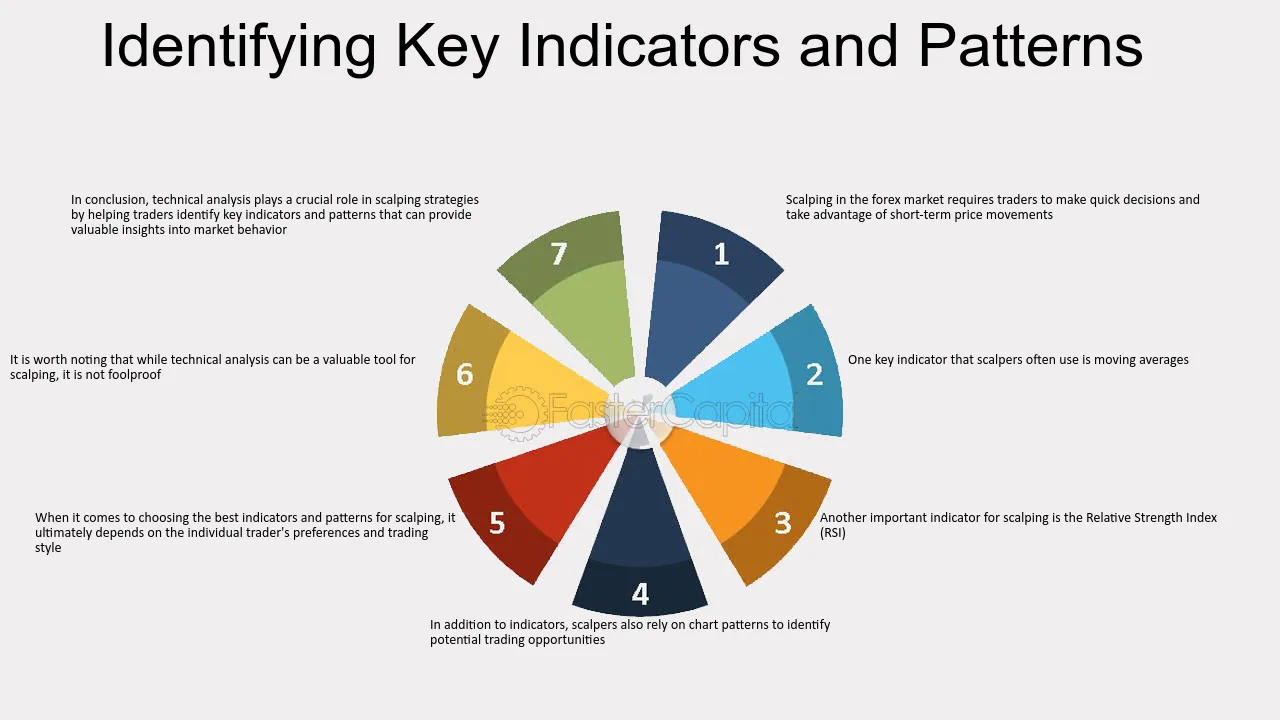
Technical analysis is crucial for pattern identification in day trading. It uses historical price data and volume to recognize patterns, such as head and shoulders or triangles. Traders analyze charts to spot trends and potential reversals, helping them decide when to enter or exit positions. Indicators like moving averages and RSI enhance this identification process, providing insights into market momentum. Ultimately, technical analysis equips traders with tools to make informed decisions based on visual patterns in price movements.
How can I use moving averages to spot trading patterns?
To use moving averages for spotting trading patterns, start by applying both short-term and long-term moving averages on your chart. Look for crossovers: when a short-term moving average crosses above a long-term one, it indicates a potential bullish trend, while a crossover below suggests a bearish trend.
Identify support and resistance levels by observing where price consistently interacts with moving averages. Watch for price action around these averages; if the price bounces off a moving average, it may signal a continuation of the current trend.
Combine moving averages with other indicators, like RSI or MACD, to confirm signals and increase accuracy. This helps you identify patterns like head and shoulders or flags more effectively. Always backtest your strategy to ensure its reliability in different market conditions.
Learn about How to Use Moving Averages in Day Trading Charts
What are the common pitfalls in pattern recognition for day trading?
Common pitfalls in pattern recognition for day trading include over-reliance on historical patterns, misinterpretation of signals, neglecting market context, and failing to adapt to changing conditions. Traders often chase false breakouts or become overly confident in their analysis, leading to poor decisions. Additionally, ignoring volume trends can result in missed opportunities or unnecessary losses. Always combine pattern recognition with risk management and market news for better outcomes.
Learn about What are common legal pitfalls in day trading?
How can I differentiate between reliable and false patterns?
To differentiate between reliable and false patterns in day trading, focus on these key aspects:
1. Volume Confirmation: Reliable patterns typically show increased trading volume. If a pattern forms with low volume, it’s likely false.
2. Time Frame Analysis: Verify patterns across multiple time frames. A pattern visible on a shorter time frame should align with those on longer time frames for reliability.
3. Trend Context: Assess the overall market trend. Patterns that align with the prevailing trend are more likely to be valid.
4. Historical Performance: Review past occurrences of the pattern. If similar patterns have led to successful trades, they’re more credible.
5. Indicators: Use technical indicators like RSI or MACD to confirm patterns. Divergence or convergence can signal reliability.
6. Market Sentiment: Consider news and events affecting the market. External factors can influence the validity of a pattern.
Apply these criteria consistently to improve your ability to identify reliable patterns in day trading.
What impact do market conditions have on pattern effectiveness?
Market conditions significantly influence pattern effectiveness in day trading. In volatile markets, patterns may break down quickly, leading to false signals. Conversely, in stable markets, established patterns tend to hold more reliably, providing clearer entry and exit points. Additionally, high liquidity can enhance the reliability of patterns, while low liquidity may distort them. Understanding the current market environment is crucial for accurately interpreting patterns.
How can pattern recognition improve my trading strategy?

Pattern recognition can significantly enhance your trading strategy by allowing you to identify recurring price movements and trends. By spotting patterns like head and shoulders, flags, or double tops, you can predict potential market movements. This helps you make informed decisions on entry and exit points, manage risk better, and increase your win rate. Using tools like charts and technical indicators can further refine your ability to recognize these patterns, leading to more precise trades. Ultimately, mastering pattern recognition enables you to respond quickly to market changes and capitalize on profitable opportunities.
What resources are available for learning about trading patterns?
To learn about trading patterns, consider these resources:
1. Books: "Technical Analysis of the Financial Markets" by John Murphy and "Japanese Candlestick Charting Techniques" by Steve Nison are excellent starting points.
2. Online Courses: Websites like Udemy and Coursera offer courses specifically on trading patterns and technical analysis.
3. YouTube Channels: Channels like "Rayner Teo" and "Trading 212" provide practical tutorials and pattern recognition techniques.
4. Trading Forums: Join communities like Elite Trader or Trade2Win to discuss patterns and strategies with other traders.
5. Charting Software: Use platforms like TradingView or MetaTrader, which offer tools for identifying and analyzing trading patterns in real time.
6. Webinars: Look for webinars hosted by trading experts that focus on pattern recognition and analysis.
7. Market Analysis Blogs: Follow blogs like Investopedia and BabyPips for insights on trading patterns and market trends.
How often do patterns repeat in day trading?
Patterns in day trading can repeat frequently, often multiple times within a single trading day. Traders typically look for common patterns like flags, pennants, or head and shoulders. The frequency of these repetitions depends on market volatility and trading volume, with more active markets showing quicker pattern formations. Generally, day traders analyze these patterns in shorter time frames, such as 1-minute or 5-minute charts, to capitalize on rapid price movements.
Conclusion about Identifying Patterns: A Key to Day Trading Analysis
In conclusion, mastering pattern identification is essential for successful day trading. By understanding candlestick, trend, reversal, and continuation patterns, traders can make informed decisions and enhance their strategies. Utilizing tools like chart analysis and technical indicators, alongside awareness of market conditions, can significantly improve pattern recognition. For those looking to deepen their knowledge and refine their skills, resources provided by DayTradingBusiness offer valuable insights and guidance. Embrace these techniques to elevate your trading effectiveness and achieve your financial goals.
Learn about Key Concepts of Order Flow Analysis in Day Trading