Did you know that some traders believe chart patterns can predict market movements better than a crystal ball? In this article, we dive deep into the essential role of chart patterns in day trading analysis. You'll discover the most common patterns, how to identify them in stock charts, and their significance for predicting price movements. We’ll explain the difference between bullish and bearish patterns, how to confirm them before trading, and the impact of volume and momentum. Additionally, we’ll explore reversal and continuation patterns, the risks of relying solely on them, and the importance of setting stop-loss orders. Finally, learn how backtesting can enhance your strategy and avoid common pitfalls. Join us at DayTradingBusiness for expert guidance as you master chart patterns and elevate your trading game.
What are the most common chart patterns for day trading?
The most common chart patterns for day trading include:
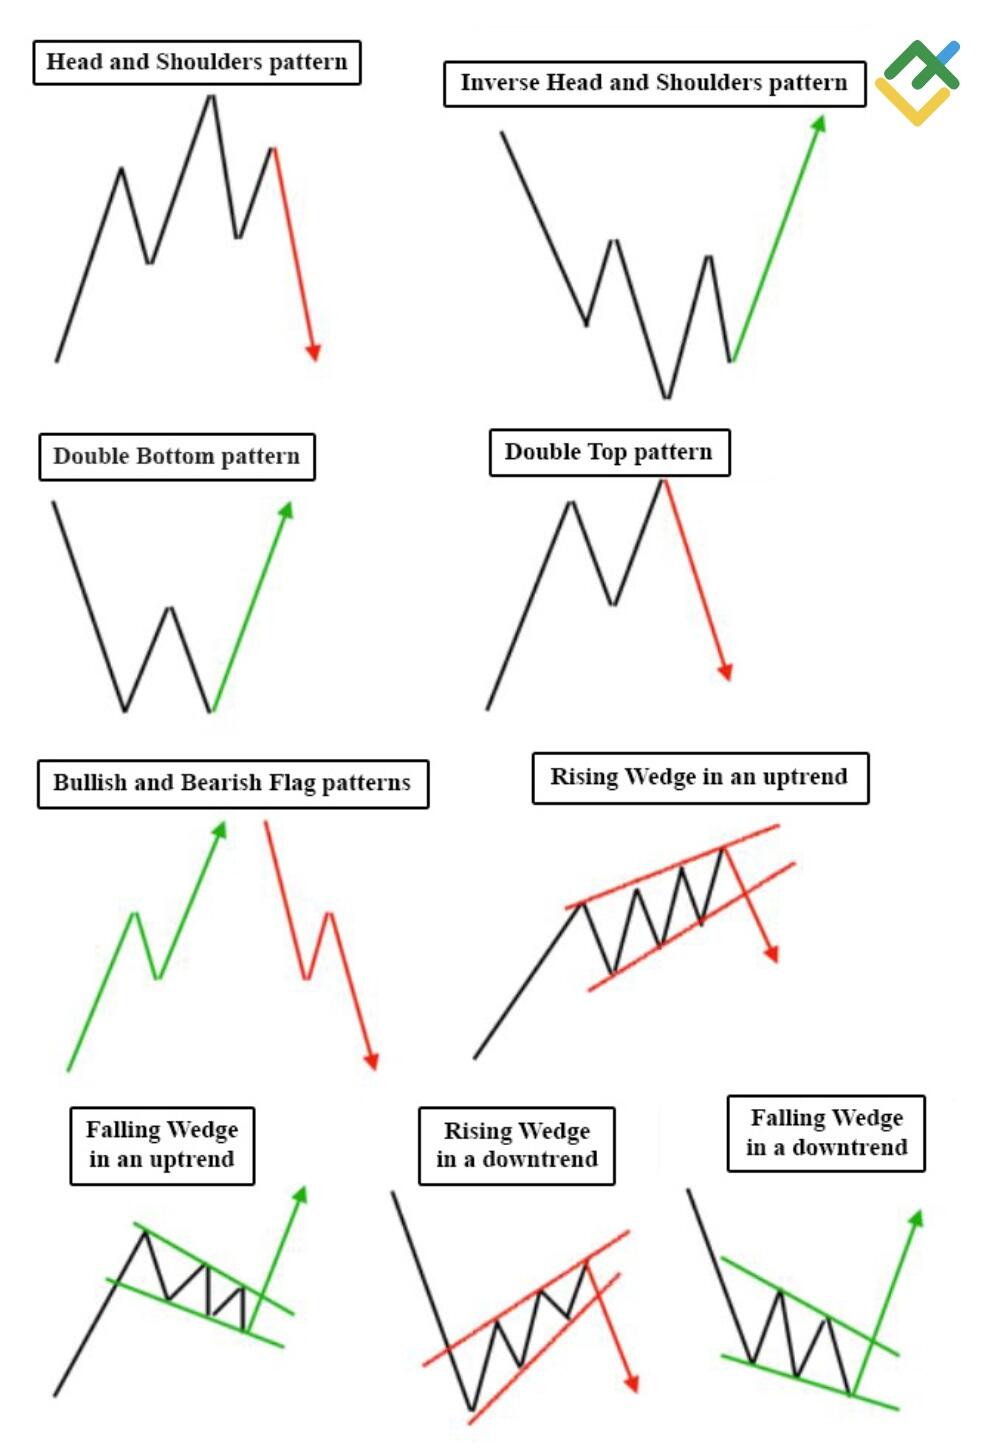
1. Head and Shoulders: Indicates a reversal trend; a peak (head) between two lower peaks (shoulders).
2. Double Top and Bottom: Double tops signal a reversal from bullish to bearish, while double bottoms indicate a shift from bearish to bullish.
3. Triangles: Ascending, descending, and symmetrical triangles show potential breakout points.
4. Flags and Pennants: Short-term continuation patterns that suggest a brief pause before the previous trend resumes.
5. Cup and Handle: A bullish continuation pattern resembling a cup followed by a consolidation (handle) before a breakout.
These patterns help traders identify potential price movements and make informed decisions.
How do you identify chart patterns in stock charts?
To identify chart patterns in stock charts for day trading, follow these steps:
1. Look for Common Patterns: Focus on well-known patterns like head and shoulders, triangles, flags, and double tops/bottoms.
2. Use Trendlines: Draw trendlines to highlight potential support and resistance levels. Patterns often form around these lines.
3. Check Volume: Analyze trading volume to confirm patterns. Increasing volume during a breakout signals strength.
4. Timeframe Matters: Use shorter timeframes, like 5-minute or 15-minute charts, for day trading to spot patterns quickly.
5. Identify Breakouts: Watch for breakouts from established patterns. This indicates a potential price move.
6. Practice Recognition: Regularly review charts to familiarize yourself with how patterns develop.
7. Use Technical Indicators: Combine patterns with indicators like MACD or RSI for better confirmation of trades.
Consistent practice and analysis will enhance your ability to spot these patterns effectively.
Why are chart patterns important for day trading?
Chart patterns are crucial for day trading because they help traders identify potential price movements and trends. Recognizing patterns like head and shoulders, flags, or triangles can signal entry and exit points. These formations provide visual cues based on historical price behavior, aiding in decision-making. Patterns also help assess market sentiment and volatility, allowing traders to manage risk effectively. By using chart patterns, day traders can enhance their strategies and improve their chances of making profitable trades.
How can you use chart patterns to predict price movements?
To use chart patterns for predicting price movements in day trading, first, identify common patterns like head and shoulders, triangles, and flags on your price charts. Look for clear formations that indicate potential reversals or continuations.
Once you spot a pattern, confirm it with volume trends; increasing volume often validates the pattern's strength. Set entry points at breakout levels, and establish stop-loss orders just below support levels or above resistance to manage risk.
Monitor price action closely after the breakout to confirm the predicted movement. Use these patterns in conjunction with other technical indicators for better accuracy.
What is the difference between bullish and bearish chart patterns?
Bullish chart patterns indicate a potential price increase, signaling traders to buy. Examples include the double bottom and ascending triangle. Bearish chart patterns suggest a possible price decline, prompting traders to sell or short. Examples include the head and shoulders and descending triangle. In day trading, recognizing these patterns helps in making informed entry and exit decisions.
How do you confirm a chart pattern before making a trade?
To confirm a chart pattern before making a trade, look for these key signals:
1. Volume Analysis: Ensure that volume increases when the pattern completes, indicating strong interest.
2. Price Action: Wait for a breakout or breakdown beyond key support or resistance levels.
3. Timeframe Alignment: Check patterns across multiple timeframes for consistency. A pattern on a daily chart supported by a similar one on an hourly chart is more reliable.
4. Indicators: Use technical indicators like RSI or MACD to confirm momentum in the direction of the pattern.
5. Risk Management: Set stop-loss orders based on the pattern’s structure to manage potential losses.
By combining these elements, you can confidently confirm chart patterns and make informed trading decisions.
What role do volume and momentum play in chart patterns?
Volume and momentum are crucial in chart patterns for day trading. Volume indicates the strength of a price movement; high volume during a breakout confirms the pattern's validity. Momentum shows the speed of price changes; strong momentum suggests that the trend will continue. When combined, high volume and momentum can signal potential entry or exit points, helping traders make informed decisions. For example, a bullish flag pattern with increasing volume and upward momentum is a strong buy signal.
How can you combine chart patterns with other indicators?
To combine chart patterns with other indicators in day trading, start by identifying a chart pattern, like a head and shoulders or triangle. Then, use indicators such as moving averages or RSI to confirm the pattern. For example, if you spot a bullish flag pattern, check if the price is above a moving average for added strength. Additionally, look at volume indicators to ensure strong buying or selling pressure aligns with the pattern. This multi-faceted approach enhances your analysis, increasing the probability of successful trades.
What are reversal chart patterns and how do they work?
Reversal chart patterns signal potential trend changes in price movements. Common types include head and shoulders, double tops/bottoms, and triangles.
To use them in day trading, identify the pattern on the chart. For example, a head and shoulders pattern suggests a bearish reversal after an uptrend. Once confirmed, you can enter a trade against the prevailing trend.
Wait for a breakout past the pattern's neckline for confirmation. This helps minimize false signals. Utilize stop-loss orders to manage risk and set profit targets based on the pattern's height. Analyzing volume during these patterns enhances reliability, as increasing volume supports the reversal signal.
How do continuation chart patterns signal ongoing trends?
Continuation chart patterns signal ongoing trends by indicating that the current price movement is likely to continue in the same direction after a brief pause or consolidation. Patterns like flags, pennants, and triangles form as price consolidates, showing indecision among traders. Once the price breaks out of these patterns, it often resumes the previous trend, providing a trading signal. For day traders, recognizing these patterns helps anticipate future moves, allowing them to enter positions aligned with the prevailing trend for potential profit.
What are the risks of relying solely on chart patterns?
Relying solely on chart patterns can lead to several risks:
1. False Signals: Chart patterns can produce misleading signals, resulting in poor trading decisions.
2. Market Conditions: Patterns may not hold in volatile or unpredictable markets, leading to unexpected losses.
3. Lack of Context: Ignoring fundamentals or news events can skew the interpretation of patterns, causing misjudgments.
4. Overfitting: Traders might become too focused on specific patterns and ignore broader market trends.
5. Confirmation Bias: Relying only on patterns can lead to seeing what you want to see, rather than an objective analysis.
In day trading, it's crucial to combine chart patterns with other indicators and market analysis for a well-rounded strategy.
How do you set stop-loss orders based on chart patterns?
To set stop-loss orders based on chart patterns, first identify the pattern you're trading, like a head and shoulders or flag. Place your stop-loss just below the pattern's support level for bullish setups or above the resistance level for bearish setups. For example, if trading a bullish breakout from a triangle, set your stop-loss just below the triangle’s lower trendline. This minimizes losses if the trade goes against you. Adjust the stop-loss as the price moves in your favor to lock in profits. Always consider volatility and your risk tolerance when determining the exact stop-loss level.
Learn about How to set effective stop-loss orders to limit risk
Can chart patterns be applied to all financial markets?
Yes, chart patterns can be applied to all financial markets, including stocks, forex, commodities, and cryptocurrencies. They help traders identify trends and potential reversals, providing insights for day trading analysis. For effective application, focus on market context, confirm patterns with volume, and adapt strategies based on the specific market's behavior.
How does backtesting improve the effectiveness of chart patterns?
Backtesting improves the effectiveness of chart patterns by validating their predictive power with historical data. It allows traders to assess how well specific patterns would have performed in past market conditions. By analyzing results, traders can refine their strategies, optimize entry and exit points, and boost confidence in trading decisions. This process helps identify which patterns are most reliable and under what circumstances, leading to more informed, data-driven trading choices.
What are some common mistakes to avoid when using chart patterns?
1. Ignoring volume: Always check volume to confirm the strength of a chart pattern.
2. Overtrading: Don't jump into trades based on every pattern; wait for confirmation signals.
3. Neglecting stop-losses: Always set a stop-loss to manage risk effectively.
4. Misinterpreting patterns: Ensure you're correctly identifying the pattern; mistakes can lead to losses.
5. Relying solely on patterns: Combine chart patterns with other indicators for better analysis.
6. Failing to adapt: Markets change; adjust your strategies as needed based on market conditions.
7. Emotional trading: Stick to your plan and avoid making impulsive decisions based on fear or greed.
How can beginner traders effectively learn chart patterns?
Beginner traders can effectively learn chart patterns by following these steps:
1. Study Basic Patterns: Start with common patterns like head and shoulders, double tops, and flags. Use resources like books or online courses.
2. Use Charting Software: Familiarize yourself with charting tools that highlight patterns. Practice identifying them on live charts.
3. Practice with Historical Data: Analyze past price movements to see how patterns played out. This builds recognition skills.
4. Join Trading Communities: Engage with other traders in forums or social media groups. Sharing insights helps reinforce learning.
5. Keep a Trading Journal: Document trades based on chart patterns. Reflecting on outcomes helps solidify your understanding.
6. Take Online Courses: Enroll in courses focused on technical analysis and chart patterns for structured learning.
7. Start Paper Trading: Use a demo account to apply what you’ve learned without risking real money. Focus on executing trades based on chart patterns.
By following these steps, beginner traders can build a solid foundation in using chart patterns for day trading analysis.
Conclusion about How to Use Chart Patterns for Day Trading Analysis
Incorporating chart patterns into your day trading strategy can significantly enhance your analysis and decision-making process. By understanding the various types of patterns, identifying them accurately, and confirming them with volume and momentum, traders can improve their prediction of price movements. Additionally, combining chart patterns with other indicators and practicing backtesting can further refine your trading approach. While it's essential to recognize the risks of relying solely on chart patterns, with proper education and experience, beginners can effectively leverage these tools for more informed trading decisions. For comprehensive insights and guidance, consider exploring resources from DayTradingBusiness to deepen your understanding of chart patterns in day trading.
Learn about How to Use Technical Indicators with Day Trading Patterns