Did you know that the average person will spend six months of their life waiting for red lights to turn green? While you’re waiting, you could be mastering trading volume analysis! In this article, we’ll dive into the essentials of trading volume and its critical role in day trading success. You’ll learn what trading volume is, how to measure it, and the tools that can enhance your analysis. We’ll explore the relationship between volume, price movements, and trends, along with identifying spikes and potential reversals. Additionally, we’ll discuss common pitfalls and differences across asset classes, helping you integrate volume analysis with technical indicators for a more robust day trading strategy. Let DayTradingBusiness guide you to effectively leverage volume for improved trading outcomes!
What is trading volume and why is it important for day trading?
Trading volume refers to the number of shares or contracts traded in a security or market during a specific period. It's important for day trading because high trading volume indicates strong interest and liquidity, allowing traders to enter and exit positions quickly without significant price impact. Analyzing volume helps confirm price trends; for example, a price increase accompanied by high volume suggests strong momentum, while low volume may indicate a lack of conviction. Understanding volume patterns can enhance decision-making and improve the chances of successful trades.
How can I measure trading volume effectively?
To measure trading volume effectively, follow these steps:
1. Use Volume Indicators: Apply indicators like On-Balance Volume (OBV) or Volume Moving Average to analyze trends and changes in volume.
2. Check Timeframes: Analyze volume across different timeframes (e.g., 1-minute, 5-minute) to see how it correlates with price movements.
3. Set Volume Thresholds: Establish specific volume thresholds for your trades to confirm entry and exit points.
4. Compare with Historical Data: Look at historical volume data to identify anomalies or patterns that signal potential price movements.
5. Monitor News Impact: Pay attention to news events that can spike volume, which often precedes significant price changes.
6. Use Volume Profiling: Implement volume profile analysis to understand where most trading occurs at different price levels.
Combining these methods will give you a comprehensive view of trading volume, enhancing your day trading success.
What tools are best for analyzing trading volume?
The best tools for analyzing trading volume include:
1. Volume Indicators: Tools like the On-Balance Volume (OBV) and Volume Moving Average help track volume trends relative to price movements.
2. Charting Platforms: Software like TradingView and ThinkorSwim offer customizable charts with volume overlays.
3. Stock Screeners: Websites like Finviz and Yahoo Finance allow you to filter stocks based on volume metrics.
4. Market Depth Tools: Platforms like Level II quotes show real-time buy and sell orders, providing insights into trading volume pressure.
5. Data Analytics Software: Tools like Bloomberg Terminal offer advanced analytics for in-depth volume analysis.
Using these tools effectively can enhance your day trading strategy by providing clear insights into market activity.
How does trading volume impact price movements?
Trading volume significantly impacts price movements by indicating the strength of a price trend. High trading volume often confirms a price movement, suggesting strong interest and conviction among traders. Conversely, low volume might signal a lack of interest, raising the risk of price reversals. For day trading, watching volume spikes can help identify breakout opportunities or trend reversals. Analyzing volume alongside price patterns enhances decision-making, allowing traders to gauge market sentiment effectively. Use tools like volume indicators to track these changes in real-time for better entry and exit points.
What are the key indicators related to trading volume?
Key indicators related to trading volume include:
1. Volume Level: A high volume indicates strong interest in a stock, while low volume suggests weak interest.
2. Price Movement: Analyze how price changes correlate with volume; rising prices on high volume are bullish, while rising prices on low volume can signal a reversal.
3. Volume Trends: Look for increasing or decreasing volume over time to gauge the strength of a price trend.
4. On-Balance Volume (OBV): This indicator combines price and volume to show buying and selling pressure.
5. Accumulation/Distribution Line: This measures the cumulative flow of money into and out of a security, helping identify potential trend reversals.
6. Volume Oscillator: It shows the difference between two volume moving averages, indicating momentum.
7. Average Daily Volume (ADV): Compare current volume to its historical average to assess whether the activity is significant.
These indicators help day traders make informed decisions based on market dynamics.
How can I identify unusual trading volume spikes?
To identify unusual trading volume spikes, monitor stock charts for volume indicators alongside price movement. Look for significant increases in volume compared to the stock's average daily volume over a set period. Use technical analysis tools like moving averages to detect anomalies. Check news sources or social media for events that might explain the spike, such as earnings reports or major announcements. Finally, consider using volume scanners or trading platforms that highlight unusual activity in real-time.
What role does volume play in confirming trends?
Volume confirms trends by indicating the strength of price movements. High volume during an uptrend suggests strong buying interest, validating the trend's direction. Conversely, low volume may signal weakness or a potential reversal. For day trading, analyzing volume helps identify breakout points and assess whether a trend is likely to continue. Always compare volume levels with historical data to gauge significance.
How do I use volume to spot potential reversals?

To use volume for spotting potential reversals, look for significant changes in trading volume alongside price movements. A spike in volume during a price decline can signal a reversal if the price starts to rise afterward. Conversely, if a price increase is accompanied by high volume, it may indicate a strong trend, but a sudden drop in volume could suggest weakening momentum and a potential reversal. Watch for volume patterns near support and resistance levels; increased volume at these points often indicates a change in direction. Always combine volume analysis with other indicators for more reliable signals.
What are the differences between high and low trading volume?
High trading volume indicates strong interest and activity in a security, leading to better liquidity, tighter spreads, and more reliable price movements. It often suggests that a trend is more likely to continue. In contrast, low trading volume signals weak interest, resulting in wider spreads and less predictable price action, making it harder to execute trades effectively. For day trading, high volume helps traders enter and exit positions swiftly, while low volume can lead to slippage and increased risk. Analyzing volume trends can guide decisions on when to buy or sell for optimal results.
How can volume analysis improve my day trading strategy?
Volume analysis enhances your day trading strategy by helping you identify trends and confirm price movements. High volume during an uptrend signals strong buying interest, while high volume in a downtrend indicates selling pressure. Look for volume spikes; they often precede significant price changes. Using volume indicators like the Volume Moving Average or On-Balance Volume (OBV) can provide insights into market strength. Additionally, observing volume alongside price patterns helps confirm breakout or reversal signals, increasing trade accuracy. Incorporating these techniques can lead to more informed decisions and improved trading outcomes.
Learn about How to Use Volume to Improve Day Trading
What is the relationship between volume and volatility?
Volume and volatility are closely related in trading. Higher trading volume often indicates increased interest in a stock, which can lead to greater price volatility. When many traders are buying or selling, price movements tend to be more pronounced. Conversely, low volume can result in less volatility, making price changes smaller and more unpredictable. Analyzing volume helps day traders gauge potential volatility, allowing them to make informed decisions about entry and exit points.
How can I interpret volume trends over time?
To interpret volume trends over time, start by observing the volume bars on a price chart. Look for patterns: increasing volume often indicates strong market interest, while declining volume may suggest weakening momentum. Compare volume spikes with price movements; a price increase on high volume can signal a strong trend, whereas rising prices with low volume might indicate a lack of conviction. Use moving averages to smooth out volume data and identify longer-term trends. Pay attention to volume during key price levels, as high volume at support or resistance can indicate potential reversals. Lastly, consider context; news events or earnings reports can significantly impact volume, so factor those in during your analysis.
What common mistakes should I avoid when analyzing volume?
Avoid these common mistakes when analyzing trading volume:
1. Ignoring Context: Always consider volume in relation to price movements. High volume on a price drop can signal panic selling, while high volume on a rise indicates strong buying interest.
2. Relying Solely on Volume: Don’t use volume in isolation. Combine it with other indicators like price trends and moving averages for a clearer picture.
3. Overlooking Timeframes: Analyze volume across multiple timeframes. A spike on a 5-minute chart may not hold the same significance on a daily chart.
4. Misinterpreting Low Volume: Low volume doesn’t always mean a lack of interest; it can indicate consolidation before a breakout.
5. Neglecting News Impact: Be aware of news events that can skew volume. Sudden spikes can result from external factors rather than genuine market interest.
6. Focusing Only on Absolute Numbers: Percentage changes in volume can be more telling than raw numbers, especially in volatile markets.
Keeping these points in mind will enhance your volume analysis and improve your day trading success.
How do volume patterns differ across various asset classes?
Volume patterns vary significantly across asset classes. In equities, volume spikes often signal news or earnings reports, while consistent volume can indicate strong trends. Forex markets typically show lower volume but higher frequency, with peaks during major economic releases. Futures volume often mirrors underlying asset activity, influenced by market events. Cryptocurrencies exhibit high volatility with erratic volume patterns, often driven by social media trends or market sentiment. Understanding these nuances helps traders gauge market strength and make informed decisions.
What is the significance of volume in breakout trading?
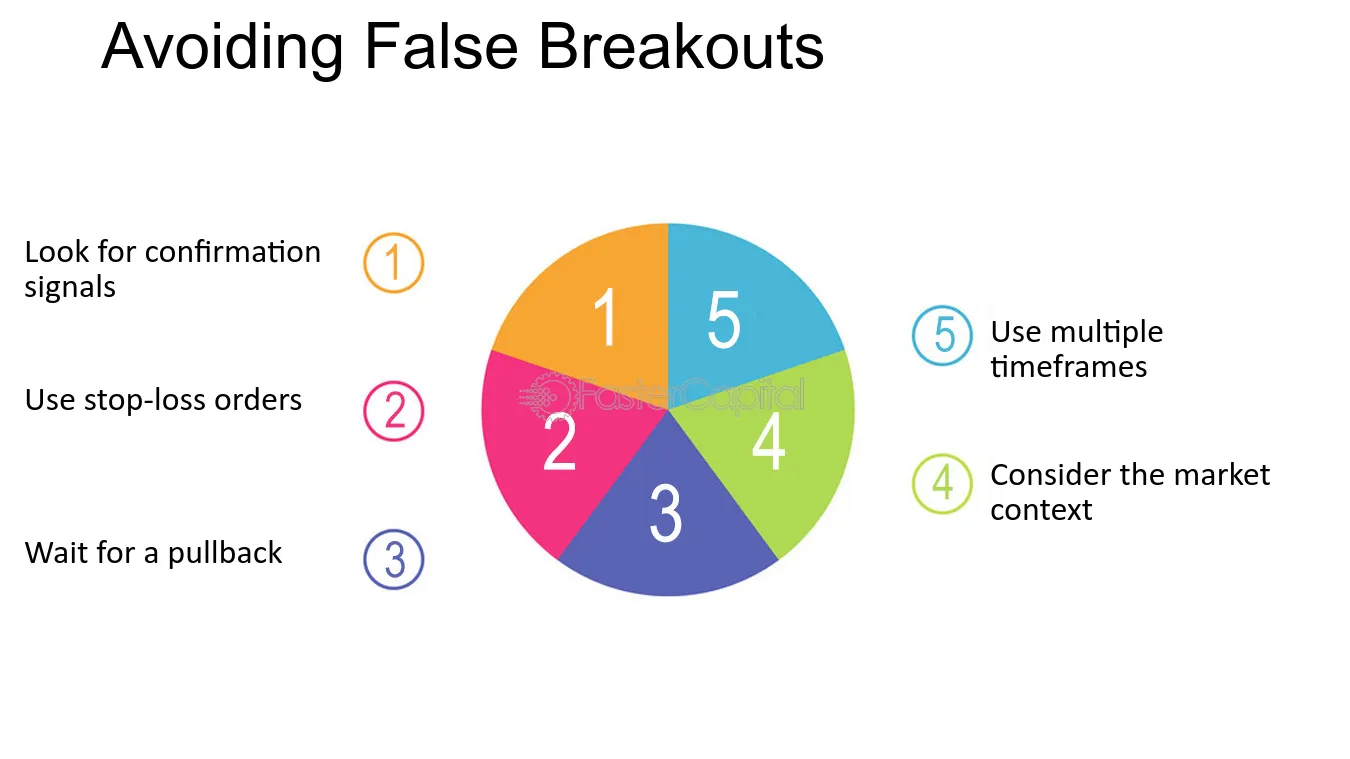
Volume in breakout trading indicates the strength of a price movement. High volume during a breakout suggests strong interest and confirms the trend, while low volume may signal a false breakout. Traders use volume to validate entry points; a breakout accompanied by increased volume is more likely to sustain momentum. Analyzing volume patterns helps identify potential reversals and enhances decision-making in day trading.
How can I integrate volume analysis with technical indicators?
To integrate volume analysis with technical indicators, start by using volume to confirm price movements. For instance, when a stock breaks above resistance with high volume, it signals strength. Combine this with indicators like Moving Averages (MA) or the Relative Strength Index (RSI) to identify trends.
Look for divergences between volume and indicators; for example, if prices rise but volume decreases, it may indicate a reversal. Use the Volume Weighted Average Price (VWAP) to gauge the average price throughout the day, helping to identify entry and exit points.
Always consider volume spikes alongside candlestick patterns for clearer trade signals. This approach enhances your day trading strategy by providing a more comprehensive view of market momentum.
Conclusion about How to Analyze Trading Volume for Day Trading Success
Incorporating trading volume analysis is crucial for day trading success, as it provides insights into market activity and price movements. By effectively measuring and interpreting volume, traders can identify trends, spot reversals, and avoid common pitfalls. Utilizing the right tools and understanding the dynamics of volume across different asset classes enhances your trading strategy. For comprehensive guidance on mastering trading volume, consider leveraging the expertise offered by DayTradingBusiness.
Learn about How to Analyze Market Sentiment for Day Trading Success