Did you know that the average person spends about 90% of their time indoors, while day traders are glued to their screens, analyzing every tick of the market? In the fast-paced world of day trading, understanding key economic indicators is crucial for success. This article dives into the essential metrics that influence trading strategies, including interest rates, unemployment data, and GDP. You'll learn how inflation, consumer spending, and geopolitical events shape market movements, alongside the importance of economic reports and earnings announcements. With practical tips on leveraging economic calendars and combining technical indicators, DayTradingBusiness equips you with the insights needed to navigate the markets effectively.
What are the key economic indicators for day trading?
Key economic indicators for day trading include:
1. Gross Domestic Product (GDP): Reflects overall economic health and can influence market trends.
2. Unemployment Rate: Affects consumer spending and market confidence.
3. Consumer Price Index (CPI): Measures inflation, impacting interest rates and market volatility.
4. Retail Sales: Indicates consumer spending trends, crucial for stocks in the retail sector.
5. Federal Reserve Interest Rate Decisions: Directly impacts borrowing costs and market liquidity.
6. Manufacturing and Services PMI: Signals economic expansion or contraction, affecting stock performance.
7. Jobless Claims: Provides insight into labor market strength, influencing market sentiment.
Monitoring these indicators helps traders make informed decisions and anticipate market movements.
How do interest rates affect day trading strategies?
Interest rates impact day trading strategies by influencing market volatility and liquidity. Higher interest rates often lead to increased volatility, as they can affect stock prices and investor sentiment. Traders may adjust their strategies, focusing on sectors sensitive to interest rate changes, like financials or utilities. Additionally, changes in interest rates can affect margin requirements and borrowing costs, which can alter a trader’s risk management approach. Overall, understanding interest rates helps day traders anticipate market movements and refine their entry and exit points.
Why is unemployment data important for day traders?
Unemployment data is crucial for day traders because it directly impacts market sentiment and economic stability. High unemployment rates can lead to bearish market trends, while low rates often boost investor confidence and stock prices. Traders use this data to anticipate price movements and adjust their strategies accordingly. Additionally, unemployment figures influence Federal Reserve policies, affecting interest rates and market liquidity. Understanding these trends helps day traders make informed decisions and capitalize on short-term market fluctuations.
What role does GDP play in day trading decisions?
GDP influences day trading decisions by providing insights into economic health. A rising GDP often signals growth, leading traders to favor stocks in expanding sectors. Conversely, declining GDP can prompt traders to sell or short positions, anticipating market downturns. Traders also watch GDP reports for volatility, as unexpected results can cause significant price movements. Understanding GDP trends helps day traders align their strategies with market sentiment.
How can inflation rates influence day trading outcomes?
Inflation rates impact day trading outcomes by affecting market volatility and investor sentiment. High inflation often leads to uncertainty, causing stock prices to fluctuate more, which can create trading opportunities. Traders may react to inflation reports, adjusting their strategies based on anticipated interest rate changes from central banks. For instance, rising inflation might prompt a sell-off in growth stocks, while commodities could benefit. Understanding inflation trends helps day traders gauge market direction and manage risk effectively.
What economic reports should day traders monitor?
Day traders should monitor the following economic reports:
1. Non-Farm Payrolls (NFP) – Indicates job growth and economic health.
2. Consumer Price Index (CPI) – Measures inflation and purchasing power.
3. Gross Domestic Product (GDP) – Reflects overall economic performance.
4. Retail Sales – Shows consumer spending trends.
5. Federal Reserve Announcements – Impacts interest rates and market sentiment.
6. Initial Jobless Claims – Signals labor market strength.
7. Manufacturing and Services PMI – Indicates sector performance.
These reports can create volatility and trading opportunities.
How does consumer spending impact day trading?
Consumer spending directly impacts day trading by influencing market trends and stock prices. High consumer spending typically indicates economic growth, leading to rising stock prices, while low spending can signal economic downturns, causing stock prices to fall. Traders often monitor retail sales data and consumer confidence indexes to gauge spending habits, which can inform trading decisions. For example, strong earnings reports from consumer goods companies can lead to bullish market sentiment, presenting day trading opportunities. Understanding these dynamics helps traders capitalize on short-term price movements driven by consumer behavior.
What is the significance of the PMI for day traders?

The PMI, or Purchasing Managers' Index, is significant for day traders because it provides insights into the economic health of the manufacturing and service sectors. A rising PMI indicates expansion, suggesting potential stock price increases, while a falling PMI points to contraction, which can lead to declines. Day traders use PMI reports to anticipate market movements, adjust positions, and capitalize on volatility. Timely PMI data can trigger swift trading opportunities, making it a crucial economic indicator for short-term strategies.
How do earnings reports affect stock prices in day trading?
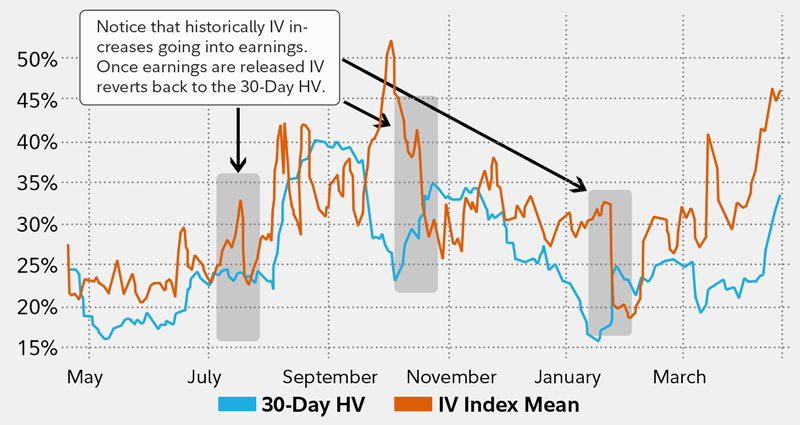
Earnings reports significantly impact stock prices in day trading by influencing investor sentiment. Positive earnings can drive prices up, while negative results often lead to declines. Traders react quickly to these reports, causing volatility. This creates opportunities for day traders to capitalize on price swings. Monitoring earnings announcements helps traders anticipate market movements and make informed decisions.
What are the best sources for economic indicator data?
The best sources for economic indicator data include:
1. Federal Reserve Economic Data (FRED) – Comprehensive database with a wide range of economic indicators.
2. Bureau of Economic Analysis (BEA) – Provides GDP, consumer spending, and income data.
3. Bureau of Labor Statistics (BLS) – Source for employment figures, inflation rates, and wage statistics.
4. Trading Economics – Offers real-time data on various economic indicators globally.
5. Investing.com – Features an economic calendar and indicator data for traders.
6. Bloomberg – Delivers in-depth analysis and real-time data, though it may require a subscription.
7. Yahoo Finance – Accessible data on key economic indicators and market news.
These sources can help you stay informed and make better day trading decisions based on economic trends.
How can geopolitical events impact day trading?
Geopolitical events can significantly impact day trading by causing market volatility and influencing key economic indicators. For instance, news about trade agreements or conflicts can lead to rapid price changes in commodities and currencies. Traders often react to these events, creating opportunities for short-term gains or losses. Additionally, central bank decisions influenced by geopolitical stability can shift interest rates, affecting stock prices. Staying informed about global news is crucial for anticipating market movements and making timely trades.
Learn about How Do SEC Rules Impact Day Trading?
What technical indicators complement economic data for day trading?
Technical indicators that complement economic data for day trading include moving averages, relative strength index (RSI), and Bollinger Bands. Moving averages help identify trends, while RSI indicates overbought or oversold conditions. Bollinger Bands show volatility and potential price reversals. Use these indicators alongside economic reports like employment data, GDP growth, and inflation rates to make informed trading decisions.
How do central bank announcements influence market movements?
Central bank announcements influence market movements by impacting interest rates, monetary policy, and investor sentiment. When a central bank signals a rate change or adjusts its economic outlook, traders react quickly, leading to price shifts in stocks, currencies, and commodities. For example, a surprise rate hike can cause stock prices to drop as borrowing costs rise, while currency values may strengthen. Traders closely monitor these announcements as they provide insights into economic health and future market conditions, making them crucial for day trading success.
What is the relationship between economic indicators and volatility in day trading?
Economic indicators significantly impact volatility in day trading. Key indicators like GDP growth, unemployment rates, and inflation can cause sharp price movements. For instance, a surprising jobs report may lead to rapid fluctuations in stock prices as traders react. High volatility often presents opportunities for day traders to capitalize on price swings. Conversely, stable economic conditions typically result in lower volatility, making it harder to profit from quick trades. Understanding these indicators helps traders anticipate market reactions and adjust their strategies accordingly.
How can traders use economic calendars effectively?
Traders can use economic calendars effectively by focusing on key economic indicators like GDP, unemployment rates, and interest rate decisions. Monitor the calendar for scheduled releases and adjust trading strategies based on expected market impact. For instance, anticipate volatility around major announcements and position trades accordingly. Use the data to identify trends and potential reversals, aligning trades with market sentiment. Always check the previous figures and analyst forecasts to gauge market reactions.
What strategies can help traders react to economic news releases?
Traders can use several strategies to effectively react to economic news releases:
1. Pre-release Analysis: Research key economic indicators such as GDP, unemployment rates, and inflation figures ahead of time to understand potential market impacts.
2. Economic Calendar: Follow an economic calendar to stay updated on upcoming releases, ensuring you're prepared for volatility.
3. Market Sentiment: Monitor market sentiment through social media and news outlets to gauge trader reactions and adjust your strategy accordingly.
4. Technical Analysis: Use technical indicators to identify entry and exit points before and after news releases, helping to capitalize on price movements.
5. Risk Management: Set stop-loss orders before the news is released to protect against unexpected market swings.
6. Post-release Reaction: Watch how the market reacts immediately after the release, as initial moves may indicate the prevailing trend.
7. Practice and Simulations: Use demo accounts to practice trading around economic releases, helping to refine your response strategies without financial risk.
Implementing these strategies can enhance your ability to react effectively to economic news releases.
Conclusion about Key Economic Indicators for Day Trading Success
Understanding key economic indicators is crucial for day trading success. By closely monitoring interest rates, unemployment data, GDP, inflation rates, and other relevant reports, traders can make informed decisions that align with market movements. Additionally, recognizing the impact of consumer spending, PMI, earnings reports, and geopolitical events can further enhance trading strategies. Utilizing economic calendars and combining these insights with technical indicators allows traders to respond effectively to market fluctuations. For comprehensive guidance on leveraging these indicators, DayTradingBusiness provides valuable resources to help traders navigate the complexities of the market.
Learn about Key Indicators for Day Trading Success