Did you know that even the most seasoned day traders can sometimes mistake a stock's earnings report for a piece of abstract art? It’s all about interpretation! This article dives into the essentials of creating a fundamental analysis report specifically tailored for day trading. You’ll learn what a fundamental analysis report entails and why it’s crucial for making informed trading decisions. We’ll guide you through gathering relevant data, assessing key financial statements, and evaluating earnings reports. Additionally, we’ll explore the significance of economic indicators, market sentiment, and valuation metrics, such as price-to-earnings ratios and dividend yield. With insights on integrating technical analysis and tips on avoiding common pitfalls, this comprehensive guide from DayTradingBusiness is your roadmap to mastering fundamental analysis in the fast-paced world of day trading.
What is a fundamental analysis report for day trading?
A fundamental analysis report for day trading evaluates a stock's intrinsic value based on factors like earnings, revenue, news, and economic indicators. To create one, follow these steps:
1. Company Overview: Summarize the business, including industry, products, and market position.
2. Financial Metrics: Analyze key ratios like P/E, debt-to-equity, and earnings growth.
3. Recent News: Highlight any significant news that could impact stock performance, such as earnings reports or regulatory changes.
4. Market Sentiment: Assess overall market trends and investor sentiment using social media and news sources.
5. Economic Indicators: Include relevant economic data that may affect the stock, like interest rates and unemployment rates.
Keep the report concise and focused on actionable insights to guide your trading decisions.
Why is fundamental analysis important for day trading?
Fundamental analysis is important for day trading because it helps traders assess a stock's intrinsic value and identify potential price movements based on economic indicators, earnings reports, and industry trends. By evaluating a company's financial health and market conditions, traders can make informed decisions, anticipate market reactions, and spot opportunities for quick profits. A solid fundamental analysis report includes key metrics like earnings per share (EPS), revenue growth, and news events that could impact stock prices, enabling traders to act swiftly and effectively.
How do I gather data for a fundamental analysis report?
To gather data for a fundamental analysis report in day trading, follow these steps:
1. Identify Key Metrics: Focus on earnings per share (EPS), price-to-earnings (P/E) ratio, and revenue growth.
2. Use Financial Statements: Access the company’s income statement, balance sheet, and cash flow statement from sources like SEC filings or financial news websites.
3. Review Analyst Reports: Check insights from analysts on platforms like Yahoo Finance or Bloomberg.
4. Monitor Economic Indicators: Keep an eye on interest rates, inflation, and employment data that can impact market sentiment.
5. Follow News and Events: Track relevant news, earnings reports, and company announcements through financial news outlets.
6. Utilize Financial Tools: Use stock screening tools and financial analysis software to aggregate and analyze data quickly.
7. Compare with Peers: Benchmark the company against competitors to assess relative performance and market position.
Collecting this data will provide a solid foundation for your fundamental analysis report.
What key financial statements should I analyze?
Analyze the income statement, balance sheet, and cash flow statement. The income statement reveals profitability, the balance sheet shows assets and liabilities, and the cash flow statement provides insight into cash management. Focus on revenue growth, net income, debt levels, and operating cash flow for a comprehensive view.
How do I evaluate a company's earnings reports?
To evaluate a company's earnings reports for day trading, follow these steps:
1. Look at Earnings Per Share (EPS): Compare the actual EPS to analysts' expectations and previous quarters to gauge performance.
2. Analyze Revenue Growth: Check if revenue is increasing and how it stacks up against forecasts.
3. Review Guidance: Pay attention to future earnings guidance provided by the company and how it aligns with market expectations.
4. Examine Profit Margins: Evaluate gross, operating, and net profit margins to understand efficiency and cost management.
5. Check for One-Time Items: Identify any non-recurring items that could skew results, like asset sales or restructuring costs.
6. Consider the Overall Market Reaction: Observe how the stock price reacts post-report to assess market sentiment.
7. Look at Key Ratios: Analyze P/E ratio, PEG ratio, and other relevant metrics to evaluate valuation in context.
By focusing on these elements, you can gain insights into a company's financial health and make informed trading decisions.
What role do economic indicators play in day trading?
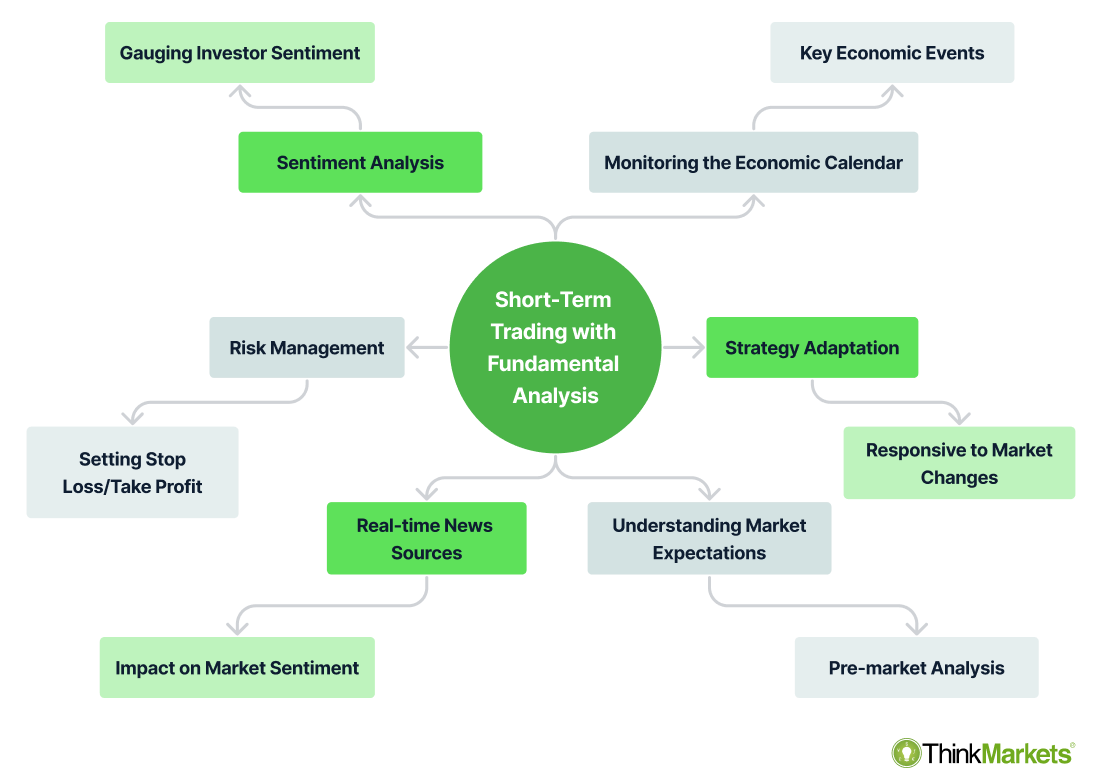
Economic indicators are crucial for day trading as they provide insights into market trends and potential price movements. Indicators like GDP growth, unemployment rates, and inflation can signal economic health, affecting stock prices. Traders analyze these metrics to gauge market sentiment, anticipate volatility, and make informed decisions. For a fundamental analysis report, include key indicators relevant to your assets, recent trends, and how they impact sectors or individual stocks. This helps identify trading opportunities and manage risks effectively.
How can I assess market sentiment in my analysis?
To assess market sentiment in your fundamental analysis report for day trading, monitor news headlines, social media trends, and analyst ratings. Use sentiment analysis tools to gauge public opinion on stocks. Track economic indicators like interest rates and employment data, as they influence investor mood. Analyze trading volume and price movements; rising prices with high volume can indicate bullish sentiment. Additionally, check for unusual options activity, which can signal investor expectations. Lastly, consider sentiment surveys like the AAII Investor Sentiment Survey for a broader perspective.
What are the common valuation metrics for day trading?
Common valuation metrics for day trading include:
1. Price-to-Earnings (P/E) Ratio: Indicates how much investors are willing to pay per dollar of earnings.
2. Price-to-Book (P/B) Ratio: Compares a company's market value to its book value, useful for assessing undervaluation.
3. Earnings per Share (EPS): Shows a company’s profitability on a per-share basis, critical for understanding performance.
4. Debt-to-Equity Ratio: Measures financial leverage and risk by comparing total liabilities to shareholders' equity.
5. Return on Equity (ROE): Indicates how effectively a company uses equity to generate profit, essential for assessing efficiency.
6. Price-to-Sales (P/S) Ratio: Compares a company's stock price to its revenues, helping evaluate valuation relative to sales.
7. Volume: High trading volume can signal strong interest and potential price movements, key for day trading decisions.
These metrics help day traders analyze stocks quickly and make informed buy or sell decisions.
How do I interpret price-to-earnings ratios?
To interpret price-to-earnings (P/E) ratios, compare a company's P/E to its historical values and industry averages. A high P/E may indicate overvaluation or growth expectations, while a low P/E could suggest undervaluation or poor prospects. Look for trends; if a company's P/E is increasing, it may signal investor confidence. Use P/E alongside other metrics like earnings growth and debt levels for a comprehensive analysis. In day trading, focus on how P/E changes can influence price movements in the short term.
What is the significance of dividend yield in trading?
Dividend yield is significant in trading because it helps investors assess the income potential of a stock relative to its price. A higher dividend yield indicates a better return on investment for shareholders, making the stock more attractive, especially for income-focused traders. It can also signal a company's financial health; consistent or increasing dividends often reflect strong cash flow. In fundamental analysis for day trading, evaluating dividend yield alongside other metrics like earnings growth and P/E ratio can guide decision-making and risk assessment.
How can news impact fundamental analysis?
News can significantly impact fundamental analysis by influencing a company's stock price, earnings forecasts, and overall market sentiment. For day trading, incorporating news events into your fundamental analysis report is crucial. Key areas to focus on include:
1. Earnings Reports: Analyze how quarterly earnings results affect stock valuations.
2. Economic Indicators: Monitor data like GDP, unemployment rates, and inflation, as these can sway market conditions.
3. Company Announcements: Pay attention to product launches, mergers, or management changes, which can alter a company’s outlook.
4. Market Sentiment: Assess how news affects investor behavior and sentiment towards particular sectors or stocks.
Integrating this information helps refine your analysis and improve trading decisions.
What tools can I use for fundamental analysis?
For fundamental analysis in day trading, use these tools:
1. Financial News Websites: Bloomberg, Reuters, and CNBC for real-time news and market insights.
2. Stock Screeners: Finviz, Yahoo Finance, and Morningstar to filter stocks based on financial metrics.
3. Earnings Calendars: EarningsWhispers and Nasdaq for tracking upcoming earnings reports.
4. Company Financials: SEC’s EDGAR database for accessing detailed financial statements.
5. Analyst Reports: Seeking Alpha and Zacks for expert analyses and stock ratings.
6. Economic Indicators: Trading Economics and Federal Reserve Economic Data (FRED) for macroeconomic data.
These tools will help you gather and analyze the necessary data for a solid fundamental analysis report.
How often should I update my fundamental analysis report?
You should update your fundamental analysis report at least weekly. However, if there are significant market events, earnings releases, or economic data changes, update it immediately. Staying current ensures your day trading strategies align with the latest information.
What are the pitfalls to avoid in fundamental analysis?
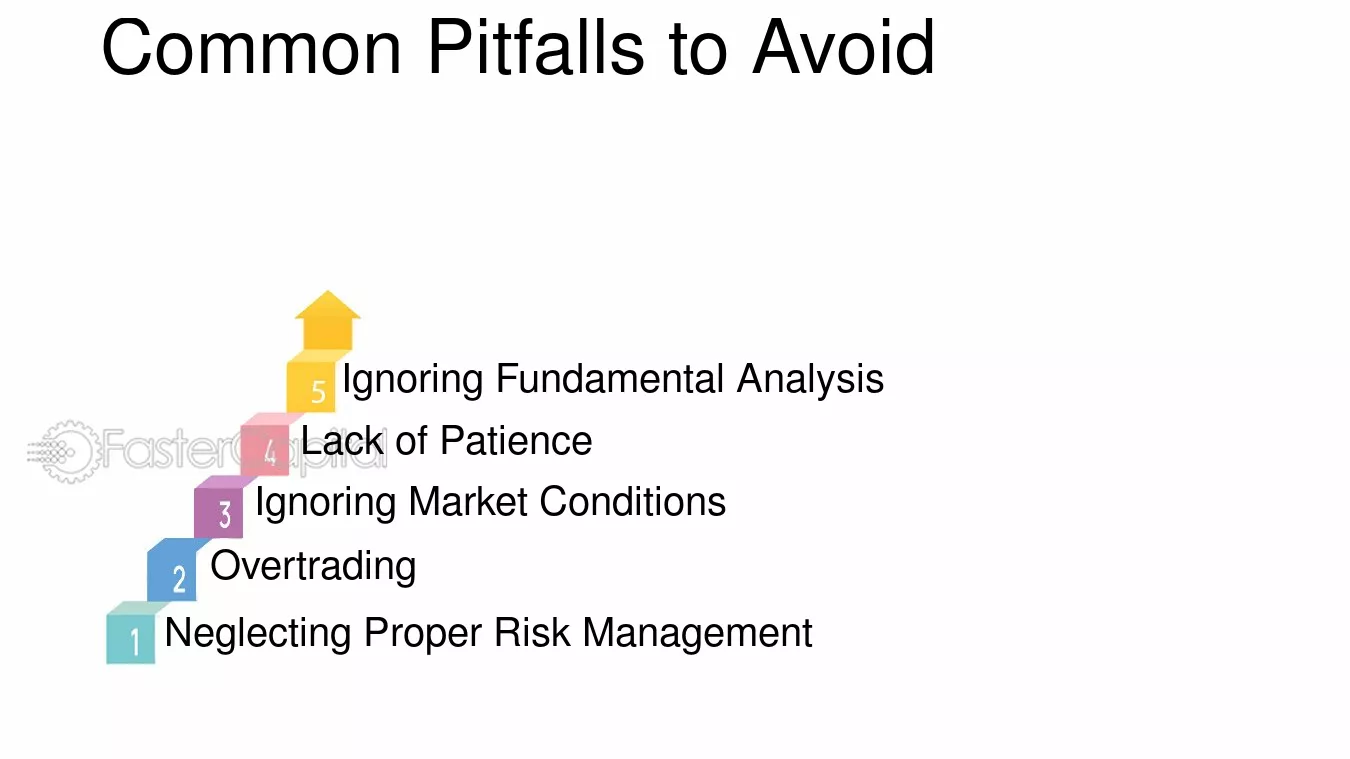
1. Ignoring Financial Ratios: Don’t overlook key ratios like P/E, debt-to-equity, and ROE; they provide crucial insights.
2. Focusing Solely on Recent Data: Relying only on the latest earnings report can mislead. Consider historical performance and trends.
3. Neglecting Market Context: Failing to analyze the broader economic environment can result in poor decisions. Understand how macroeconomic factors affect your stocks.
4. Overestimating Projections: Be cautious with overly optimistic growth forecasts. Base your analysis on realistic expectations.
5. Disregarding Management Quality: A strong company can falter under poor leadership. Research management backgrounds and track records.
6. Skipping Industry Comparisons: Evaluate companies within their industry. Context helps clarify performance and potential.
7. Not Considering Sentiment: Market psychology can drive short-term price movements. Pay attention to news and market sentiment.
8. Underestimating Risks: Be aware of risks like regulatory changes or competitive pressures. A thorough risk assessment is essential.
9. Lack of Diversification: Don’t put all your capital into one stock based on fundamental analysis. Spread your investments to mitigate risk.
10. Ignoring Technical Analysis: Combine fundamentals with technical indicators for a well-rounded view. This can enhance entry and exit strategies in day trading.
How can I integrate technical analysis with fundamental analysis?
To integrate technical analysis with fundamental analysis for day trading, start by identifying key fundamentals like earnings reports, economic indicators, or news events that impact stock prices. Use this information to select stocks with strong potential.
Next, apply technical analysis by examining charts, trends, and indicators such as moving averages or RSI to time your entry and exit points. Look for technical setups that align with fundamental insights—like buying a stock after a positive earnings report when the price is breaking out of resistance.
Combine these approaches by using fundamental analysis to filter stocks and technical analysis to execute trades effectively. This synergy helps you make informed decisions based on both market sentiment and underlying business performance.
Learn about How Do Institutional Traders Use Technical and Fundamental Analysis?
What are some examples of successful fundamental analysis reports?
1. Apple Inc. (AAPL): A report might analyze revenue growth, profit margins, and product innovation, highlighting how these factors influence stock performance.
2. Tesla Inc. (TSLA): Focus on production numbers, market expansion, and competitive landscape, demonstrating the impact of these elements on valuation and trading decisions.
3. Amazon.com Inc. (AMZN): Examine e-commerce growth, AWS profitability, and market trends, providing insights into how these metrics affect short-term trading strategies.
4. NVIDIA Corporation (NVDA): Assess earnings reports, industry demand for GPUs, and R&D investments to illustrate potential price movements relevant to day trading.
5. Netflix Inc. (NFLX): Analyze subscriber growth, content spending, and churn rates, connecting these factors to stock volatility and trading opportunities.
Each report should include data interpretation, key metrics, and actionable insights tailored for day trading.
Conclusion about How to Create a Fundamental Analysis Report for Day Trading
Incorporating fundamental analysis into your day trading strategy is essential for making informed decisions. By gathering relevant data, evaluating key financial statements, and understanding market sentiment and economic indicators, you can create a comprehensive report that enhances your trading performance. Remember to regularly update your analysis and consider integrating technical indicators for a well-rounded approach. With the right tools and knowledge, you can navigate the complexities of the market effectively. For more insights and support, look to DayTradingBusiness as your trusted resource in the world of trading.
Learn about How to Create a Day Trading Analysis Checklist