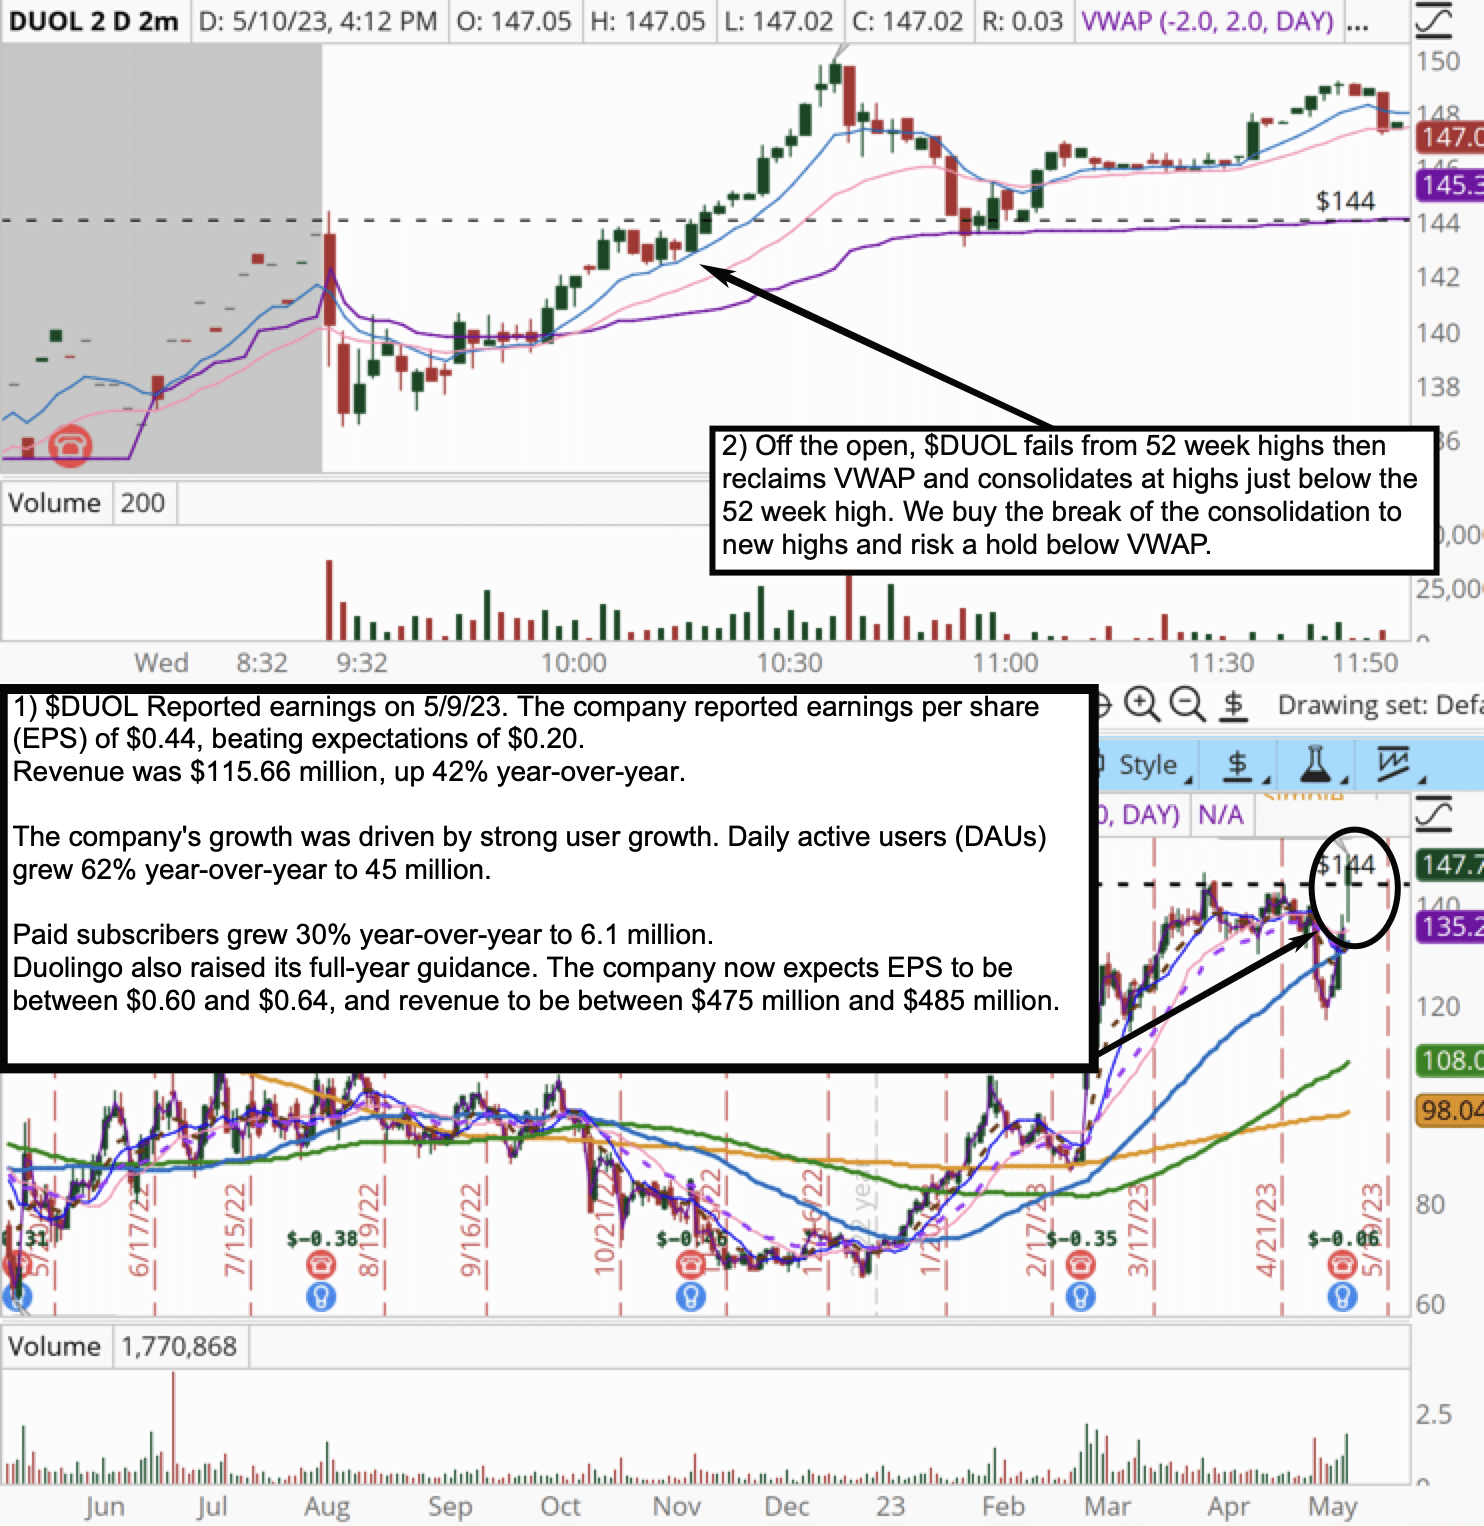
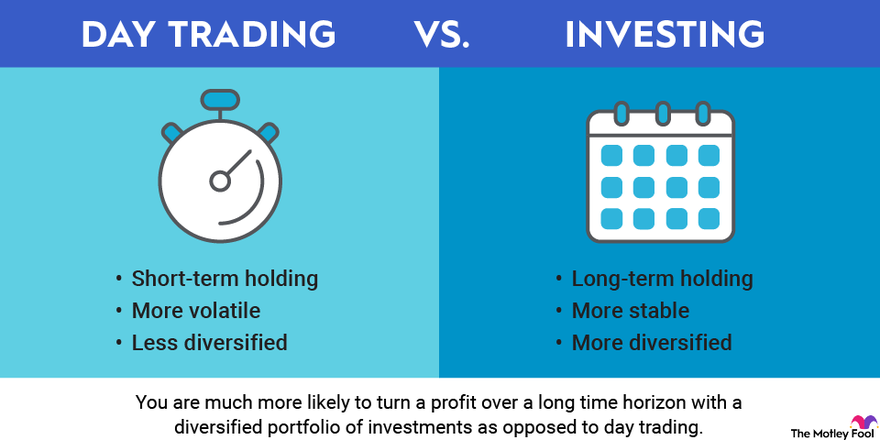
Did you know that the average day trader spends over 10 hours a week analyzing charts, which is longer than it takes to binge-watch an entire season of a TV show? In the world of day trading, understanding essential metrics is crucial for maximizing profits and minimizing risks. This article dives into the key metrics for day trading analysis, including calculating win rates, the significance of risk-reward ratios, and the impact of volatility on strategies. Explore how to assess performance through trading volume, average trade duration, and profit factors, while also learning to track drawdowns and analyze mistakes. With insights from DayTradingBusiness, you'll gain the tools needed for consistent success and effective measurement of your trading metrics.
What are the key metrics for day trading analysis?
The key metrics for day trading analysis include:
1. Profit and Loss (P&L): Measures overall gains or losses from trades.
2. Win Rate: Percentage of trades that are profitable.
3. Risk-Reward Ratio: Compares potential profit to potential loss in trades.
4. Average Trade Duration: Time spent in each trade.
5. Volume: Number of shares traded, indicating liquidity.
6. Volatility: Price fluctuations of the asset, impacting trade opportunities.
7. Sharpe Ratio: Adjusts returns for risk, showing performance relative to volatility.
8. Maximum Drawdown: Largest loss from a peak to a trough during a trading period.
These metrics help assess performance and refine trading strategies.
How do you calculate the win rate in day trading?
To calculate the win rate in day trading, divide the number of winning trades by the total number of trades, then multiply by 100 to get a percentage.
Win Rate (%) = (Winning Trades / Total Trades) × 100
For example, if you made 50 trades and 30 were winners, your win rate would be (30/50) × 100 = 60%.
What is the importance of risk-reward ratio in day trading?
The risk-reward ratio is crucial in day trading because it helps traders assess potential profit against possible loss. A favorable ratio, typically 1:2 or higher, means that the potential reward outweighs the risk. This guides decision-making, ensuring that even with a lower win rate, a trader can be profitable over time. It also encourages discipline, preventing impulsive trades that don’t align with a trader’s strategy. Ultimately, a solid risk-reward ratio protects capital and enhances long-term success.
How can I use volatility in day trading strategies?
To use volatility in day trading strategies, focus on these key metrics:
1. Average True Range (ATR): Measure market volatility by tracking price movement over a specific period. Use ATR to set stop-loss orders and identify entry points.
2. Bollinger Bands: Use these to visualize volatility. When the bands widen, volatility increases; when they contract, it decreases. Trade breakouts when the price moves outside the bands.
3. Volume Analysis: High trading volume often accompanies volatility. Look for spikes in volume to confirm price movements and trends.
4. Volatility Index (VIX): Monitor the VIX for overall market sentiment. A rising VIX indicates increased market volatility, which can signal potential trading opportunities.
5. News Catalysts: Pay attention to news events that can cause sudden volatility. Trade around earnings reports or economic data releases for potential quick gains.
Incorporate these metrics into your trading plan to capitalize on price swings and manage risk effectively.
What metrics help assess day trading performance?
Key metrics to assess day trading performance include:
1. Win Rate: The percentage of trades that are profitable.
2. Risk-Reward Ratio: The average profit per winning trade compared to the average loss per losing trade.
3. Average Trade Duration: The average time a trade is held, indicating efficiency.
4. Total Return: The overall profit or loss over a specific period.
5. Maximum Drawdown: The largest drop from a peak to a trough, showing risk exposure.
6. Sharpe Ratio: Measures return per unit of risk, helping to understand risk-adjusted performance.
7. Trade Volume: The number of trades executed, reflecting activity level.
Using these metrics can provide a comprehensive view of day trading effectiveness.
How do you measure average trade duration in day trading?
To measure average trade duration in day trading, follow these steps:
1. Track each trade's entry and exit times.
2. Calculate the duration of each trade by subtracting the entry time from the exit time.
3. Sum all trade durations.
4. Divide the total duration by the number of trades executed.
This gives you the average trade duration, helping analyze your trading strategy's efficiency.
What is the significance of trading volume in day trading?
Trading volume is crucial in day trading because it indicates the number of shares or contracts traded in a specific period. High trading volume often signals strong interest in a stock, leading to better liquidity and tighter spreads. It helps traders confirm trends; for example, rising prices with increasing volume suggest a strong upward trend. Conversely, low volume during price movements can indicate weakness, making it riskier to enter trades. In essence, monitoring trading volume aids in making informed decisions and managing risk effectively.
How do slippage and commissions impact day trading profits?

Slippage and commissions directly reduce day trading profits. Slippage occurs when a trade is executed at a different price than expected, often due to market volatility. This can lead to lower gains or increased losses on trades. Commissions, the fees charged per trade, cut into profits as well. High commission rates can quickly erode earnings, especially on frequent trades typical in day trading. To maximize profits, traders should minimize slippage through careful order placement and choose brokers with low commission rates.
What role does profit factor play in day trading?
Profit factor in day trading measures the relationship between total profits and total losses. A profit factor greater than 1 indicates that profits outweigh losses, which is essential for long-term success. It helps traders assess the effectiveness of their strategies, guiding decisions on risk management and trade selection. A higher profit factor suggests a more robust trading system, while a lower one indicates the need for strategy adjustments.
How can I track drawdown in my day trading?
To track drawdown in day trading, calculate the maximum decline in your trading account from a peak to a trough. Use these steps:
1. Monitor Account Balance: Keep a daily log of your account balance after each trade.
2. Identify Peaks: Note the highest account balance before a decline starts.
3. Calculate Drawdown: Subtract the lowest balance during the decline from the peak balance. Divide this number by the peak balance and multiply by 100 to get the percentage drawdown.
4. Use Tracking Tools: Utilize trading software or spreadsheets that automatically calculate drawdown metrics.
5. Review Regularly: Analyze drawdown periods to refine your strategies and risk management.
Regular tracking helps you understand risk and improve trading performance.
What is the average profit per trade in day trading?

The average profit per trade in day trading typically ranges from $50 to $200, depending on the trader’s strategy and market conditions. Successful traders often aim for at least a 1:2 risk-to-reward ratio, meaning for every dollar risked, they target two dollars in profit. Factors like stock volatility and trading frequency also impact this average.
How can I analyze my trading mistakes using metrics?
To analyze your trading mistakes using metrics, focus on these essential metrics:
1. Win Rate: Calculate the percentage of profitable trades. A low win rate may indicate poor entry or exit strategies.
2. Risk-Reward Ratio: Assess the potential profit versus the potential loss for each trade. A ratio below 1:2 suggests you might be risking too much for too little reward.
3. Average Trade Duration: Track how long you hold positions. If trades are too short or too long, it may signal misjudgment in market conditions.
4. Maximum Drawdown: Measure the largest drop from a peak to a trough in your trading account. High drawdowns indicate poor risk management.
5. Profit Factor: Calculate total profits divided by total losses. A profit factor below 1 means you're losing more than you're making.
6. Trade Frequency: Review how often you trade. Overtrading can lead to mistakes; aim for quality over quantity.
7. Emotional Factors: Keep a journal noting your emotions during trades. Metrics like impulse trades or revenge trades can highlight emotional triggers.
By tracking these metrics, you can pinpoint specific areas for improvement and adjust your trading strategy accordingly.
Learn about How to Analyze Historical Data Using Day Trading Charts
Why is it important to monitor execution speed in day trading?
Monitoring execution speed in day trading is crucial because it directly affects your ability to capitalize on market opportunities. Fast execution means you can enter and exit trades at the desired price, minimizing slippage and maximizing profits. Delays can lead to missed trades or worse prices, eroding your potential gains. Additionally, in a volatile market, rapid execution helps you manage risk effectively, allowing for quick stop-loss adjustments. Overall, tracking execution speed is essential for maintaining a competitive edge and optimizing trading performance.
What metrics should I review for consistent day trading success?
For consistent day trading success, review these key metrics:
1. Win Rate: The percentage of successful trades. Aim for a win rate above 50%.
2. Risk-Reward Ratio: Compare potential profit to potential loss on trades; a ratio of 2:1 is often ideal.
3. Average Profit and Loss: Track your average gains and losses per trade to assess overall performance.
4. Trade Frequency: Monitor how many trades you execute daily to ensure you're active without overtrading.
5. Sharpe Ratio: Measure risk-adjusted returns; a higher Sharpe ratio indicates better risk management.
6. Drawdown: Evaluate the largest drop from a peak to gauge risk tolerance and capital preservation.
7. Execution Speed: Time taken to enter and exit trades can impact profitability; aim for quick execution.
Regularly analyze these metrics to refine your strategy and enhance trading performance.
How does market sentiment affect day trading analysis?
Market sentiment significantly influences day trading analysis by shaping price movements and volatility. Traders often gauge sentiment through indicators like the Fear and Greed Index, social media trends, and news sentiment analysis. Positive sentiment can drive prices up, while negative sentiment may lead to declines. Understanding sentiment helps day traders make informed decisions on entry and exit points, manage risk, and capitalize on short-term trends.
Learn about How Does Market Microstructure Affect Day Trading Strategies?
What tools can help me measure day trading metrics effectively?

To measure day trading metrics effectively, use these tools:
1. Trading Platforms: Platforms like Thinkorswim and TradeStation offer built-in analytics for tracking performance metrics.
2. Brokerage Tools: Many brokerages, such as Interactive Brokers and Charles Schwab, provide detailed reports on trades, fees, and profits.
3. Spreadsheet Software: Excel or Google Sheets are excellent for custom metrics tracking and performance analysis.
4. Market Scanners: Tools like Finviz or Trade Ideas help identify stocks based on specific metrics like volume and volatility.
5. Risk Management Tools: Apps like TraderVue allow you to analyze risk-reward ratios and manage stop-loss levels effectively.
6. Performance Tracking Software: Tools like Edgewonk or Trademetria help you log trades and analyze patterns over time.
Using these tools will enhance your ability to assess day trading metrics.
Conclusion about Essential Metrics for Day Trading Analysis
In conclusion, understanding essential metrics for day trading—such as win rate, risk-reward ratio, and trading volume—is crucial for refining your trading strategies and improving performance. By calculating average trade duration, monitoring slippage, and assessing drawdown, traders can gain valuable insights into their operations. Utilizing tools to track these metrics enables better decision-making and enhances overall profitability. For comprehensive support in navigating these metrics, DayTradingBusiness offers valuable resources and guidance.
Learn about Essential Tools for Order Flow Analysis in Day Trading