Did you know that even the best traders can misread a chart as easily as mistaking a banana for a phone? In the fast-paced world of day trading, optimizing your charts is crucial for making informed decisions. This article dives into essential strategies for enhancing clarity, selecting the right indicators, and setting up your charts for rapid analysis. Discover effective timeframes, customization tips, and common patterns to recognize, all while learning to reduce clutter and choose color schemes that spotlight trends. We’ll also cover how to automate alerts, incorporate volume data, backtest setups, and avoid pitfalls that can lead to false signals. Get ready to elevate your trading game with insights from DayTradingBusiness!
How can I improve the clarity of my trading charts?
Use clear, contrasting colors for different indicators. Keep the chart simple—avoid clutter with too many lines or tools. Adjust timeframes to match your trading style, like 1-minute for scalping or daily for longer trades. Add only the most relevant indicators, like moving averages or RSI, to avoid confusion. Use consistent chart layouts and zoom levels. Label key levels and patterns clearly. Regularly review and tweak your chart setup based on what helps you spot trades faster.
What are the best indicators for day trading charts?
Best indicators for day trading charts include Moving Averages for trend direction, RSI for overbought or oversold conditions, MACD for momentum shifts, Bollinger Bands for volatility, and Volume to confirm price moves. Use these together to identify entry and exit points quickly.
How do I set up my charts for quick decision-making?
Use clear, relevant indicators like moving averages and RSI to spot trends fast. Keep your chart layout simple—limit indicators to avoid clutter. Set customizable alert levels for key price points. Use timeframes suited to your strategy, like 1-minute or 5-minute charts. Customize colors for quick visual cues. Save chart templates to switch quickly between setups. Regularly review and adjust your chart setups based on performance.
Which chart timeframes are most effective for day trading?
The most effective chart timeframes for day trading are 1-minute, 5-minute, and 15-minute charts. These provide quick signals and help spot entry and exit points accurately. Use the 1-minute chart for precise timing, the 5-minute for trend confirmation, and the 15-minute for broader trend context. Combining these timeframes improves decision-making and reduces false signals.
How can I customize my charts for better analysis?
Add technical indicators like RSI, MACD, or Bollinger Bands to spot trends and reversals. Use multiple time frames—daily, hourly, and minute charts—to get a clearer picture. Customize your chart colors and gridlines for quick readability. Mark support and resistance levels directly on the chart. Incorporate volume data to confirm price movements. Adjust chart types—candlestick, line, or bar—to match your analysis style. Set alerts for key price levels to stay reactive. Keep your layout clean, focusing on the most relevant data to improve decision-making.
What are common chart patterns to recognize in day trading?
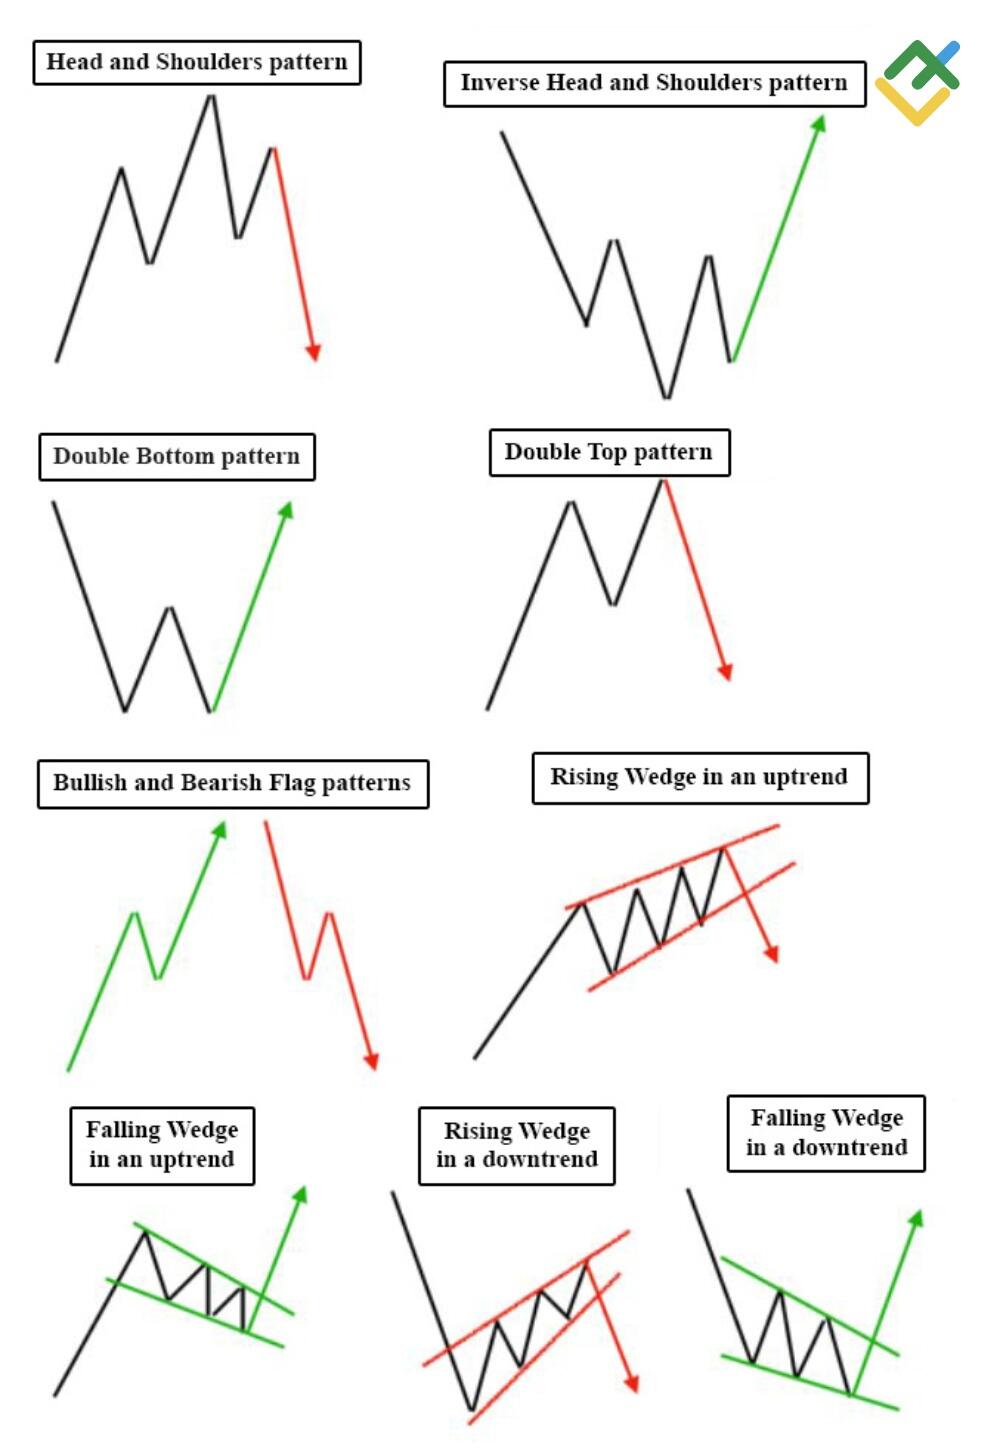
Common chart patterns in day trading include head and shoulders, double tops and bottoms, flags, pennants, triangles, and wedges. These patterns signal potential reversals or continuations, helping traders spot entry and exit points quickly. Recognizing these patterns on your charts improves decision-making and boosts trading performance.
How do I reduce chart clutter for clearer signals?
Remove unnecessary indicators, keep only essential ones like volume or moving averages. Use clean, simple chart layouts with minimal colors and gridlines. Focus on key timeframes that match your trading style; avoid overcrowding with multiple timeframes. Adjust chart zoom so signals stand out without extra noise. Regularly delete outdated or unused annotations and patterns. Use alerts for critical levels instead of cluttering the chart with too many lines.
What color schemes help identify trends faster?
Bright, high-contrast color schemes like green for gains and red for losses make trend shifts stand out instantly. Using bold, distinct colors for support and resistance levels helps spot breakouts quickly. Cool tones for background with vibrant accents for key indicators improve visual clarity. Color gradients that show momentum or volume changes can reveal trend strength faster. Simpler palettes with minimal clutter help your eyes catch important trend signals without distraction.
How can I automate chart alerts for key signals?
Use trading platform alerts to set specific key signal notifications—like price levels or indicator crosses. Connect these alerts with automation tools or scripts, such as TradingView alerts or custom scripts in platforms like MetaTrader. Set up webhook integrations or use services like Zapier to trigger actions—emails, SMS, or trade executions—when signals occur. This way, your chart alerts automatically notify or act on key signals without manual monitoring.
What tools can enhance my chart analysis?
Use TradingView for advanced charting and real-time data. Incorporate technical analysis tools like RSI, MACD, and Bollinger Bands. Apply customizable indicators and overlays to spot trends quickly. Use drawing tools for trendlines, support, and resistance. Enable multiple timeframes to get a full market picture. Consider chart pattern recognition software for automating pattern detection. Lastly, backtest strategies directly on your charts to refine entries and exits.
How do I incorporate volume data into my charts?
Add volume data by overlaying a volume histogram below your price chart. Use a separate axis for volume so it doesn’t skew price movements. Most trading platforms let you enable volume indicators in chart settings. Adjust the color and scale for clarity—green for rising volume, red for falling. This helps identify trading activity spikes and confirms price trends, making your charts more informative for day trading.
What is the best way to backtest my chart setups?
Use historical data to simulate your chart setups, applying your entry and exit rules to see how they perform over different market conditions. Automate the process with backtesting software like TradingView or MetaTrader, and analyze key metrics like win rate, profit factor, and drawdown. Keep your data recent and test across multiple timeframes to ensure robustness. Review the trades to identify patterns, strengths, and weaknesses in your setups.
How do I avoid false signals on my charts?
Use multiple indicators to confirm signals, not just one. Adjust timeframes to filter out noise and focus on clearer trends. Avoid overloading charts with indicators—stick to 2-3 key tools. Confirm signals with price action and volume, not just indicator reads. Regularly backtest your setup to identify false signals. Keep your charts clean, and stay disciplined by waiting for strong, confirmed entries.
How often should I update my chart settings?
Update your chart settings whenever market conditions change significantly or your trading strategy evolves. Regularly review and adjust weekly or monthly to keep your charts aligned with current trends and improve decision-making. Don’t wait too long—stale settings can cause missed opportunities or false signals.
What are the mistakes to avoid when optimizing charts?

Avoid cluttering charts with too many indicators; it slows down performance. Don't use high-resolution images or unnecessary visual effects. Keep data ranges simple—focus on relevant timeframes. Overloading with indicators like multiple oscillators or overlays can cause lag. Avoid frequent, unnecessary zooming or resizing during trading. Use optimized charting software and update it regularly. Don't include excessive historical data that isn't needed for current analysis. Ignore these mistakes to ensure your charts load fast and stay responsive during trading.
Conclusion about How to Optimize Your Day Trading Charts for Performance
Optimizing your day trading charts is crucial for enhancing performance and making informed decisions. By improving clarity, choosing effective indicators, and customizing setups, you can significantly boost your trading efficiency. Incorporating volume data, recognizing chart patterns, and reducing clutter are essential for clearer signals. Additionally, utilizing the right tools and color schemes can expedite your analysis. Regularly updating your settings and avoiding common mistakes will further refine your approach. For expert insights and support in navigating these strategies, DayTradingBusiness is here to help you succeed.
Learn about How Do I Optimize My Day Trading Bot’s Performance?