Did you know that even the most successful day traders often start their day with a cup of coffee and a chaotic chart? But chaos doesn’t lead to profits; a structured charting routine does. In this article, we’ll guide you through the essential steps to create an effective daily trading chart routine, including the best chart types, key indicators, and optimal timeframes. Learn how to identify entry and exit points, avoid common mistakes, and incorporate market news into your analysis. We’ll also discuss tools that can enhance your charting process and help you stay disciplined. With insights from DayTradingBusiness, you'll be set to turn your trading chaos into a clear path to success.
How do I create a daily trading chart routine?
Choose a specific time each day to review your charts, like morning or after market hours. Use a reliable trading platform with real-time data. Focus on key technical indicators such as moving averages, RSI, and volume. Track your chosen stocks or assets consistently, noting patterns or setups. Keep a trading journal to record insights, entry/exit points, and mistakes. Set predefined criteria for entry and exit before you start. Stick to your routine daily, adjusting only after analyzing your performance.
What are the essential steps to start a trading chart routine?
Open your trading platform and set up your preferred charting tools. Choose a reliable time frame, like 1-minute or 5-minute charts, suited for day trading. Identify key technical indicators such as moving averages, RSI, or MACD to spot entry and exit points. Plan your daily watchlist based on pre-market analysis and news. Establish a consistent routine for analyzing charts at specific times, like before the market opens and during breaks. Record your trades and review your charts to spot patterns and improve your strategy. Stick to your routine daily to build discipline and consistency.
Which chart types are best for day trading?
Candlestick charts and line charts are best for day trading. Candlestick charts reveal short-term price action and patterns, while line charts help identify trends quickly. Volume charts are essential for confirming moves. Use tick or intraday charts, like 1-minute or 5-minute, to capture rapid market changes.
How often should I review my trading charts during the day?
Review your trading charts every 15 to 30 minutes during the day to stay updated on market movements. Focus on key levels and patterns without obsessing over every small fluctuation. Adjust based on your trading style—more frequent if you’re scalping, less if you’re swing trading intraday. Consistency matters, so establish a routine that keeps you alert without causing burnout.
What indicators are most effective for a day trading chart?
Moving averages, RSI, and MACD are key indicators for day trading charts. Volume spikes confirm trade signals. Bollinger Bands help spot volatility. Price action and candlestick patterns like dojis or engulfing candles are crucial. Use these indicators together to identify entry and exit points quickly.
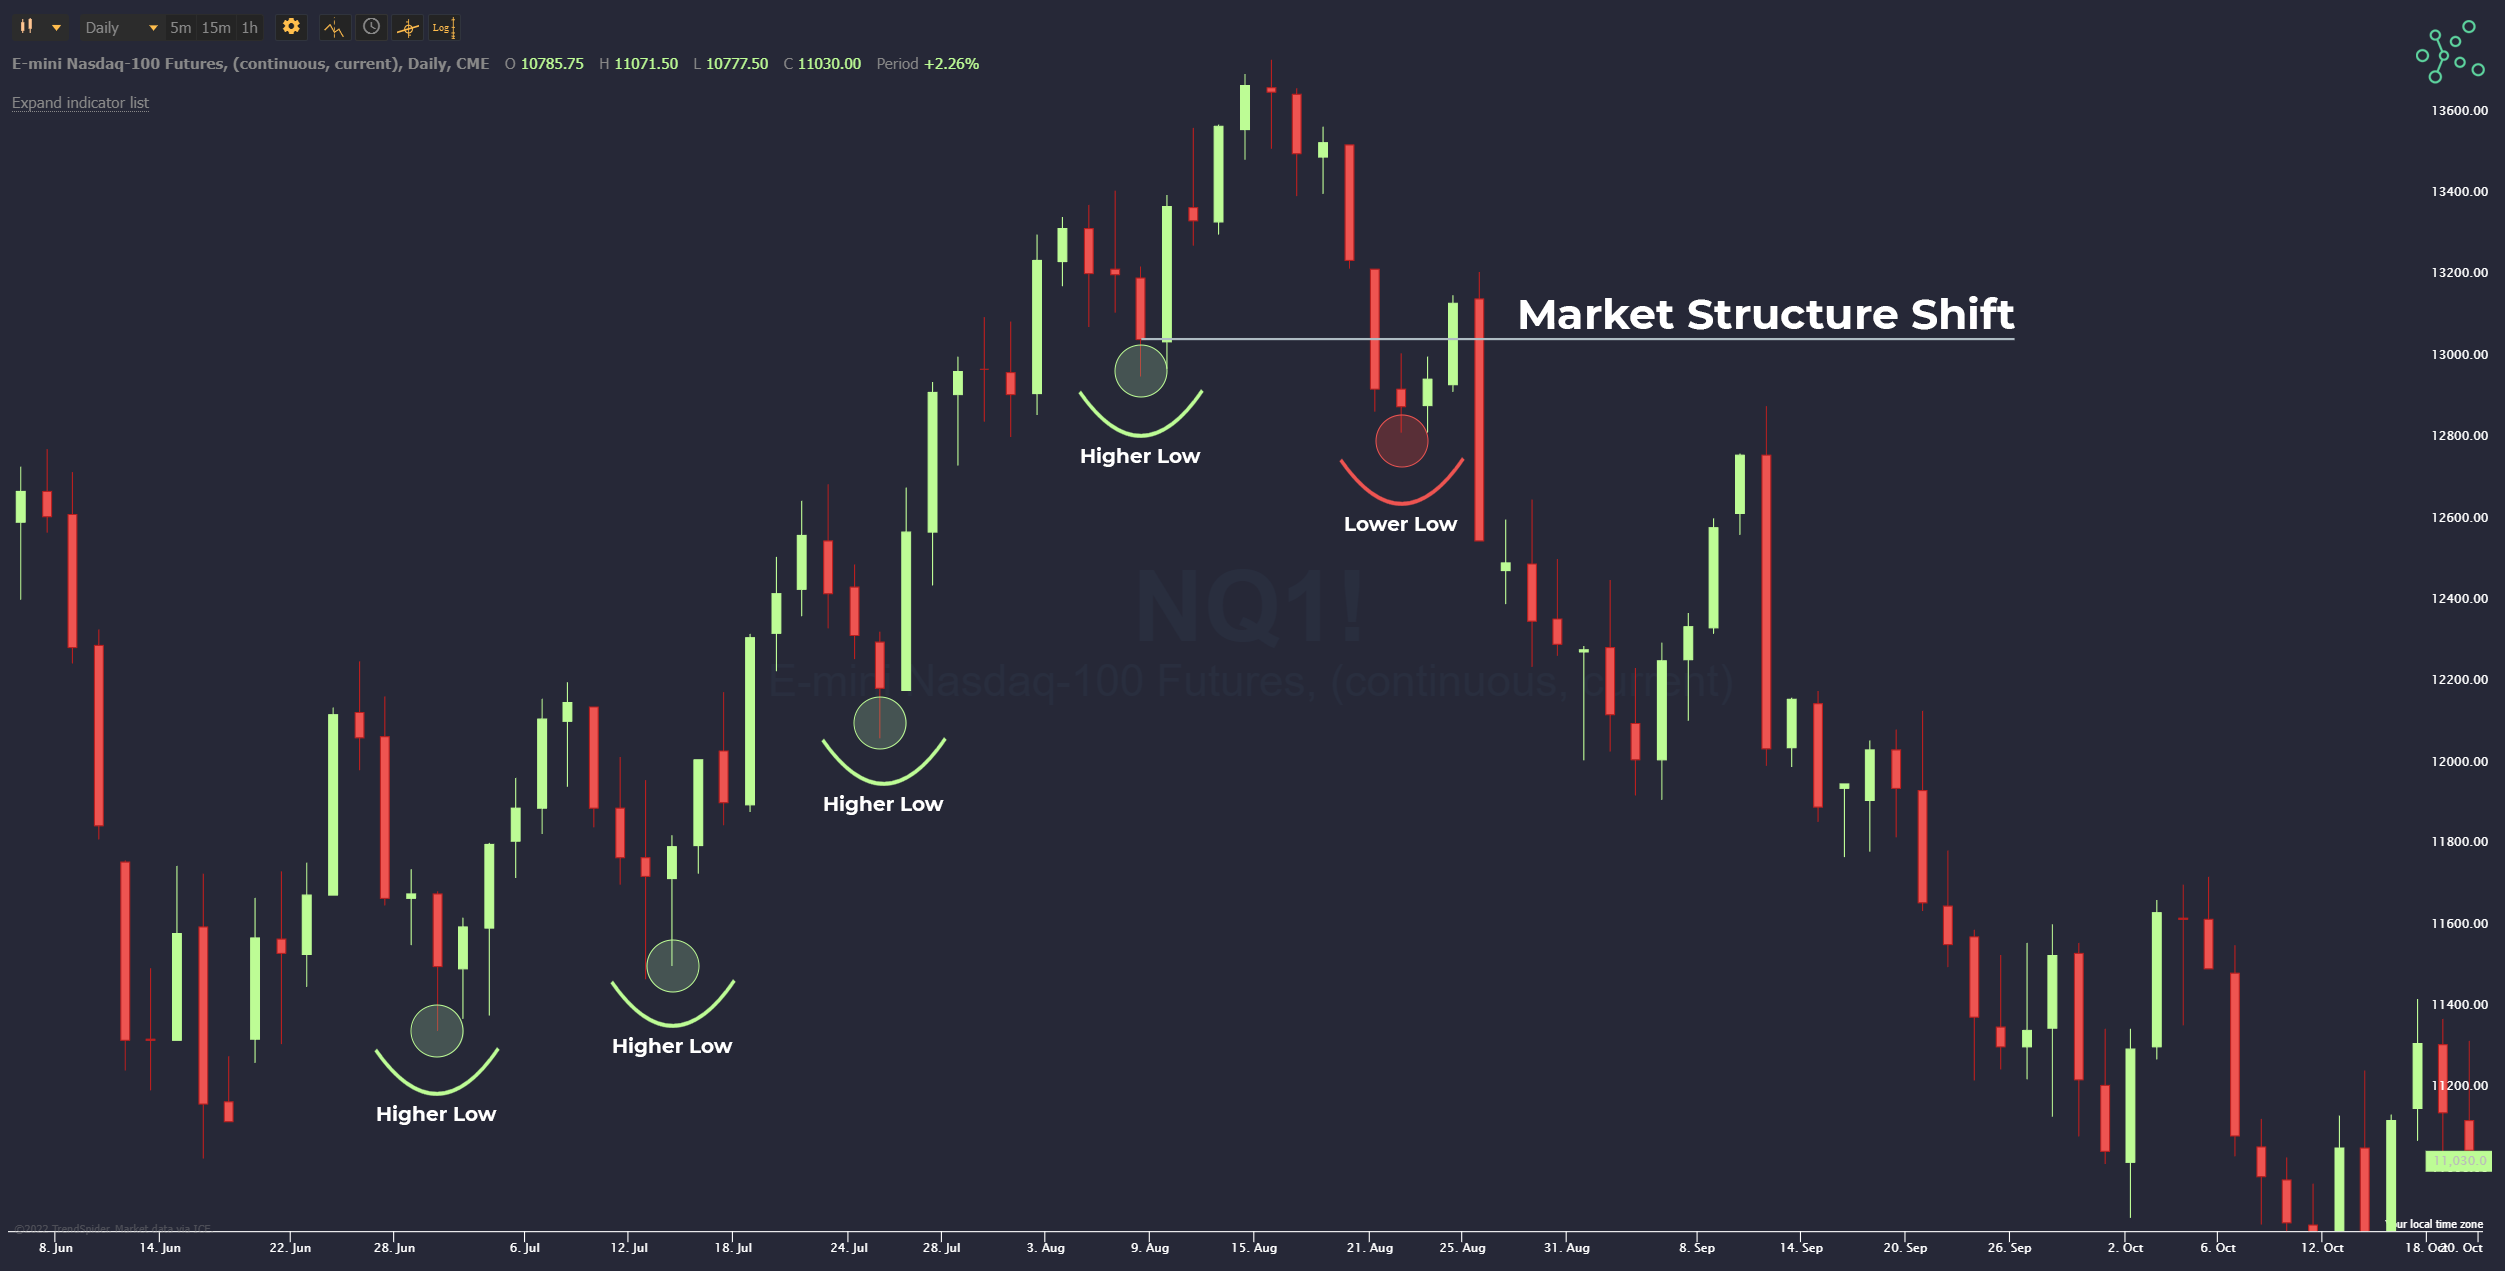
How do I identify the best entry and exit points on a chart?
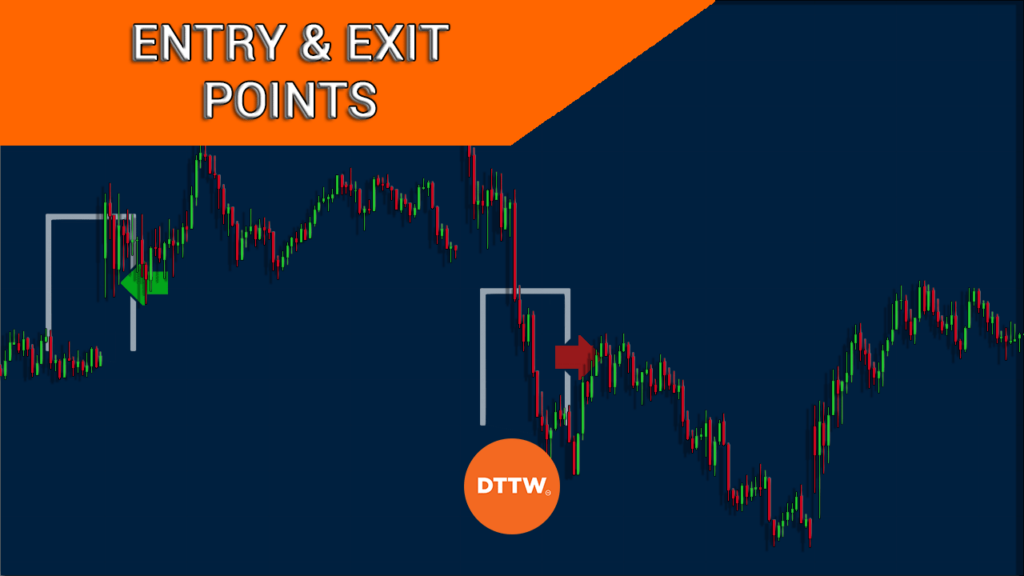
Look for clear support and resistance levels, then confirm with technical indicators like moving averages, RSI, or MACD. Enter when price breaks above resistance or dips below support with volume confirmation. Exit when momentum wanes, RSI hits overbought or oversold levels, or price shows reversal patterns like head and shoulders or double tops/bottoms. Keep entries simple, and set stop-loss and take-profit levels based on recent price action.
What timeframes should I focus on for day trading?
Focus on 1-minute, 5-minute, and 15-minute charts for day trading. Use these timeframes to spot quick entry and exit points, identify short-term trends, and confirm signals. Avoid longer charts like daily or weekly during active trading hours.
How can I develop a consistent chart analysis process?
Identify your key indicators like moving averages, RSI, or MACD. Set a specific time each day to review charts, ideally during market open or close. Use a checklist to analyze trend direction, support and resistance levels, and volume patterns. Keep notes on what works and refine your approach weekly. Stick to the same routine daily to build muscle memory and consistency. Practice analyzing different charts to spot patterns and improve your intuition.
What are common mistakes to avoid in a trading chart routine?

Avoid skipping pre-market analysis and rushing into trades without a plan. Don’t ignore volume spikes or misinterpret candlestick patterns. Overtrading based on minor signals leads to losses; stick to your strategy. Neglecting to update or review your charts regularly causes missed opportunities. Ignoring risk management, like stop-loss placement, increases losses. Failing to adapt your routine to changing market conditions hampers growth. Lastly, relying solely on one indicator instead of a balanced chart analysis weakens decision-making.
How do I incorporate news and market events into my chart analysis?
Include news and market events by checking real-time news feeds and economic calendars before trading. Mark key events like earnings reports, economic releases, or geopolitical developments on your chart. Use vertical lines or annotations to highlight when news impacted price action. Adjust your analysis to account for sudden volatility caused by news, and review how price reacts during major events to refine your strategy. Incorporate alerts for upcoming news that could influence your trades.
Should I use multiple charts or just one for day trading?
Use multiple charts for day trading. They help you see different timeframes—like 1-minute for entries and 15-minute for trends—so you can make better decisions. Relying on just one chart risks missing important signals or context. Multiple charts give a fuller picture, improving your accuracy and reaction time.
How do I track my trading performance using charts?
Use candlestick charts to visualize your trades and spot patterns. Mark entry, exit, and stop-loss points directly on the chart. Review your trades daily, noting profit or loss, and analyze trends over time. Incorporate technical indicators like moving averages, RSI, or MACD to identify signals. Keep a trading journal alongside your charts to track performance and refine your strategy. Regularly assess your chart data to spot strengths and weaknesses in your trading routine.
What tools and software are best for building a trading chart routine?
Trading platforms like TradingView and ThinkorSwim are top choices for building a day trading chart routine. Use charting software with real-time data, customizable indicators, and drawing tools. Incorporate technical analysis tools such as Moving Averages, RSI, MACD, and volume profiles. Automate alerts for price movements or indicator signals. Combine these with a routine that includes pre-market analysis, live chart review, and post-trade review. Keep your setup simple but flexible for quick decision-making.
How can I stay disciplined with my daily chart routine?
Set a specific time each day for chart analysis and stick to it. Use a checklist to ensure you review key indicators and patterns consistently. Limit distractions during your charting session to maintain focus. Keep a trading journal to track your decisions and learn from mistakes. Develop a simple, repeatable process to avoid overcomplicating your routine. Stay motivated by reviewing your progress and setting clear goals.
What are the benefits of a structured charting routine for day traders?
A structured charting routine helps day traders identify trends quickly, improve decision accuracy, and reduce emotional mistakes. It ensures consistent analysis, leading to better timing of entries and exits. This routine builds discipline, minimizes missed opportunities, and enhances overall trading efficiency.
Conclusion about Building a Day Trading Charting Routine for Success
Incorporating a structured charting routine is crucial for achieving success in day trading. By establishing clear steps, selecting appropriate chart types, and using effective indicators, traders can enhance their decision-making processes. Regularly reviewing charts, identifying entry and exit points, and staying informed about market events will further refine your strategy. Avoiding common mistakes and maintaining discipline are key to long-term performance. For comprehensive guidance and resources tailored to your trading journey, DayTradingBusiness is here to support you every step of the way.
Learn about Building a Day Trading Routine for Success