Did you know that 90% of day traders lose money, often because they don't leverage the right tools? In the fast-paced world of day trading, charting software is essential for making informed decisions. This article delves into what charting software is, how to choose the best options, and the key features to look for. Discover how these tools enhance technical analysis and refine trading strategies, along with tips on setting up charts for intraday trading and interpreting vital indicators. Also, learn about the advantages of real-time data, the importance of avoiding common mistakes, and how to integrate these tools with your trading platform. Whether you're a beginner or an advanced trader, understanding how to utilize charting software can significantly improve your trading outcomes. Let DayTradingBusiness guide you through the intricacies of charting software for successful trading.
What is charting software for day trading?
Charting software for day trading is a tool that displays real-time price charts, technical indicators, and patterns to help traders analyze market trends and make quick buy or sell decisions. It provides customizable graphs, volume data, and drawing tools to identify entry and exit points. Popular options include TradingView, ThinkorSwim, and MetaTrader. These platforms enable traders to visualize price movements and execute trades efficiently during fast-paced markets.
How do I choose the best charting software for day trading?
Pick charting software with real-time data, customizable indicators, and fast execution. Look for user-friendly interfaces, reliable technical analysis tools, and compatibility with your trading platform. Prioritize software with good charting speed, alert features, and strong community support. Test demo versions to see which tools fit your trading style before committing.
What features should I look for in day trading charting tools?
Look for real-time data, customizable indicators, multiple timeframes, drawing tools, alerts, and easy interface. Ensure it supports quick execution and has reliable performance. Compatibility with your trading platform and robust chart types like candlestick and line charts are essential.
How does charting software help with technical analysis?
Charting software helps with technical analysis by providing real-time price charts, trend lines, and indicators. It allows day traders to identify entry and exit points quickly through pattern recognition and signals like moving averages or RSI. The software streamlines analyzing volume, momentum, and support/resistance levels, making decision-making faster and more precise. It also lets traders backtest strategies on historical data, improving their understanding of market behavior. Overall, charting tools turn raw price data into actionable insights, boosting trading accuracy.
Can charting software improve my day trading strategies?
Yes, charting software enhances day trading strategies by providing real-time technical analysis, clear visual patterns, and quick data interpretation. It helps identify entry and exit points, track trend changes, and manage risk efficiently. Using charting tools can give you a competitive edge by making informed decisions faster.
How do I set up charts for intraday trading?
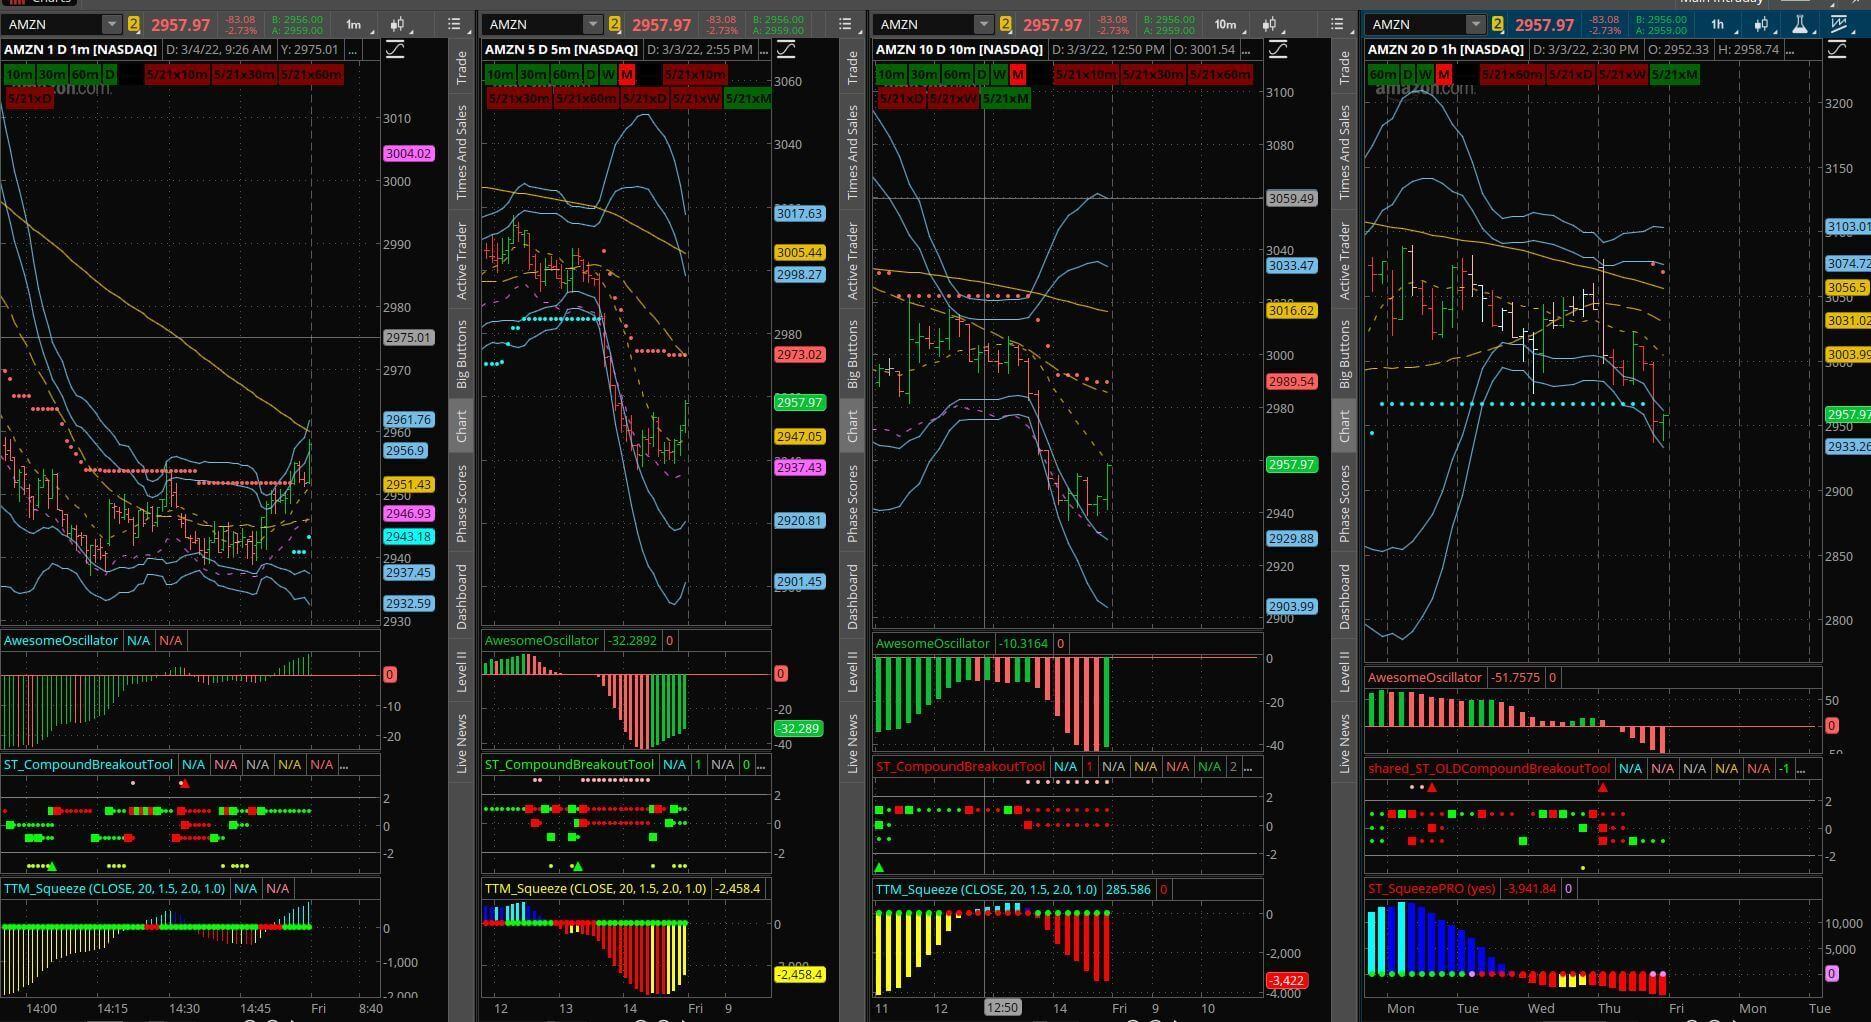
Open your charting software, select the asset you're trading, and set the timeframe to minutes (like 1-minute or 5-minute charts). Customize indicators such as Moving Averages, RSI, or MACD to identify entry and exit points. Add volume indicators to confirm moves. Save your preferred layout for quick access during trading sessions. Use real-time data feeds to keep charts updated instantly.
What indicators are essential in day trading charting software?
Key indicators in day trading charting software include moving averages (like 50- and 200-period), RSI for momentum, MACD for trend changes, Bollinger Bands for volatility, and volume for confirmation of moves. These help identify entry and exit points quickly.
How do I customize charts for better analysis?
To customize charts for better analysis, adjust timeframes to match your trading style, add technical indicators like RSI or MACD, and use different chart types such as candlestick or bar charts. Customize colors and gridlines for clarity, set alerts for specific price levels, and overlay trendlines or patterns to visualize market movements. Save templates to quickly apply preferred setups during live trading.
What are the advantages of using real-time data in charting tools?
Real-time data in charting tools provides immediate insights into market movements, enabling quick decision-making. It helps traders spot trends, entry and exit points, and potential reversals as they happen. Using real-time data reduces lag, so traders react faster to volatile price swings. It improves accuracy in technical analysis, ensuring trades are based on current market conditions. Overall, it boosts confidence in trading strategies by offering up-to-the-minute information.
How can chart patterns predict short-term market movements?
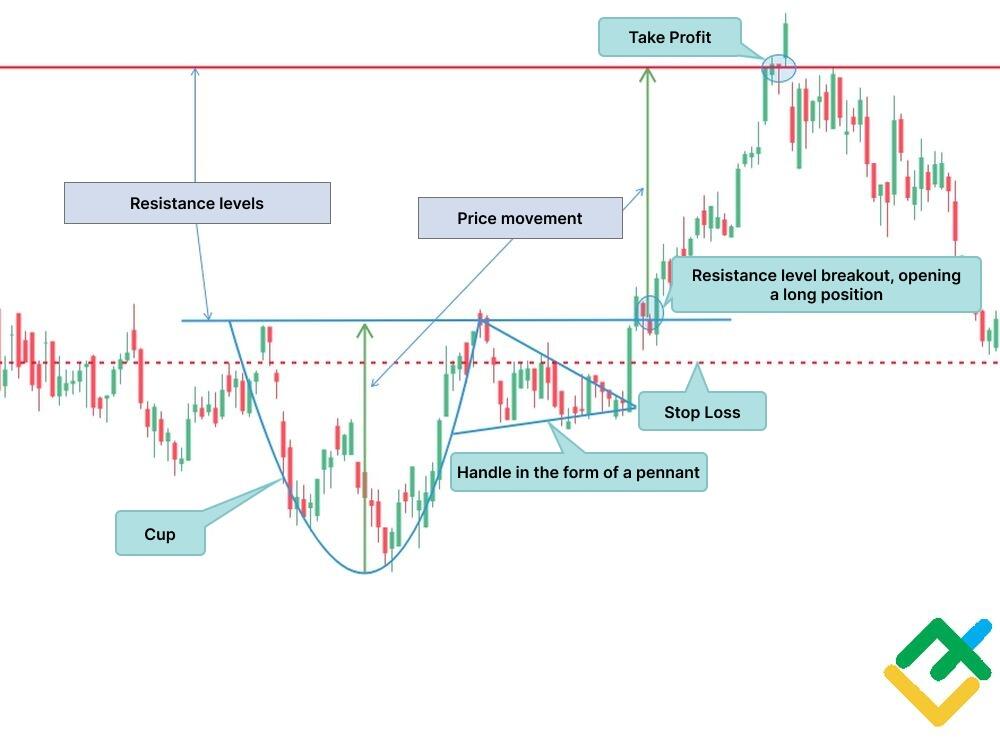
Chart patterns like head and shoulders, double tops/bottoms, and flags signal potential short-term market moves by revealing trader psychology. When these patterns form, they indicate bullish or bearish sentiment shifts, helping day traders anticipate price breakouts or reversals. Recognizing volume confirmation alongside patterns improves prediction accuracy. Using charting software, traders identify these patterns quickly, enabling timely entry and exit points for short-term gains.
Is it possible to automate trades using charting software?
Yes, some charting software allows automated trading through APIs or built-in trading bots, enabling you to execute trades based on technical signals without manual input.
How do I interpret volume and price action in charts?
Look for volume spikes with strong price moves—they signal significant buying or selling pressure. Rising volume with an uptrend suggests momentum; declining volume in a trend warns of weakness. Sharp price jumps on high volume confirm breakouts, while low volume on price dips indicates potential reversals. Watch for volume divergence—price makes new highs or lows, but volume doesn’t follow—that hints at a possible reversal. Use these cues together to gauge market sentiment and confirm entry or exit points in day trading.
What are common mistakes to avoid with trading charts?
Avoid overloading charts with too many indicators—they create confusion. Don’t rely solely on lagging indicators like moving averages; mix in real-time data. Ignoring volume can lead to missed signals. Using incorrect timeframes can distort your analysis—stick to what suits your trading style. Failing to update or clean your charts regularly causes outdated info. Ignoring price action and candlestick patterns is a mistake; they reveal market sentiment. Overtrading based on every minor chart movement increases risk. Disregarding support and resistance levels leads to poor entry and exit points. Lastly, avoid emotional reactions—stick to your chart signals, not gut feelings.
Learn about Common Mistakes in Day Trading Analysis to Avoid
How do I integrate charting software with trading platforms?
Connect your charting software to your trading platform via API or direct link. Install any required plugins or extensions, then link your account credentials. Configure data feeds to sync real-time market data. Customize chart layouts and indicators within the software. Test the connection with a few trades to ensure data flows correctly.
How often should I update my chart analysis during the day?
Update your chart analysis every few minutes, ideally every 1-5 minutes, during the trading day. This keeps you current with price movements and market trends. Adjust frequency based on volatility; more active markets require more frequent updates.
What are the best charting software options for beginners?
TradingView is the top choice for beginners due to its user-friendly interface and extensive charting tools. Thinkorswim offers powerful features with easy-to-understand layouts, great for learning day trading analysis. MetaTrader 4 and 5 are popular, providing customizable charts and indicators suitable for beginners. TradingView's social community helps new traders learn through shared ideas. Thinkorswim by TD Ameritrade combines simplicity with advanced tools, perfect for starting out.
How do advanced charting tools support risk management?
Advanced charting tools help day traders identify risk by detecting patterns, support and resistance levels, and potential reversals. They enable quick visualization of market trends, so traders can set precise stop-loss and take-profit points. Custom indicators and real-time data allow for better prediction of price movements, reducing unexpected losses. These tools also help in managing timing risk by highlighting entry and exit signals, making risk management more proactive and data-driven.
Can charting software help identify breakout opportunities?
Yes, charting software helps identify breakout opportunities by highlighting price levels where stocks push through resistance or support, signaling potential for significant moves. It shows patterns like flags, triangles, and volume spikes that indicate a breakout is happening or about to happen. Traders use these signals to enter trades early, aiming to capitalize on rapid price shifts.
How does multiple timeframe analysis improve trading decisions?
Multiple timeframe analysis helps traders see the bigger trend and finer entry points by comparing charts like daily, hourly, and 15-minute. It clarifies whether you're trading with the overall market direction or catching quick moves. This reduces false signals and improves timing, making trades more precise. For example, you might identify a bullish trend on the daily chart but wait for a pullback on the 15-minute before entering. It aligns short-term moves with long-term trends, leading to better risk management and higher-probability trades.
Learn about How to Improve Your Day Trading Analysis Skills
What is the role of backtesting in charting software?
Backtesting in charting software evaluates trading strategies by simulating past market data. It helps traders see how their approach would have performed historically, identifying strengths and weaknesses. This process improves decision-making, reduces risk, and refines entry and exit points for day trading.
Conclusion about Using Charting Software for Day Trading Analysis
In conclusion, leveraging charting software is crucial for effective day trading analysis. By selecting the right tools and features, traders can enhance their technical analysis, improve strategies, and make informed decisions based on real-time data. With the ability to customize charts and integrate them with trading platforms, day traders can better interpret market movements and identify opportunities. Avoid common pitfalls to maximize your trading potential. For comprehensive insights and guidance on charting software and day trading, DayTradingBusiness is here to support your journey.
Sources:
- Point and Figure charting: A computational methodology and trading ...
- Microcomputer Graphics As An Instructional Aid In A Commodity ...
- Candlestick technical trading strategies: Can they create value for ...
- A profitable trading algorithm for cryptocurrencies using a Neural ...
- Integrating sentiment analysis with graph neural networks for ...