Did you know that in day trading, timeframes can be as crucial as the coffee you drink to stay alert? Understanding timeframes is essential for making informed trade decisions. This article explores the pivotal role timeframes play in day trading charts, detailing how they influence trade strategies, risk management, and market analysis. We’ll cover the best timeframes to use, the risks of neglecting them, and how multiple timeframes can enhance trading accuracy. Discover how aligning your timeframes with your strategies can improve your entry and exit points, trend recognition, and even stop-loss placements. Join us at DayTradingBusiness as we delve into the intricate dance of timeframes that can make or break your trading success.
Why Are Timeframes Crucial in Day Trading?
Timeframes in day trading charts are crucial because they determine your entry and exit points, show short-term price movements, and help manage risk. Shorter timeframes like 1-minute or 5-minute charts reveal quick market fluctuations, enabling precise trades. Longer timeframes, such as 15-minute or hourly charts, provide broader trend context, preventing impulsive decisions. Using the right timeframe balances speed and accuracy, increasing your chances of profitable trades. Without proper timeframes, you risk misreading market signals and making costly mistakes.
How Do Different Timeframes Affect Trade Decisions?
Different timeframes shape trade decisions by showing varying levels of price detail. Short-term charts like 1-minute or 5-minute highlight quick moves and scalp opportunities. Daily or weekly charts reveal broader trends and key support or resistance levels. Using shorter timeframes helps with precise entries and exits, while longer ones guide overall trend direction. Combining multiple timeframes allows traders to confirm setups and avoid false signals.
What Are the Best Timeframes for Day Trading?
The best timeframes for day trading are 1-minute, 5-minute, and 15-minute charts. These short periods let traders spot quick price movements and execute timely trades. The 1-minute chart offers detailed entry points, while 5-minute and 15-minute charts help confirm trends and reduce noise. Combining these timeframes improves decision-making and increases trading accuracy.
How Do Timeframes Influence Chart Analysis?
Timeframes shape chart analysis by highlighting different market trends and entry points. Short-term charts reveal quick price moves and intraday patterns, crucial for day trading. Longer timeframes show broader trends, helping traders understand overall market direction. Using multiple timeframes allows for better timing, confirming signals, and avoiding false entries. Ignoring timeframes can lead to misinterpretation and risky trades.
Can Using Multiple Timeframes Improve Trading Accuracy?
Yes, using multiple timeframes improves trading accuracy by providing a clearer view of market trends and entry points. It helps you see the bigger picture on higher timeframes while fine-tuning entries on lower ones. This layered approach reduces false signals and boosts confidence in trades. For example, spotting a trend on a daily chart and confirming it on a 15-minute chart can lead to more precise entries.
Why Is It Important to Match Timeframes with Trading Strategies?
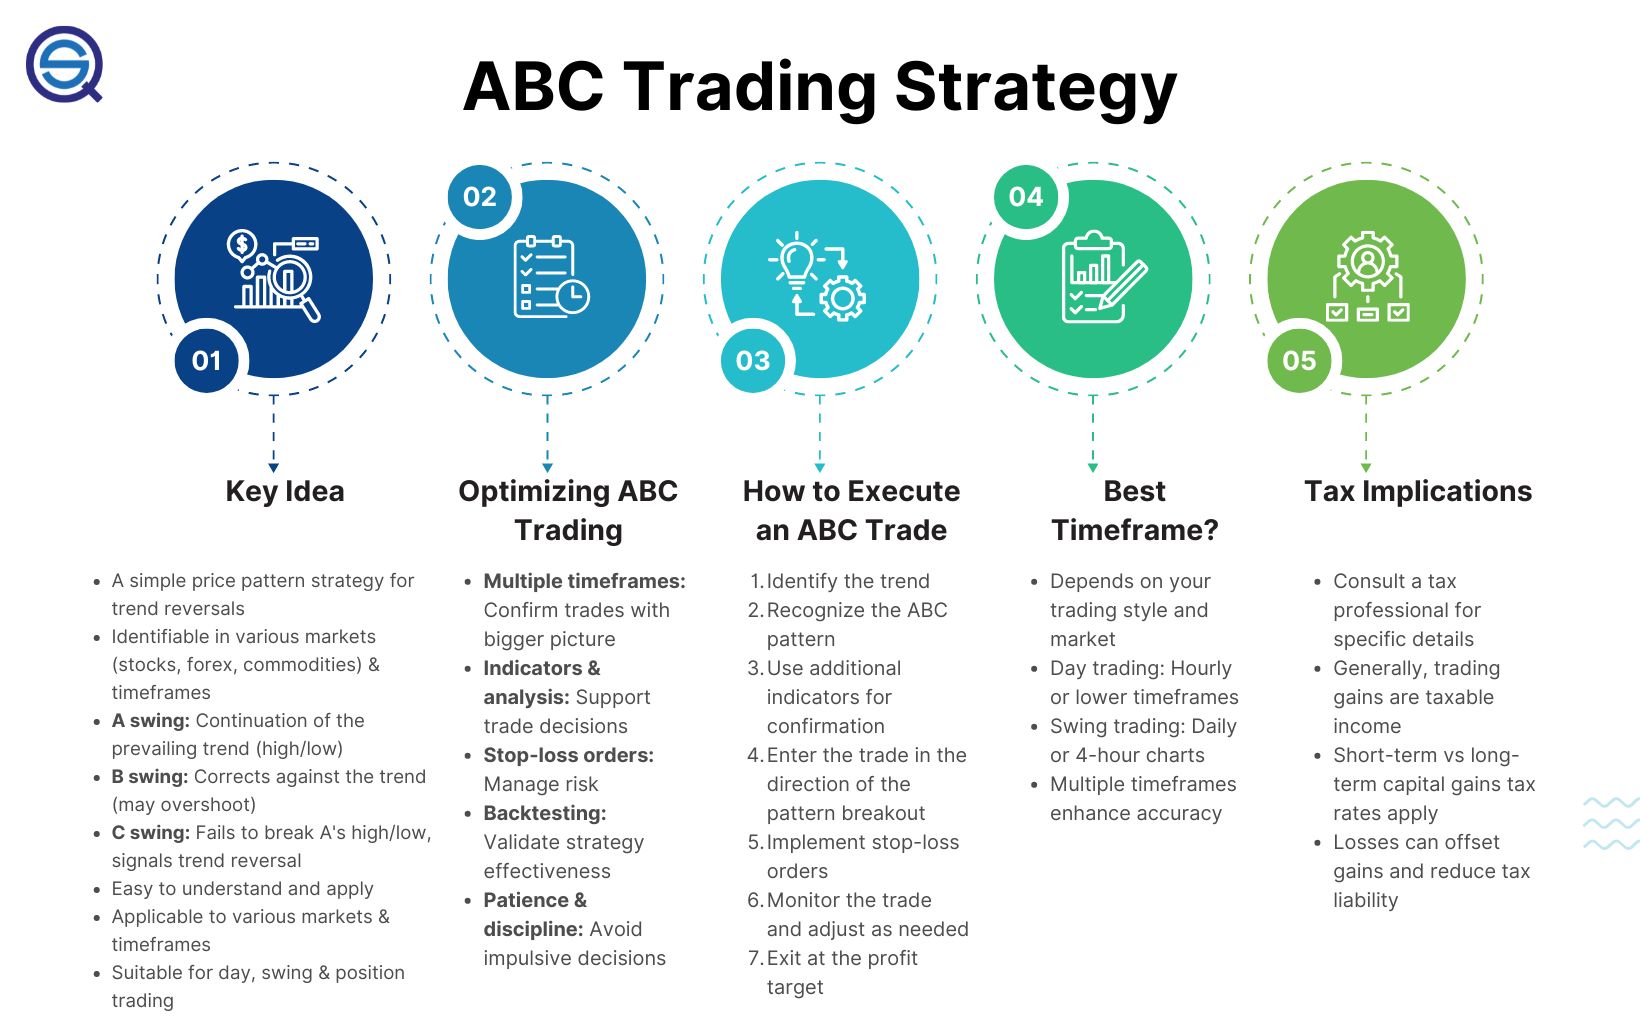
Matching timeframes with trading strategies ensures you make decisions based on relevant market movements. Short-term traders need minute or hourly charts to catch quick moves, while long-term investors rely on daily or weekly charts to see broader trends. Using the right timeframe prevents false signals and reduces noise, helping you stay disciplined. It aligns your analysis with your goals, increasing the chance of successful trades.
How Do Shorter Timeframes Impact Risk Management?
Shorter timeframes increase risk because they reveal more market noise and rapid price swings, making it harder to distinguish genuine trends from random fluctuations. They demand quicker decision-making, raising the chance of mistakes and emotional trading. Using shorter timeframes can lead to more frequent trades, amplifying transaction costs and potential losses. Overall, shorter timeframes require tighter risk controls and faster reactions to avoid bigger setbacks.
What Are the Risks of Ignoring Timeframes?
Ignoring timeframes in day trading charts risks missed opportunities, poor entry and exit timing, and increased losses. Without clear timeframes, you can’t accurately gauge market momentum or identify trends. It leads to confusion, impulsive decisions, and inconsistency in trades. Missing the right moment to buy or sell can wipe out potential profits and cause emotional trading.
How Do Timeframes Help Identify Entry and Exit Points?
Timeframes show different market perspectives, helping traders spot entry and exit points. Shorter timeframes reveal quick opportunities and precise entry signals, while longer ones confirm trends and support decisions. Combining multiple timeframes guides timing—enter on a 5-minute chart when a quick setup aligns with the daily trend. Exits are clearer when short-term signals match longer-term trend analysis, reducing false signals. Overall, timeframes help traders synchronize their entries and exits for better timing and risk management.
Why Do Traders Use Different Timeframes for Confirmation?

Traders use different timeframes for confirmation to validate signals and reduce false entries. Shorter timeframes show quick price moves, while longer ones reveal overall trend direction. Combining them helps traders spot precise entry and exit points, ensuring their decisions align with the bigger market trend. This layered approach improves accuracy and confidence in trades.
How Do Timeframes Affect Market Volatility Analysis?
Timeframes shape how you see market volatility—shorter charts like 1-minute or 5-minute reveal quick price swings and sudden spikes, making volatility seem intense. Longer charts, like daily or weekly, smooth out these fluctuations, showing broader trends and less noise. Choosing the right timeframe helps you gauge whether volatility is a temporary spike or part of a sustained trend, influencing your trading decisions. For day trading, quick timeframes highlight real-time volatility, crucial for timing entries and exits, while longer timeframes provide context to avoid reacting to false signals.
What Are Common Timeframes Used by Day Traders?
Day traders typically use 1-minute, 5-minute, and 15-minute charts for short-term analysis. Some also monitor 30-minute charts for broader trends within the trading day. These timeframes help traders identify quick entry and exit points, capturing small price movements.
How Do Timeframes Impact Stop-Loss and Take-Profit Placement?

Timeframes determine the speed and size of price movements, affecting stop-loss and take-profit placement. Shorter timeframes, like 1-minute or 5-minute charts, require tighter stops to avoid false breakouts, while longer timeframes allow wider stops based on broader support and resistance levels. Using a daily chart, you might set a stop-loss several percent away from entry, but on a 5-minute chart, the stop might be a few pips. The timeframe influences your risk management; smaller charts demand quick, precise exits, and larger charts support more relaxed, strategic levels.
Can Timeframes Help in Recognizing Trends and Reversals?
Yes, different timeframes help identify trends and reversals. Short-term charts show quick moves and potential reversals, while longer timeframes reveal overall trends. Combining multiple timeframes clarifies whether a trend is strengthening or weakening, making it easier to spot reversals early.
How Do Timeframes Play a Role in Volume Analysis?
Timeframes determine the speed and detail of volume analysis in day trading charts. Shorter timeframes, like 1-minute or 5-minute charts, reveal quick volume shifts, helping traders spot immediate buying or selling surges. Longer timeframes, such as 15-minute or hourly charts, show broader volume trends, indicating overall market strength or weakness. Combining multiple timeframes provides a clearer picture of volume patterns, helping traders confirm breakout signals or potential reversals. Without considering timeframes, volume data can be misleading, leading to poor trading decisions.
Conclusion about The Importance of Timeframes in Day Trading Charts
In day trading, understanding and utilizing the right timeframes is essential for making informed decisions and optimizing trade outcomes. Different timeframes can significantly influence entry and exit points, risk management, and overall trading strategies. By aligning your timeframes with your trading approach and utilizing multiple frames for confirmation, you can enhance accuracy and better navigate market volatility. Ignoring timeframes can expose traders to unnecessary risks and missed opportunities. For a deeper exploration of how to effectively use timeframes in your trading strategy, DayTradingBusiness offers valuable insights and resources.