Did you know that trend lines can be as elusive as a cat chasing its own tail? Understanding how to effectively use trend lines in day trading charts is essential for navigating the markets. In this article, we cover the basics of what trend lines are, how to draw them accurately, and their significance in identifying entry points. You’ll learn about different types of trend lines, how to spot breakouts, and when you should disregard a signal. Additionally, we’ll discuss tools for drawing trend lines, the difference between trend lines and support/resistance levels, and strategies for volatile markets. Avoid common mistakes, explore ways to combine trend lines with other indicators, and discover software that can enhance your analysis. With insights from DayTradingBusiness, you’ll be equipped to master trend lines and elevate your trading strategy.
What are trend lines in day trading charts?
Trend lines in day trading charts are straight lines drawn along price points to identify the direction of the market. They connect lows in an uptrend or highs in a downtrend, showing support or resistance levels. Traders use them to spot potential entry and exit points, as breaks of trend lines often signal reversals or momentum shifts.
How do I draw accurate trend lines?
Identify the main direction of the price movement. Connect two or more significant highs or lows along that trend. Use clean, straight lines; avoid connecting every minor fluctuation. Adjust the line so it touches as many points as possible without crossing through candles. Confirm the trend line's accuracy by checking if future price action respects it—bounces or breaks signal potential reversals or continuations. Practice drawing on different charts to develop an eye for reliable trend lines.
Why are trend lines important for day trading?
Trend lines help day traders identify the direction of the market, making it easier to spot potential entry and exit points. They show support and resistance levels, indicating where price may bounce or reverse. Using trend lines reduces guesswork, allowing traders to follow the trend confidently and avoid false signals. They also help gauge the strength of a move, so traders can make quicker, more informed decisions during fast-paced trading sessions.
How can trend lines help identify entry points?
Trend lines show the direction of price movement, highlighting potential entry points when they break or bounce. When the price approaches a trend line and reverses, it signals a possible buy or sell opportunity. A break above a downward trend line suggests a bullish entry, while a break below an upward trend line indicates a bearish signal. Using trend lines to confirm momentum shifts helps you time entries more precisely.
What are the common types of trend lines?
Common types of trend lines are upward (support lines), downward (resistance lines), and horizontal (sideways or range-bound). Upward trend lines connect successive higher lows, showing bullish momentum. Downward trend lines link lower highs, indicating bearish trends. Horizontal trend lines mark areas of price consolidation or support/resistance levels during sideways trading.
How do I spot a breakout using trend lines?
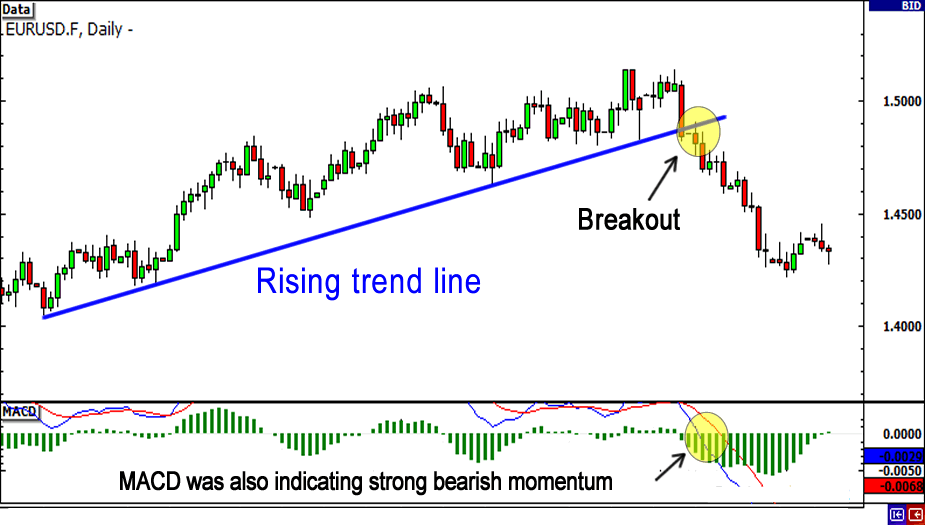
Look for price breaking above or below the trend line with strong volume. A breakout occurs when the price closes beyond the trend line after testing it as support or resistance. Confirm the move with increased trading activity and a decisive candle closing past the line. Avoid false signals by waiting for the candle to fully clear the trend line rather than just touching it.
When should I ignore a trend line signal?
Ignore a trend line signal when the price action shows strong reversal patterns, such as sharp spikes or gaps that break the line unexpectedly, or if volume contradicts the trend. Also, avoid acting on trend line signals during market news or high volatility, which can cause false breakouts. If the trend line has been tested multiple times without a clear breakout or breakdown, it’s better to wait for confirmation.
How do I confirm a trend line breakout?
To confirm a trend line breakout, wait for the price to close clearly beyond the trend line in the breakout direction. Look for increased volume on the breakout day to validate it. Avoid false signals by confirming if the breakout holds on subsequent candles or timeframes. Use a pullback to the trend line for confirmation if the price retests and then moves away again.
What tools can I use to draw trend lines?
You can use charting platforms like TradingView, MetaTrader 4 or 5, Thinkorswim, and NinjaTrader to draw trend lines. These tools offer easy-to-use drawing tools for identifying support and resistance levels in day trading charts.
How do trend lines differ from support and resistance?
Trend lines show the overall direction of price movement, connecting higher lows in an uptrend or lower highs in a downtrend. Support and resistance are specific price levels where buying or selling pressure tends to halt or reverse the move. Trend lines indicate the current trend’s slope, while support and resistance mark key levels where price action often reacts.
Can trend lines be used for short-term trading strategies?
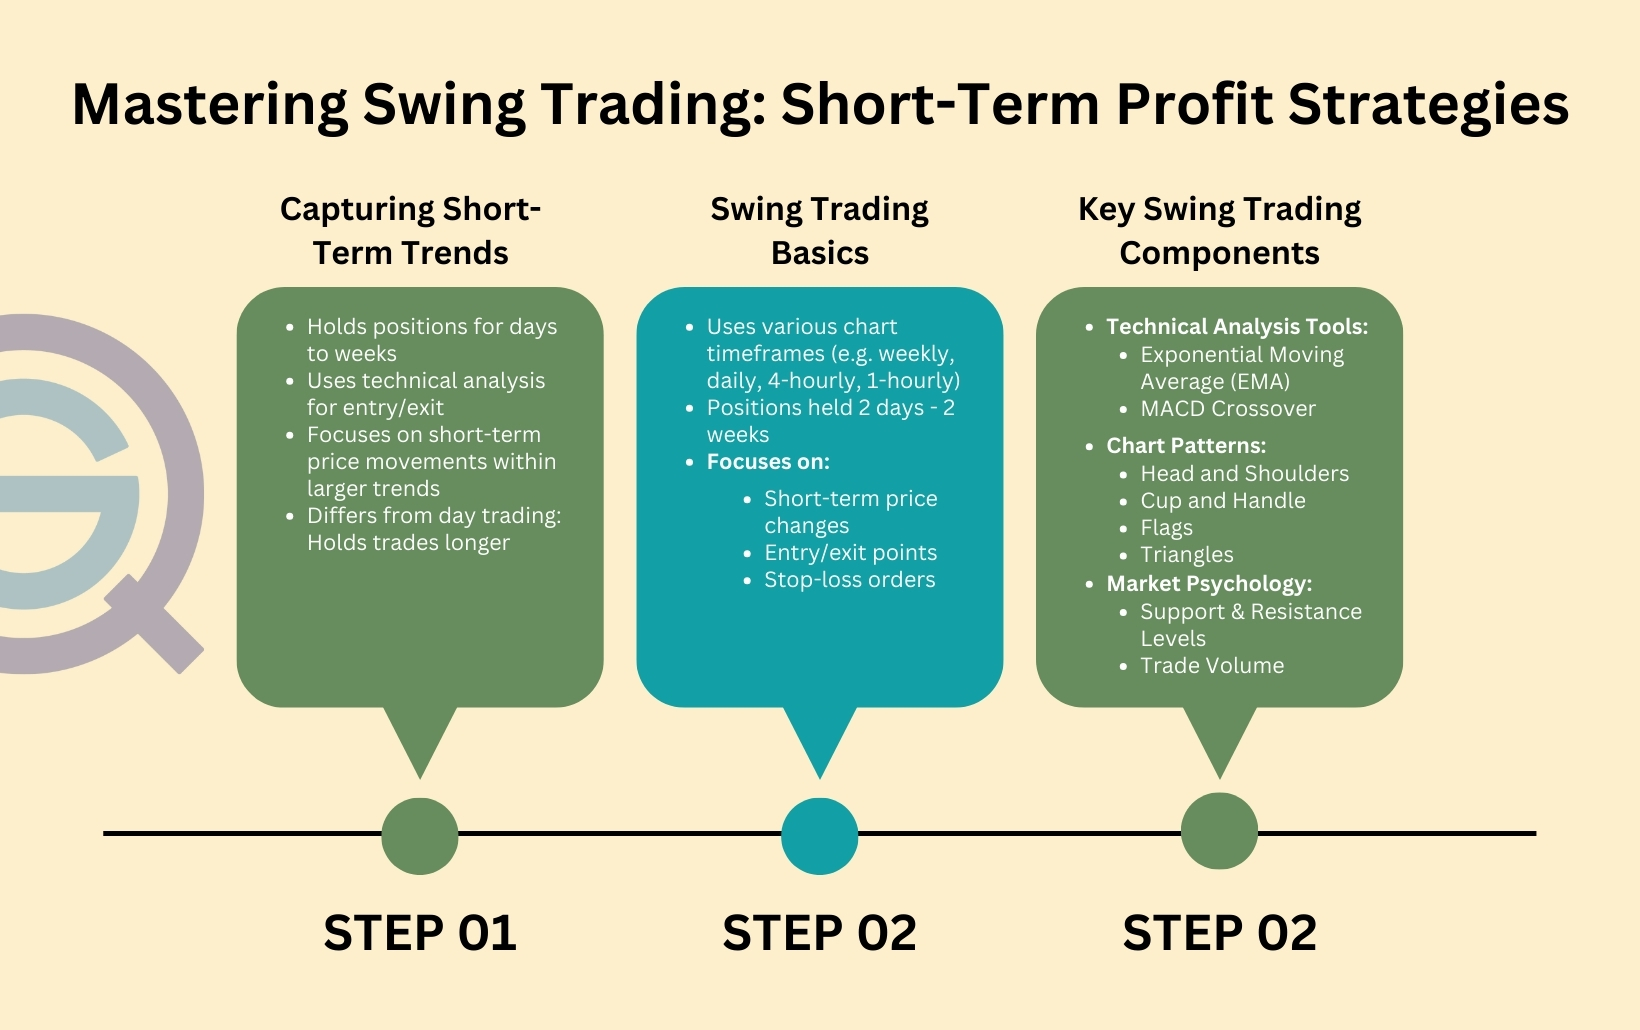
Yes, trend lines can be used for short-term trading strategies. They help identify immediate support and resistance levels, guiding quick entry and exit points. Traders draw trend lines on intraday charts to spot short-term momentum shifts and confirm price direction, making them valuable tools for day trading decisions.
How do I adjust trend lines in volatile markets?
Drag the trend line to fit recent price action, adjusting for quick swings in volatile markets. Use shorter time frames to capture rapid changes and update your trend lines frequently. Consider adding multiple trend lines at different angles to identify support and resistance zones amid market swings. Confirm with other indicators like moving averages or volume to validate the trend's strength. Keep the trend line flexible to adapt to sudden price jumps or drops.
What are the mistakes to avoid with trend lines?

Avoid drawing trend lines that aren’t based on at least two or three touchpoints; they need clear validation. Don’t connect random highs and lows without considering overall price movement—trend lines should reflect the dominant trend. Don't force trend lines where they don't fit; if the line breaks, don’t ignore it—reassess. Avoid overly angled trend lines that don’t match market behavior; they can give false signals. Don’t rely solely on trend lines for trading decisions; combine with volume, indicators, and price action. Lastly, don’t forget to adjust trend lines as new data emerges—markets evolve, and so should your lines.
How do I combine trend lines with other indicators?
To combine trend lines with other indicators in day trading charts, draw your trend lines first to identify price direction. Then, overlay indicators like Moving Averages, RSI, or MACD to confirm trend strength or potential reversals. Use trend lines to spot entry and exit points, and rely on indicators for timing and momentum confirmation. Avoid clutter by ensuring your trend lines and indicators complement each other without conflicting signals.
How can I practice drawing effective trend lines?
To practice drawing effective trend lines, start by analyzing real chart data—identify clear highs and lows, then draw lines that connect at least two points. Focus on trending markets—uptrend or downtrend—and ensure your lines touch multiple points without forcing them. Use different time frames to see how trends develop over short and long periods. Practice regularly, compare your lines with experienced traders' charts, and adjust for false breakouts. Keep it simple: accurate trend lines highlight the overall direction without overcomplicating.
Are there software or apps that enhance trend line analysis?
Yes, software like TradingView, ThinkorSwim, and MetaTrader 4/5 offer advanced trend line analysis tools. These platforms provide real-time drawing, customization, and automated trend line detection features. They help traders identify, verify, and analyze trend lines more efficiently.
Conclusion about How to Use Trend Lines in Day Trading Charts
Incorporating trend lines into your day trading strategy can significantly enhance your market analysis and decision-making. By mastering the techniques to draw, recognize breakouts, and confirm signals, traders can identify critical entry points and navigate volatile markets more effectively. Remember, while trend lines are powerful tools, they should be used in conjunction with other indicators to avoid common pitfalls. For more in-depth insights on utilizing trend lines and optimizing your trading approach, explore the resources available at DayTradingBusiness.
Learn about How to Use Charts to Manage Day Trading Risk