Did you know some traders can spot a head and shoulders pattern faster than they can find their car keys? Understanding chart patterns is essential for day traders looking to make informed decisions in the fast-paced market. This article delves into the most common chart patterns, including head and shoulders, double tops, and bottoms, as well as pennants and flags that signal trends. We’ll explore how to identify these patterns, their significance in predicting market movements, and the importance of volume trends in confirming signals. Additionally, we cover effective tools for analysis and common pitfalls to avoid. Join us at DayTradingBusiness as we sharpen your skills in chart pattern recognition and enhance your trading strategy.
What are the most common chart patterns used by day traders?
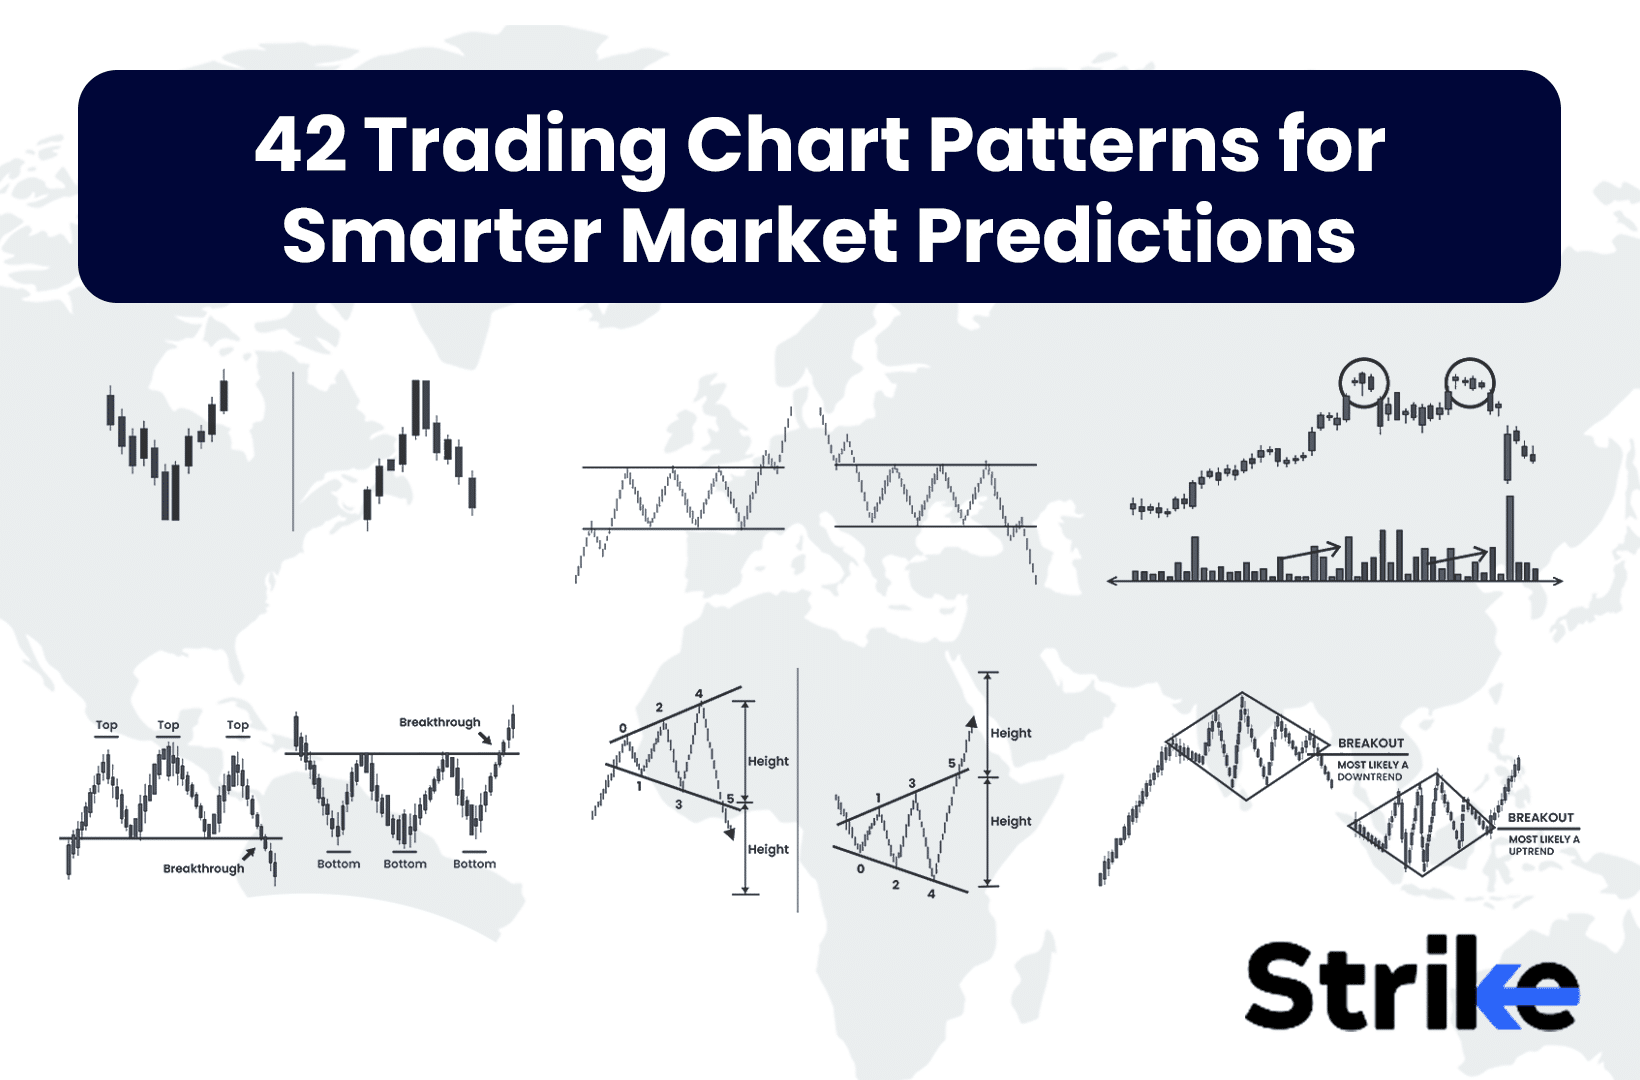
The most common chart patterns day traders use are head and shoulders, double tops and bottoms, triangles (symmetrical, ascending, descending), flags and pennants, wedges, cups and handles, and breakout patterns. These patterns signal potential trend reversals, continuations, or breakouts, helping traders make quick decisions.
How can I identify head and shoulders patterns in trading charts?
Look for a peak (head) flanked by two smaller peaks (shoulders) on the price chart. The head's high is noticeably higher than the shoulders, forming a clear M or W shape. Confirm the pattern with a neckline—draw a line connecting the lows between the shoulders and head. When the price breaks below (or above, for inverse patterns) this neckline with volume, it signals a potential trend reversal. Watch for the pattern's symmetry and the volume increase at breakout points for confirmation.
What is a double top and double bottom pattern, and how do they signal trend reversals?
A double top is a chart pattern where the price hits a high twice with a moderate drop in between, signaling a potential reversal from an uptrend to a downtrend. A double bottom is the opposite: the price hits a low twice with a rally in between, indicating a possible shift from a downtrend to an uptrend. Both patterns suggest the current trend is weakening and may reverse once the price breaks the neckline—support or resistance—confirming the trend change. Traders see these as early signals to exit long positions or enter shorts (double top) or to buy (double bottom).
How do pennant and flag patterns indicate short-term continuation?
Pennant and flag patterns signal short-term continuation when they form after a strong price move, with a brief consolidation in a small symmetrical triangle (pennant) or rectangular shape (flag). Breakouts above the pattern’s resistance confirm the pattern’s continuation, suggesting the trend will resume. Volume typically increases on the breakout, confirming the pattern’s validity. Traders see these patterns as signs that the current trend will continue shortly after the consolidation.
What are cup and handle patterns, and how do they predict bullish moves?
Cup and handle patterns are chart formations that signal a potential bullish breakout. The "cup" looks like a rounded bottom, indicating a period of decline followed by recovery, while the "handle" is a short consolidation or slight pullback after the cup. When the pattern completes with a breakout above the handle’s resistance, it suggests strong upward momentum. Traders see this as a signal to buy, expecting the stock to rise further.
How can I recognize ascending and descending triangle patterns?
An ascending triangle has a flat top resistance level with steadily rising lows, forming a horizontal line at the top and an upward-sloping trendline at the bottom. A descending triangle features a flat bottom support level with decreasing highs, creating a horizontal support line and a descending resistance line. Look for the flat side (either top or bottom) and the converging trendline that slopes in the opposite direction. The pattern’s breakout direction often signals the next price move: upward for ascending triangles, downward for descending triangles.
What is the significance of wedge patterns in day trading?
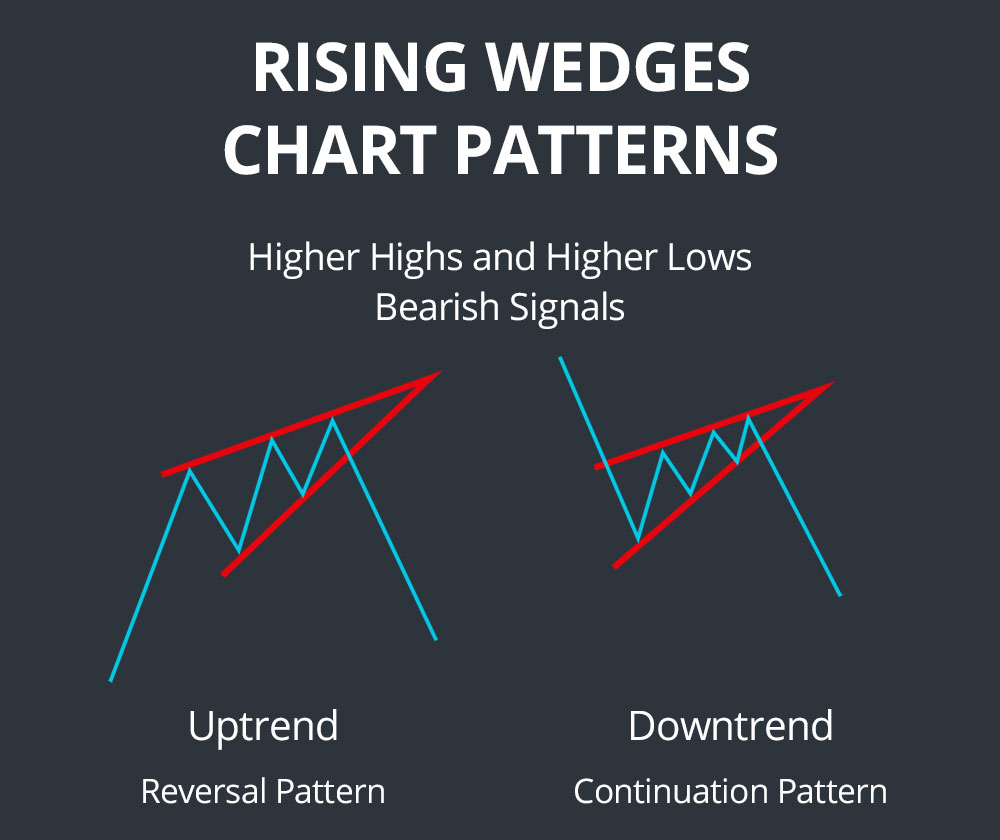
Wedge patterns signal potential trend reversals or continuations, helping day traders spot entry and exit points. Rising wedges often indicate a bearish reversal, while falling wedges suggest a bullish move. Recognizing these patterns improves timing and risk management in fast-paced trading.
How do breakout patterns help in making quick trading decisions?
Breakout patterns signal when a stock moves beyond support or resistance levels, indicating strong momentum. They help traders act quickly, capturing potential rapid price swings. Recognizing breakouts allows for timely entries and exits, reducing hesitation. These patterns reduce guesswork by confirming trend continuation or reversal. Overall, breakout patterns boost confidence in making swift trading decisions with clearer risk management.
What are channel patterns and how do they guide entry and exit points?
Channel patterns are price ranges where an asset moves between parallel support and resistance lines. They help traders spot potential entry points near support during an uptrend or bounce, and exit points near resistance. When price touches channel boundaries, it signals possible reversals or breakouts, guiding decisions on when to buy or sell. Recognizing these patterns improves timing for entries and exits, reducing false signals.
How do false breakouts affect trading based on chart patterns?
False breakouts can trap traders by making them think a pattern has confirmed, leading to premature entries or exits. They cause whipsaws, resulting in losses or missed opportunities. Relying solely on breakouts without confirmation increases risk of false signals. Recognizing false breakouts helps traders avoid false confidence and refine entries, using volume or other indicators to filter out fake moves.
What tools and indicators complement chart pattern analysis?
Tools like volume indicators, moving averages, and RSI help confirm chart pattern signals. Trendlines and support/resistance levels clarify pattern validity. Candlestick patterns provide additional entry or exit points. Oscillators like MACD and Stochastic add momentum context. Combining these with chart patterns improves trade accuracy.
How reliable are chart patterns in day trading?
Chart patterns in day trading can be useful but are not highly reliable on their own. They often indicate potential price movements but can produce false signals. Combining chart patterns with volume analysis, trend context, and other indicators improves their reliability. Relying solely on patterns risks losses since market behavior can defy these formations frequently. Use chart patterns as part of a broader, disciplined trading strategy.
Learn about How to Use Chart Patterns for Day Trading Analysis
How can I practice and improve pattern recognition skills?
Study chart patterns daily, focusing on common formations like head and shoulders, double tops/bottoms, and triangles. Use real-time trading charts to identify these patterns in past and current data. Practice drawing pattern lines and confirming signals with volume and price action. Review historical examples to understand pattern outcomes. Use trading simulations or paper trading to test pattern recognition under real market conditions. Consistently analyze multiple timeframes to sharpen your ability to spot patterns early.
What are common mistakes to avoid when trading chart patterns?

Avoid jumping into trades based on pattern signals without confirmation. Don’t ignore volume; it’s key to validating pattern breaks. Relying solely on pattern shape without considering market context leads to false signals. Overtrading pattern signals, especially during choppy markets, increases risk. Forgetting to set stop-losses exposes you to unnecessary losses if the pattern fails. Ignoring the pattern’s duration or failing to wait for a clear breakout can result in premature entries. Disregarding overall trend direction can cause counterproductive trades. Not practicing pattern recognition on a demo account first hampers your ability to spot reliable setups.
Learn about Common Mistakes in Day Trading Analysis to Avoid
How do volume trends confirm chart pattern signals?
Volume trends confirm chart pattern signals by increasing during breakouts or breakdowns, showing strong trader commitment. For example, rising volume on a breakout signals the pattern’s validity, while low volume suggests weakness. Consistent volume spikes at key pattern points validate the pattern’s direction. If volume declines during a pattern’s formation, it indicates a lack of interest, questioning the pattern’s reliability. In short, volume trends act as confirmation, reinforcing that the price movement aligns with the chart pattern’s expected breakout or reversal.
What are the differences between bullish and bearish chart patterns?
Bullish chart patterns indicate a potential price rise, signaling buying opportunities, like cup-and-handle or ascending triangles. Bearish chart patterns suggest a price decline, signaling selling or shorting chances, such as head and shoulders or descending triangles. Bullish patterns usually form at market lows or consolidations before upward moves, while bearish patterns appear at peaks or during pullbacks before downward trends. They help traders anticipate market direction and plan entries or exits accordingly.
Conclusion about Chart Patterns Every Day Trader Should Know
Incorporating chart patterns into your day trading strategy can enhance your decision-making process and improve your trading outcomes. Familiarizing yourself with key patterns like head and shoulders, double tops and bottoms, and flags can help identify potential market movements. While chart patterns are valuable tools, it’s essential to complement them with volume analysis and other indicators for more reliable signals. By practicing pattern recognition and avoiding common pitfalls, traders can refine their skills and make more informed trades. For comprehensive insights and support in mastering these techniques, consider leveraging the expertise offered by DayTradingBusiness.
Learn about Key Chart Patterns Every Day Trader Should Know
Sources:
- Direct least squares fitting of ellipses segmentation and prioritized ...
- Financial time series pattern matching with extended UCR Suite and ...
- The predictive power of Japanese candlestick charting in Chinese ...
- The Impact of US-China Trade Tensions
- The Round-the-Clock Market for U.S. Treasury Securities
- Price trends and patterns in technical analysis: A theoretical and ...