Did you know that the only thing more confusing than a cat on a hot tin roof is a day trading chart for beginners? In this article, we break down the essential aspects of reading day trading charts effectively. You’ll learn the basics, including how to interpret candlestick patterns, identify key indicators, and leverage support and resistance levels. We’ll also cover the significance of volume, the impact of moving averages, and the importance of chart time frames. Plus, discover common mistakes to avoid, how to use technical analysis tools, and the best charting platforms available. With insights from DayTradingBusiness, you’ll gain the confidence to read charts like a pro and make informed trading decisions while managing risk. Get ready to elevate your trading game!
What are the basics of day trading charts?
To read day trading charts effectively, focus on these basics:
1. Chart Types: Use candlestick charts for visualizing price movements. Each candlestick shows open, high, low, and close prices for a specific time frame.
2. Time Frames: Choose short time frames like 1-minute, 5-minute, or 15-minute charts for day trading. This helps capture quick price movements.
3. Volume: Pay attention to volume indicators. High volume can confirm trends and signal potential reversals.
4. Support and Resistance: Identify key support and resistance levels. These are price points where stocks tend to reverse or consolidate.
5. Indicators: Utilize technical indicators like Moving Averages, RSI, or MACD to spot trends and momentum.
6. Price Patterns: Learn to recognize patterns like head and shoulders, flags, and triangles, which can indicate future price movements.
7. Trend Lines: Draw trend lines to visualize upward or downward trends. They help in making informed decisions.
Focus on these elements to enhance your day trading strategy and make better-informed trades.
How do I interpret candlestick patterns in day trading?
To interpret candlestick patterns in day trading, focus on the following key elements:
1. Body Size: A long body indicates strong buying or selling pressure, while a short body suggests indecision.
2. Wicks: Long wicks show rejection of prices; an upper wick indicates sellers stepped in, while a lower wick suggests buyers did.
3. Patterns: Look for common patterns like doji (indecision), engulfing (reversal), and hammer (bullish reversal).
4. Trends: Analyze the context; patterns are more significant when aligned with the overall trend.
5. Volume: Confirm patterns with volume; higher volume signals stronger moves.
Use these components to gauge market sentiment and make informed trading decisions.
What indicators should I look for on day trading charts?
Look for key indicators like moving averages, RSI (Relative Strength Index), MACD (Moving Average Convergence Divergence), and Bollinger Bands. Moving averages help identify trends, while RSI shows overbought or oversold conditions. MACD signals potential reversals, and Bollinger Bands indicate volatility. Additionally, volume spikes can confirm price movements. Use candlestick patterns to gauge market sentiment and potential reversals. Focus on these indicators to make informed day trading decisions.
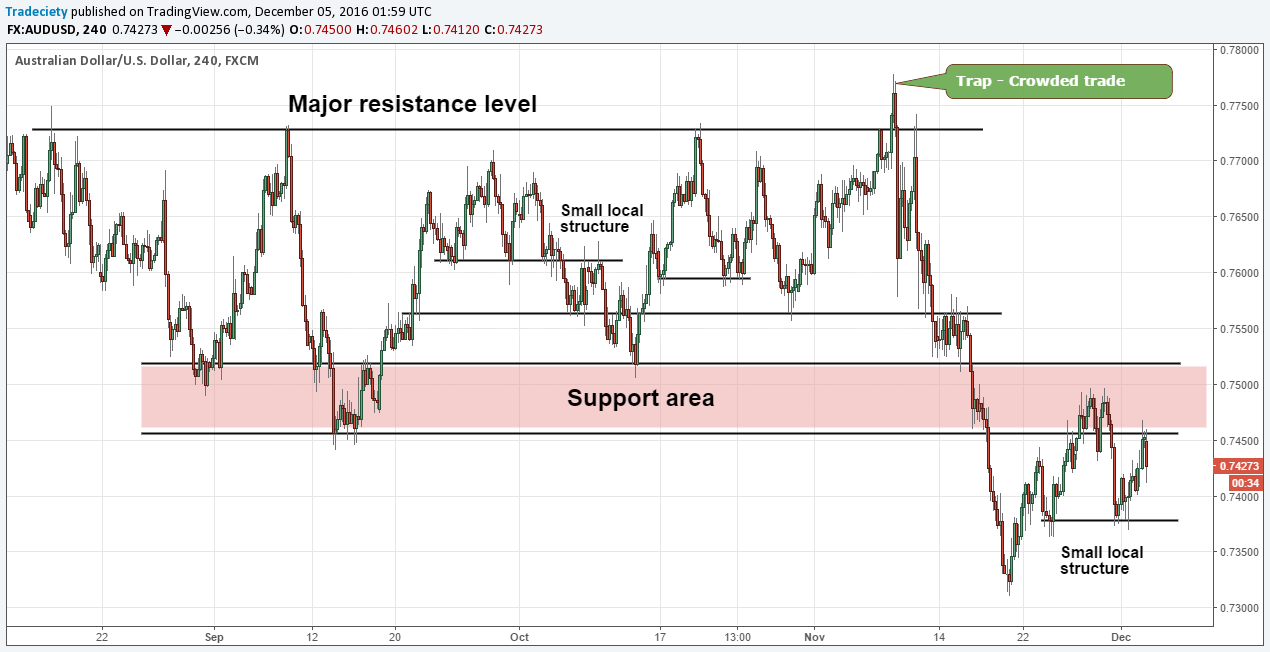
How can I use support and resistance levels effectively?
To use support and resistance levels effectively in day trading charts, identify key price points where the asset has historically reversed or stalled. Draw horizontal lines at these levels on your chart. Use support levels as potential buy points and resistance levels as sell points. Confirm these levels with indicators like volume spikes or price action patterns. Watch for breakouts; if the price breaks through resistance, it may signal a new uptrend. Conversely, if it falls below support, it could indicate a downtrend. Always set stop-loss orders to manage risk.
What is the significance of volume in day trading charts?
Volume in day trading charts indicates the number of shares traded during a specific period, which reveals market activity and liquidity. High volume often confirms price trends, signaling strong interest in a stock, while low volume can suggest weak momentum and potential reversals. Traders use volume to identify breakouts, determine entry and exit points, and assess the strength of price movements. Understanding volume helps you gauge whether a price move is sustainable or likely to fade.
How do moving averages enhance day trading strategies?
Moving averages enhance day trading strategies by smoothing out price data, helping traders identify trends and potential reversal points. They provide clear signals for entry and exit points. For example, a short-term moving average crossing above a long-term moving average can indicate a buying opportunity, while the opposite suggests selling. Traders often use different types of moving averages, like simple and exponential, to adapt to market conditions. By analyzing these averages on day trading charts, traders can make more informed decisions based on current price momentum.
What role does chart time frame play in day trading?
The chart time frame in day trading determines the granularity of price movements you observe. Shorter time frames, like 1-minute or 5-minute charts, provide rapid insights into price fluctuations, making them ideal for quick trades. Longer time frames, such as 15-minute or 1-hour charts, offer a broader view, helping to identify trends and support/resistance levels. Choosing the right time frame impacts your trading strategy; faster frames suit scalping, while slower frames work for swing trades. Ultimately, the time frame affects your decision-making speed and risk management in day trading.
How can I identify trends using day trading charts?
To identify trends using day trading charts, focus on these key steps:
1. Use Moving Averages: Apply simple or exponential moving averages to smooth out price action and highlight the trend direction.
2. Look for Higher Highs and Higher Lows: An uptrend features higher highs and higher lows, while a downtrend shows lower highs and lower lows.
3. Check Trend Lines: Draw trend lines connecting the highs or lows to visualize the trend's slope.
4. Analyze Volume: Rising volume during price increases indicates a strong trend, while decreasing volume can signal weakness.
5. Candlestick Patterns: Watch for patterns like engulfing or hammer candles that can indicate reversals or continuations within the trend.
6. Relative Strength Index (RSI): Use RSI to determine overbought or oversold conditions, helping you confirm trends.
7. Chart Timeframes: Analyze multiple timeframes (e.g., 5-minute, 15-minute) to get a clearer picture of the trend's strength and direction.
By combining these methods, you can effectively identify and capitalize on trends in day trading charts.
What are the common mistakes to avoid when reading charts?
1. Ignoring the trend: Always identify the overall trend before making decisions.
2. Overcomplicating indicators: Stick to a few essential indicators; too many can confuse you.
3. Neglecting volume: Volume is crucial for confirming price movements.
4. Failing to set stop-loss orders: Protect your capital by always having a stop-loss in place.
5. Relying solely on past performance: Past trends don’t guarantee future results; stay adaptable.
6. Chasing prices: Don't buy when prices are soaring; wait for pullbacks to find better entries.
7. Overtrading: Avoid excessive trades; focus on quality setups instead.
8. Not using timeframes effectively: Different timeframes provide different insights; use them wisely.
9. Ignoring news events: Market-moving news can affect chart patterns significantly.
10. Letting emotions drive decisions: Stick to your strategy and avoid impulsive reactions.
How do I use technical analysis tools in day trading?
To effectively use technical analysis tools in day trading, start with chart types like candlestick or line charts for clear price movement visualization. Use indicators such as Moving Averages to identify trends, RSI to gauge overbought or oversold conditions, and MACD for momentum shifts. Set up support and resistance levels to determine entry and exit points. Always combine these tools with volume analysis to confirm signals. Practice interpreting patterns like flags or head and shoulders to predict future price movements. Finally, keep a trading journal to refine your strategy based on past trades and outcomes.
Learn about How to Use Technical Analysis for Day Trading ETFs
What is the importance of chart patterns in day trading?
Chart patterns are crucial in day trading because they help identify potential price movements and trends. Patterns like flags, head and shoulders, and triangles signal where the market might head next. Recognizing these formations allows traders to make informed decisions, set entry and exit points, and manage risk effectively. By understanding chart patterns, day traders can enhance their strategies and improve their chances of profitability.
How can I combine multiple indicators for better trading decisions?
To combine multiple indicators for better trading decisions, first choose a mix that complements each other—like a trend indicator (e.g., Moving Average), a momentum indicator (e.g., RSI), and a volume indicator (e.g., Volume Oscillator). Use the trend indicator to identify the direction of the market, the momentum indicator to gauge the strength of that trend, and the volume indicator to confirm the validity of price movements.
For example, if the Moving Average shows an uptrend, and the RSI indicates overbought conditions, you might consider a pullback. When you see high volume accompanying a price move, it reinforces your decision. Always backtest your strategy to ensure it aligns with your trading style and risk tolerance.
What should I know about price action analysis?
Price action analysis focuses on historical price movements to make trading decisions. Key aspects include understanding candlestick patterns, support and resistance levels, and trend lines. Look for price patterns like flags, triangles, and head and shoulders to identify potential reversals or continuations.
Monitor volume alongside price changes; increasing volume can confirm trends or breakouts. Use time frames that suit your trading style; day traders often prefer shorter intervals like 1-minute or 5-minute charts. Practice reading charts regularly to recognize patterns quickly and improve your decision-making.
How do I manage risk while interpreting day trading charts?
To manage risk while interpreting day trading charts, follow these steps:
1. Set Stop-Loss Orders: Always define a stop-loss level to limit potential losses on each trade.
2. Use Position Sizing: Determine the appropriate amount to invest based on your account size and risk tolerance.
3. Analyze Trends: Focus on identifying clear uptrends or downtrends to guide your trades.
4. Employ Technical Indicators: Use indicators like RSI or MACD to confirm entry and exit points, helping to mitigate risk.
5. Practice Risk-to-Reward Ratios: Aim for a minimum of 1:2 risk-to-reward ratio to ensure potential gains outweigh losses.
6. Stay Informed: Monitor news and events that could impact market conditions and volatility.
7. Keep Emotions in Check: Stick to your trading plan and avoid impulsive decisions based on fear or greed.
Implementing these strategies can enhance your risk management while effectively reading day trading charts.
Learn about How to Use Charts to Manage Day Trading Risk
What are the best charting platforms for day traders?
The best charting platforms for day traders include:
1. TradingView: Offers advanced charting tools, social networking features, and a wide range of indicators.
2. Thinkorswim: Provides comprehensive technical analysis features and real-time data from TD Ameritrade.
3. MetaTrader 4/5: Popular for forex trading; supports automated trading and numerous indicators.
4. NinjaTrader: Ideal for futures and forex, with powerful charting capabilities and backtesting features.
5. eSignal: Offers high-quality charts, extensive market data, and advanced analytics.
Choose based on your trading style, asset class, and required features.
How can I practice reading charts without risking real money?
You can practice reading day trading charts without risking real money by using a demo trading account. Many platforms like TD Ameritrade, E*TRADE, and TradingView offer simulated trading environments. These allow you to analyze charts, test strategies, and make trades with virtual currency. Additionally, you can use charting software to study historical data and patterns. Engaging in online trading communities or forums can also provide insights and feedback on your chart-reading skills.
Conclusion about How to Read Day Trading Charts Effectively
In summary, mastering day trading charts is essential for making informed trading decisions. Understanding the basics, interpreting candlestick patterns, and utilizing key indicators, such as moving averages and volume, can significantly enhance your strategies. Recognizing support and resistance levels, avoiding common mistakes, and effectively applying technical analysis will further improve your trading skills. By practicing without real financial risk, you can refine your abilities and build confidence. For comprehensive guidance and support on your trading journey, remember that DayTradingBusiness is here to help you navigate the complexities of the market.
Learn about How to Read Day Trading Charts Effectively