Did you know that some traders believe they can predict market moves better than a crystal ball? While the mystical approach might not hold up, understanding how to combine different chart patterns can significantly enhance your day trading success. In this article, we’ll explore the best patterns to combine, how to identify complementary patterns, and the benefits of using multiple patterns in your trading strategy. We’ll also cover common mistakes to avoid, the impact of volume and momentum, and essential tools for analyzing patterns effectively. Learn how to create a well-rounded strategy, backtest your methods, and adjust your risk management when combining patterns. With insights into popular pattern combinations and tips for staying disciplined, this guide will equip you with the knowledge to elevate your trading game. Dive in with DayTradingBusiness for expert tips and resources to master the art of pattern combination in day trading!
What are the best patterns to combine for day trading?
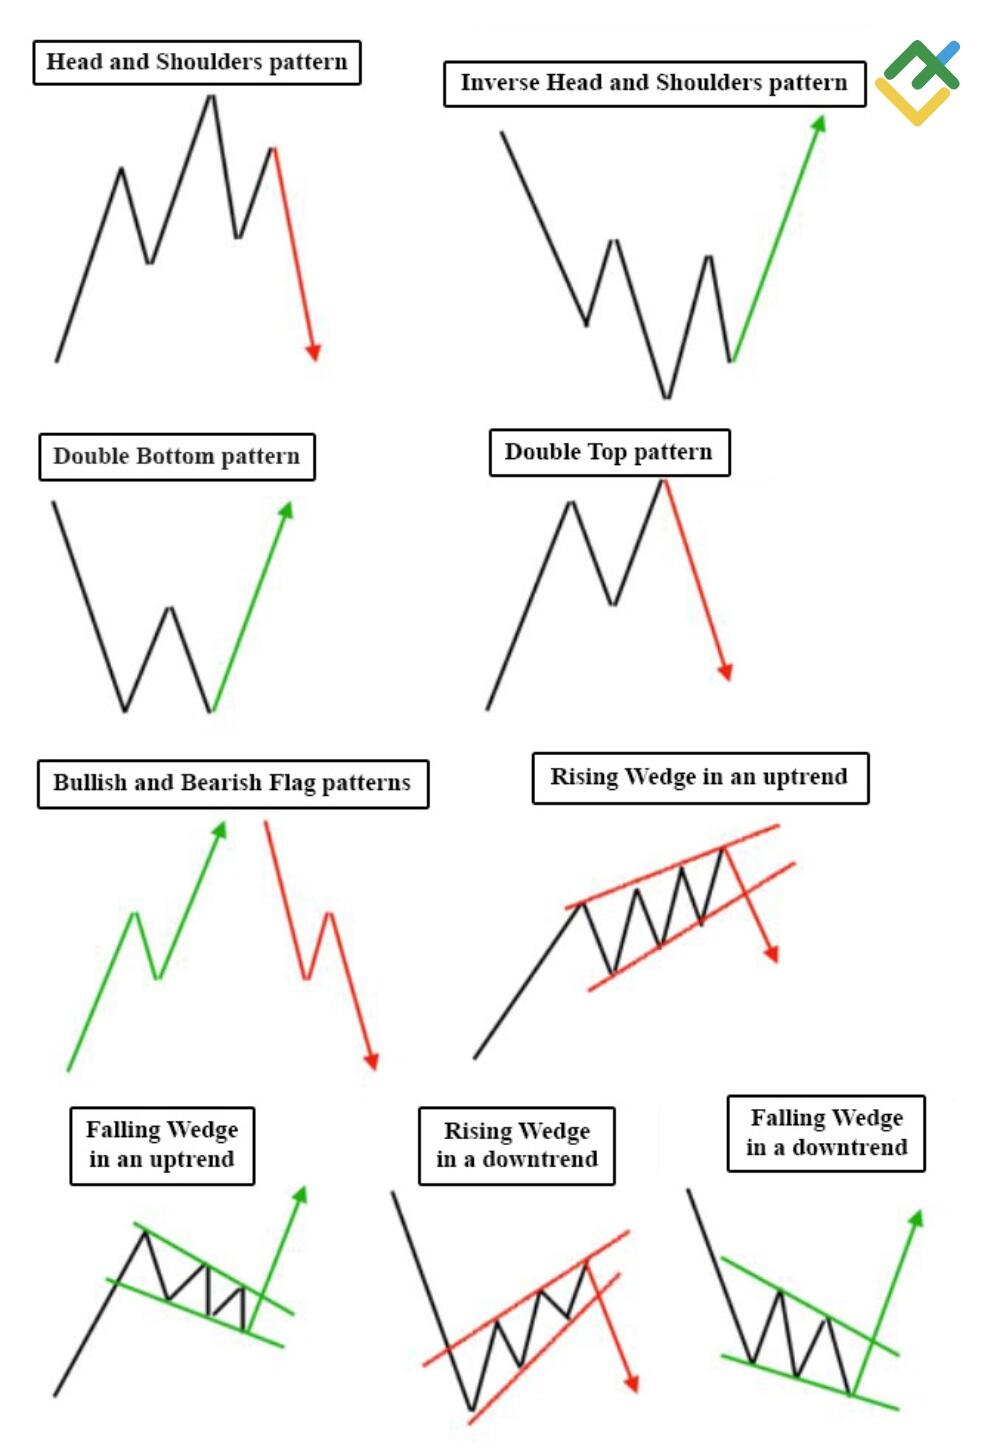
The best patterns to combine for day trading include:
1. Bullish and Bearish Flags: Use these for trend continuation signals.
2. Head and Shoulders with Volume: Confirm reversals by checking volume spikes.
3. Double Tops and Bottoms: Pair with RSI for overbought or oversold conditions.
4. Triangles (Ascending and Descending): Combine with breakout momentum indicators.
5. Candlestick Patterns with Moving Averages: Look for confirmation from MA crossovers.
Combining these patterns enhances your strategy’s reliability and helps identify entry and exit points effectively.
How do I identify complementary patterns in day trading?
To identify complementary patterns in day trading, focus on these steps:
1. Use Multiple Time Frames: Analyze charts across different time frames—like 1-minute and 5-minute charts—to spot converging patterns.
2. Look for Confirmation: Identify a primary pattern, such as a flag or wedge, and seek confirmation from secondary patterns, like MACD divergences or candlestick formations.
3. Combine Indicators: Use technical indicators like RSI or moving averages alongside pattern recognition to validate signals.
4. Check Volume: Ensure volume supports the patterns; higher volume during breakouts enhances reliability.
5. Practice Scanning: Regularly scan charts using trading software to identify recurring patterns that align over time.
By blending these approaches, you can effectively spot and leverage complementary patterns in your day trading strategy.
What are the benefits of using multiple patterns in day trading?
Using multiple patterns in day trading enhances your strategy by providing a broader perspective on market movements. It increases the likelihood of identifying profitable entries and exits. Different patterns can confirm each other, reducing risk and improving decision-making. For example, combining candlestick patterns with trend lines can reveal stronger signals. Multiple patterns also help adapt to varying market conditions, allowing for more flexible trading strategies. Overall, this approach enhances accuracy and can lead to higher profitability in day trading.
How can I effectively combine chart patterns for better trades?
To effectively combine chart patterns for better trades, start by identifying multiple patterns on the same chart. Look for confluence where patterns intersect, like a head and shoulders pattern aligning with a trendline break. Use volume analysis to confirm signals; increased volume on pattern breakout strengthens the trade. Consider timeframes: a daily pattern may align with an hourly pattern for stronger conviction. Always set clear entry and exit points based on combined patterns to manage risk. Lastly, backtest your strategy on historical data to refine your approach.
What common mistakes should I avoid when combining patterns?
When combining patterns for day trading, avoid these common mistakes:
1. Overcomplicating: Don't use too many patterns at once; stick to two or three that complement each other.
2. Ignoring Timeframes: Ensure the patterns align within the same timeframe to avoid conflicting signals.
3. Neglecting Volume: Always consider volume; patterns without sufficient volume may lead to false signals.
4. Lack of Risk Management: Don’t forget to set stop-loss orders; protect your capital against unexpected moves.
5. Forgetting Market Context: Always analyze the broader market conditions; patterns can behave differently in varying market environments.
6. Blindly Following Patterns: Avoid relying solely on patterns without confirming with other indicators or analysis tools.
Stay disciplined and test your strategies before committing significant capital.
How do volume and momentum affect pattern combinations in day trading?
Volume and momentum are crucial for combining patterns in day trading. High volume confirms the strength of a price movement, making patterns like breakouts more reliable. For instance, if a stock shows a bullish flag pattern with increasing volume, it suggests strong buying interest, likely leading to a successful breakout.
Momentum, on the other hand, helps identify the direction and speed of price movements. Combining patterns like moving averages with momentum indicators (like RSI or MACD) can signal entry points. For example, if a stock forms a double bottom pattern while momentum indicators show upward movement, it reinforces the likelihood of a bullish reversal.
In summary, use high volume to validate patterns and momentum to gauge the strength of potential trades for effective day trading strategies.
What tools can help me analyze multiple patterns at once?
To analyze multiple patterns for day trading, consider using these tools:
1. TradingView: Offers advanced charting features and the ability to overlay multiple indicators and patterns in real-time.
2. MetaTrader 4/5: Supports custom indicators and scripts for pattern recognition, allowing simultaneous analysis.
3. TrendSpider: Automates technical analysis, identifying multiple patterns and trends simultaneously.
4. Thinkorswim: Provides robust charting tools with customizable studies for analyzing various patterns at once.
5. StockCharts: Features multi-chart views and technical indicators to compare patterns across different stocks.
These tools enhance your ability to spot trends and make informed trading decisions.
How do I create a strategy using different trading patterns?
To create a strategy using different trading patterns for day trading, follow these steps:
1. Identify Patterns: Familiarize yourself with key trading patterns like head and shoulders, flags, triangles, and double tops/bottoms.
2. Set Criteria: Define entry and exit points for each pattern. For example, use the breakout point for triangles or the neckline for head and shoulders.
3. Combine Patterns: Use multiple patterns to confirm trades. If a flag forms after a breakout from a triangle, it can strengthen your entry signal.
4. Risk Management: Establish stop-loss and take-profit levels based on the patterns’ historical performance. This helps minimize losses and secure profits.
5. Backtest Your Strategy: Use historical data to test how your combined patterns would have performed. Adjust your criteria as needed.
6. Monitor and Adjust: As you trade, keep track of your results. Refine your strategy based on what works and what doesn’t.
By integrating various trading patterns with clear criteria and strong risk management, you can enhance your day trading strategy.
What role do market conditions play in pattern combinations?
Market conditions significantly influence pattern combinations in day trading. In a trending market, combining patterns like flags and pennants can signal continuation, while in a ranging market, patterns such as double tops or bottoms may indicate reversals. Understanding volatility also matters; high volatility can validate breakouts, while low volatility might lead to false signals. Always adapt your strategy based on whether the market is bullish, bearish, or sideways to maximize your trading effectiveness.
How can I backtest my pattern combination strategies?
To backtest your pattern combination strategies for day trading, follow these steps:
1. Select a Backtesting Tool: Use software like TradingView, MetaTrader, or Thinkorswim that supports custom scripts.
2. Define Your Patterns: Clearly the specific patterns you want to combine, such as head and shoulders, flags, or double tops.
3. Create Entry and Exit Rules: Specify when to enter a trade based on your pattern combinations and define your stop-loss and take-profit levels.
4. Import Historical Data: Load historical price data relevant to your trading strategy.
5. Run the Backtest: Execute the backtest using your defined rules to simulate trades over a specified historical period.
6. Analyze Results: Review key metrics like win rate, profit factor, and maximum drawdown to evaluate performance.
7. Refine Your Strategy: Adjust your patterns or rules based on the backtest results and retest.
Repeat this process until you achieve satisfactory results.
What are the most popular pattern combinations among successful day traders?
Successful day traders often combine these popular pattern combinations:
1. Double Tops and Bottoms with Volume: Use these reversal patterns alongside volume spikes to confirm trend shifts.
2. Head and Shoulders with Moving Averages: Pair this classic reversal pattern with moving averages to identify entry and exit points.
3. Flags and Pennants with Breakouts: Look for these continuation patterns during strong trends to time your trades effectively.
4. Candlestick Patterns with Support and Resistance: Combine candlestick formations, like doji or engulfing patterns, with key support and resistance levels for precise entries.
5. Bullish and Bearish Divergence with RSI: Use divergence signals alongside the RSI indicator to spot potential market reversals.
Combining these patterns enhances decision-making and increases the likelihood of successful trades.
How do I adjust my risk management when using multiple patterns?
To adjust your risk management when using multiple patterns in day trading, follow these steps:
1. Assess Each Pattern: Determine the risk and reward ratio for each pattern you trade. This helps you understand potential gains versus losses.
2. Diversify Exposure: Limit your capital allocation to each pattern. Don’t risk more than 1-2% of your trading capital on a single trade.
3. Set Stop Losses: Use tight stop losses based on the specific patterns. Adjust them according to the volatility of each pattern.
4. Monitor Correlations: Be aware of how patterns may correlate with each other. Avoid overexposing yourself to similar risks.
5. Review Performance: Regularly evaluate how each pattern performs. Adjust your risk based on historical data and your trading results.
6. Adjust Position Sizes: Use smaller position sizes for patterns with less conviction and larger sizes for those with higher confidence.
7. Stay Flexible: Be ready to adapt your strategy as market conditions change. Patterns that worked previously may not always be reliable.
By implementing these strategies, you can effectively manage risk while leveraging multiple trading patterns.
What indicators should I consider when combining patterns?
When combining patterns for day trading, consider these indicators:
1. Volume: Look for increased volume to validate the strength of the pattern.
2. Moving Averages: Use short-term moving averages to identify trend direction and potential entry points.
3. Support and Resistance Levels: Check if patterns form near key support or resistance, enhancing their reliability.
4. RSI (Relative Strength Index): Use RSI to assess whether an asset is overbought or oversold, indicating potential reversals.
5. MACD (Moving Average Convergence Divergence): Look for MACD crossovers to confirm momentum before entering trades.
6. Bollinger Bands: Use them to identify volatility and potential breakout points when patterns align.
Combining these indicators with your patterns can strengthen your trading strategy.
How can I use candlestick patterns alongside chart patterns?
To use candlestick patterns alongside chart patterns in day trading, first identify key chart patterns like triangles or head and shoulders. Then, look for confirming candlestick patterns at breakout points. For example, if a triangle pattern breaks out upward and you see a bullish engulfing candle, it signals a stronger buy opportunity. Use candlestick patterns to gauge market sentiment—look for reversal patterns like dojis or hammers near support or resistance levels. Always consider volume; increased volume on breakout with candlestick confirmation increases reliability.
Learn about How to Use Chart Patterns for Day Trading Analysis
What resources are available for learning about pattern combinations?

Resources for learning about pattern combinations in day trading include:
1. Online Courses: Platforms like Udemy and Coursera offer courses specifically on technical analysis and pattern recognition.
2. Books: Titles like "Technical Analysis of the Financial Markets" by John Murphy and "Candlestick Charting Explained" by Gregory Morris cover various patterns and their combinations.
3. YouTube Channels: Channels like "Warrior Trading" and "The Trading Channel" provide free video tutorials on combining patterns effectively.
4. Webinars: Look for webinars hosted by trading platforms like TradeStation or Thinkorswim that focus on technical analysis and pattern strategies.
5. Trading Forums: Engage in forums like Elite Trader or Reddit’s r/Daytrading to discuss pattern combinations with other traders.
6. Demo Accounts: Use platforms like TradingView or MetaTrader to practice combining patterns in real-time without financial risk.
7. Blogs and Articles: Websites like Investopedia and StockCharts offer articles on specific patterns and their combinations in trading.
Utilizing these resources can enhance your understanding of how to effectively combine different patterns in day trading.
How do I stay disciplined when trading multiple patterns?
To stay disciplined when trading multiple patterns, create a clear plan outlining your strategies for each pattern. Set specific entry and exit points based on backtesting. Stick to your risk management rules—never risk more than a small percentage of your capital on a single trade. Use a trading journal to track your trades and emotions, which helps maintain focus and accountability. Schedule regular reviews to assess your performance and adjust strategies as needed. Lastly, limit distractions during trading hours to stay concentrated on your patterns.
Learn about How to Stay Disciplined While Day Trading Scalping
Conclusion about How to Combine Different Patterns for Day Trading
Incorporating multiple trading patterns can significantly enhance your day trading strategy. By understanding the best patterns to combine, identifying their complementary nature, and using the right tools, you can make informed decisions that improve trade outcomes. Be mindful of market conditions, volume, and momentum when crafting your strategy, and always prioritize risk management. Avoid common pitfalls and maintain discipline to maximize your success. For deeper insights and resources on mastering pattern combinations, explore what DayTradingBusiness has to offer.
Learn about How to Adapt Day Trading Patterns to Different Markets
Sources:
- Shortlisting machine learning-based stock trading recommendations ...
- A review of hybrid renewable energy systems: Solar and wind ...
- Day-of-the-week effect in the Taiwan foreign exchange market ...
- A novel strongly-typed Genetic Programming algorithm for ...
- NBER WORKING PAPER SERIES KNOW YOUR CUSTOMER ...