Did you know that the average person walks the equivalent of five times around the world in their lifetime? Just like that journey, navigating the world of day trading requires a solid understanding of various tools and metrics—one of the most crucial being volume analysis. This article delves into the significance of volume in day trading, covering its impact on price movements, volatility, and how to interpret trends across different markets like stocks, Forex, and cryptocurrencies. You'll discover key volume indicators, common patterns to watch for, and strategies that can enhance your trading decisions. With insights from DayTradingBusiness, you'll learn how to effectively track and analyze volume changes, avoid common pitfalls, and leverage the best tools for successful trading.
What is Volume Analysis in Day Trading?
Volume analysis in day trading involves examining the number of shares or contracts traded during a specific period to assess market strength and potential price movements. High volume often indicates strong interest, confirming trends, while low volume may suggest weak momentum. In stocks, it helps identify breakouts or reversals. In forex, it aids in spotting liquidity and market participation. In futures, it reveals trader sentiment and can signal potential volatility. Overall, volume analysis is crucial for making informed trading decisions across different markets.
Why is Volume Important for Day Trading?
Volume is crucial for day trading because it indicates the strength of a price move. High volume suggests strong interest and can confirm trends, while low volume may signify weakness or potential reversals. In markets like stocks, futures, or forex, analyzing volume helps traders identify entry and exit points, gauge liquidity, and assess volatility. For example, a stock with a price surge on high volume is more likely to continue moving in that direction than one with low volume. Understanding volume patterns allows traders to make informed decisions and manage risks effectively.
How to Interpret Volume Trends in Different Markets?
To interpret volume trends in different markets for day trading, focus on these key points:
1. Increasing Volume: Signals strong interest and can indicate potential price trends. In stocks, rising volume during an uptrend often confirms bullish momentum.
2. Decreasing Volume: Suggests weakening interest. In Forex, this may indicate consolidation or a potential reversal.
3. Volume Spikes: Sudden increases can signal news events or market reactions. In commodities, a spike might precede a price breakout.
4. Volume Relative to Price: Analyze volume alongside price movements. If prices rise with high volume, it’s more convincing than if they rise with low volume.
5. Market Context: Different markets (stocks, Forex, crypto) might react differently to volume changes. Understand the specific characteristics of each market.
6. Use Volume Indicators: Tools like On-Balance Volume (OBV) or the Volume Moving Average can help visualize trends and confirm signals.
By closely monitoring these aspects, you can better interpret volume trends and make informed trading decisions.
What Are the Key Volume Indicators for Day Traders?
Key volume indicators for day traders include:
1. Volume: The basic measure of shares or contracts traded in a specific period. High volume often indicates strong interest and potential price movements.
2. Average Volume: Averages out volume over a set period to identify trends. Compare current volume to this average to spot unusual activity.
3. Volume Percentage: Measures current volume as a percentage of average volume. A high percentage can signal a breakout or reversal.
4. On-Balance Volume (OBV): Combines price movement and volume to show buying or selling pressure. A rising OBV suggests bullish sentiment, while a falling OBV indicates bearish.
5. Chaikin Money Flow (CMF): Measures the accumulation and distribution of volume over time. A positive CMF indicates buying pressure, while a negative CMF suggests selling.
6. Accumulation/Distribution Line: Assesses whether a stock is being accumulated or distributed based on volume and price. A rising line indicates accumulation, and a declining line suggests distribution.
7. Volume Spike: Sudden increases in volume can indicate significant market events or reversals. Look for spikes alongside price changes for confirmation.
Use these indicators to gauge market sentiment and make informed trading decisions.
How Does Volume Affect Price Movements in Day Trading?
Volume significantly affects price movements in day trading by indicating the strength of a price trend. High volume often confirms a price move, suggesting strong interest and participation from traders, which can lead to sustained trends. Conversely, low volume may signal weak interest, causing price movements to be less reliable and more prone to reversals. In markets like stocks, forex, or cryptocurrencies, analyzing volume can help traders identify potential entry and exit points, revealing whether a price change is backed by solid trading activity or merely a fleeting shift.
What is the Relationship Between Volume and Volatility?

Volume and volatility are closely linked in day trading. Higher trading volume often indicates increased interest in a security, which can lead to greater price swings, or volatility. When volume surges, it typically signals that many traders are entering or exiting positions, causing rapid price movements. Conversely, low volume can lead to reduced volatility, as fewer trades may result in less dramatic price changes. In summary, rising volume tends to correlate with higher volatility, while declining volume often indicates a more stable price environment.
How Can I Use Volume Analysis in Forex Trading?
To use volume analysis in Forex trading, start by observing volume spikes during currency pair movements. High volume often indicates strong momentum, signaling potential entry or exit points. Use volume indicators like the On-Balance Volume (OBV) or Volume Weighted Average Price (VWAP) to confirm trends. Look for divergences between price and volume; for example, if price rises but volume falls, it may suggest a reversal. Additionally, combine volume analysis with other indicators like moving averages or RSI for more robust signals. Always consider the context of economic news, as high-impact releases can significantly affect volume and price action.
What Role Does Volume Play in Stock Market Day Trading?
Volume indicates the number of shares traded within a specific timeframe and is crucial for day trading. High volume often confirms price movements, signaling strength in trends. It helps traders identify potential breakouts or reversals; low volume may suggest weak momentum. Understanding volume allows day traders to make informed decisions, as it reflects market interest and liquidity. In different markets, like Forex or commodities, volume can indicate market sentiment and enhance trade timing.
How to Analyze Volume in Cryptocurrency Markets?
To analyze volume in cryptocurrency markets for day trading, follow these steps:
1. Use Volume Indicators: Check volume bars on price charts to see buying and selling activity. Higher volume typically indicates stronger trends.
2. Compare with Price Movements: Look for volume spikes during price increases or decreases. A price rise with high volume suggests a strong trend, while low volume may indicate a reversal.
3. Assess Volume Patterns: Identify patterns like accumulation (increasing volume with price stability) or distribution (high volume at price peaks) to gauge market sentiment.
4. Analyze Relative Volume: Compare current volume to average volume over a specific period to identify unusual activity. This helps spot potential breakouts or reversals.
5. Consider Market Context: Look at news, events, and market sentiment that may impact volume. High-profile announcements can lead to spikes in trading activity.
6. Utilize Tools: Use trading platforms that offer volume analysis tools, like Moving Average Volume or On-Balance Volume, to visualize trends effectively.
By focusing on these aspects, you can gain insights into market behavior and make informed trading decisions.
What Are Common Volume Patterns to Watch in Day Trading?
Common volume patterns to watch in day trading include:
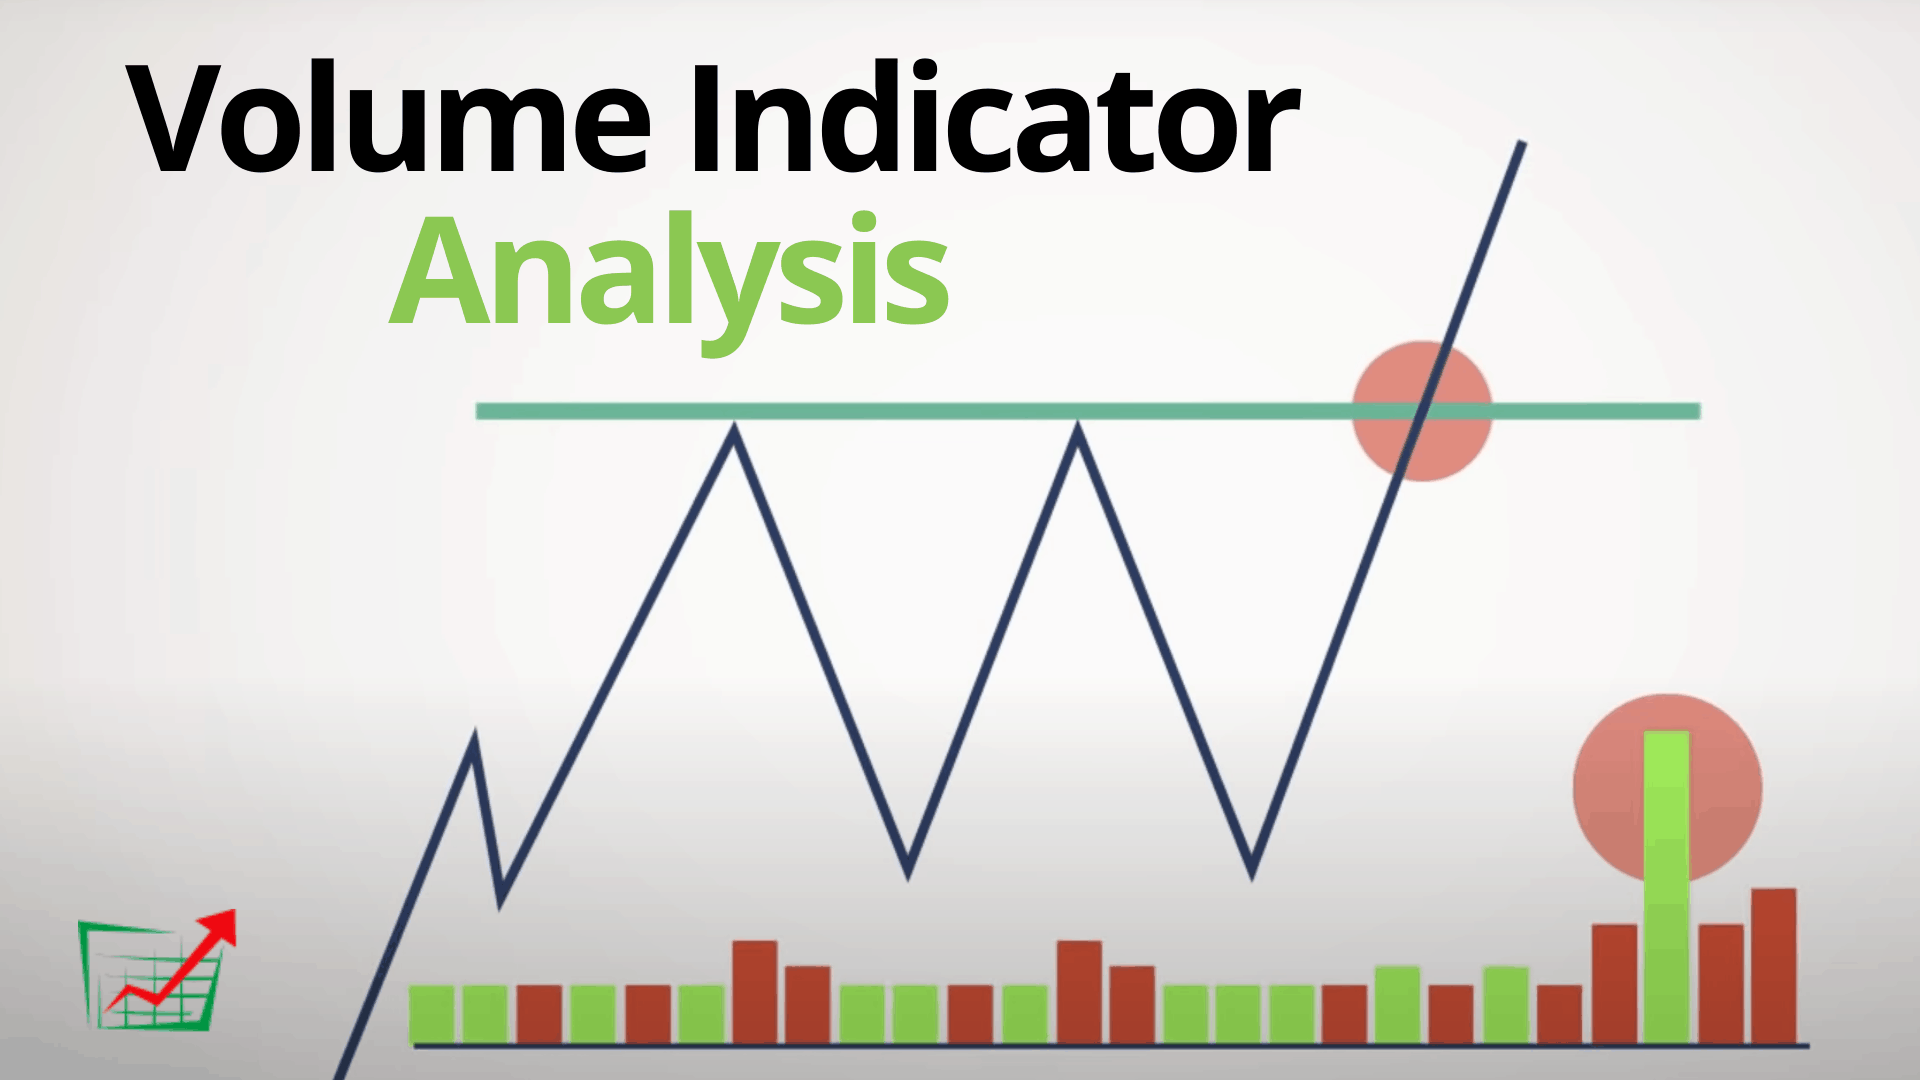
1. Increased Volume on Breakouts: High volume during a price breakout indicates strong momentum and confirms the trend.
2. Volume Spikes at Support/Resistance: Sudden increases in volume at key support or resistance levels can signal potential reversals or continuation.
3. Volume Drying Up: Decreasing volume during a price consolidation suggests a potential breakout or breakdown.
4. Climactic Volume: Extremely high volume at market tops or bottoms can indicate exhaustion and possible trend reversals.
5. Volume Divergence: When price moves in one direction while volume trends in the opposite direction, it may signal a weakening trend.
Monitoring these patterns can help identify potential trading opportunities.
Learn about Common Volume Patterns in Day Trading
How Can I Identify High Volume Trading Opportunities?
To identify high volume trading opportunities, focus on these strategies:
1. Monitor Volume Indicators: Use tools like Volume Moving Average or On-Balance Volume (OBV) to spot unusual spikes that signify strong buying or selling interest.
2. Look for News Catalysts: Pay attention to earnings reports, economic announcements, or industry news that can drive volume.
3. Analyze Pre-Market and After-Hours Activity: High volume in these periods can indicate potential movements when the market opens.
4. Use Level II Quotes: This provides insights into the order book, helping you see where significant buy and sell orders are placed.
5. Check for Breakouts: When a stock breaks through resistance or support levels with high volume, it often signals a strong trend.
6. Compare Historical Volume: Look at past trading volumes for specific stocks to identify what's considered "high" for that asset.
7. Use Trading Scanners: Set filters on scanners to alert you to stocks with unusual volume spikes relative to their average.
Implementing these strategies will help you spot high volume trading opportunities effectively.
What Strategies Utilize Volume Analysis for Day Trading?
1. Volume Spikes: Look for sudden increases in volume, indicating strong interest and potential price movement. Trade in the direction of the spike.
2. Volume Confirmation: Confirm price trends with volume. For instance, rising prices should be accompanied by increasing volume, while falling prices should show the same.
3. Volume-Based Indicators: Use indicators like the On-Balance Volume (OBV) or Chaikin Money Flow (CMF) to assess buying and selling pressure.
4. Price-Volume Trend (PVT): Analyze PVT to identify the direction of trend strength. A rising PVT indicates buying strength, while a declining trend suggests selling pressure.
5. Volume Profiling: Identify price levels with high trading volumes. These areas often act as support or resistance in future trades.
6. Volume Divergence: Watch for divergences between price movement and volume. A price increase with decreasing volume can signal a potential reversal.
7. Market Open and Close Analysis: Focus on volume patterns during market open and close, as these periods often see the most significant price movements.
8. Pre-Market Volume: Analyze pre-market volume for early signals on potential trading opportunities once the market opens.
How to Combine Volume Analysis with Technical Indicators?
To combine volume analysis with technical indicators in day trading, follow these steps:
1. Identify Key Indicators: Use indicators like Moving Averages, Relative Strength Index (RSI), or Bollinger Bands alongside volume data.
2. Look for Convergence: Check for situations where volume spikes coincide with price movements indicated by your chosen technical indicators. For example, a breakout above a resistance level with increasing volume suggests strength.
3. Divergence Signals: If price moves in one direction while volume decreases, it may signal a reversal. For instance, if a stock rises but volume drops, consider this a red flag.
4. Volume-Based Indicators: Incorporate volume-specific indicators like On-Balance Volume (OBV) or Volume Weighted Average Price (VWAP) to assess buying or selling pressure.
5. Confirm Entry and Exit Points: Use volume to confirm signals from technical indicators. For example, if your indicator suggests a buy, confirm it with higher volume to validate the trade.
6. Set Alerts: Monitor significant volume changes and set alerts for your indicators to catch potential trading opportunities.
By integrating these elements, you enhance your trading strategy, making decisions based on both price action and underlying market strength.
Learn about How to Combine Fundamental and Technical Analysis in Day Trading
What Mistakes Should I Avoid in Volume Analysis?
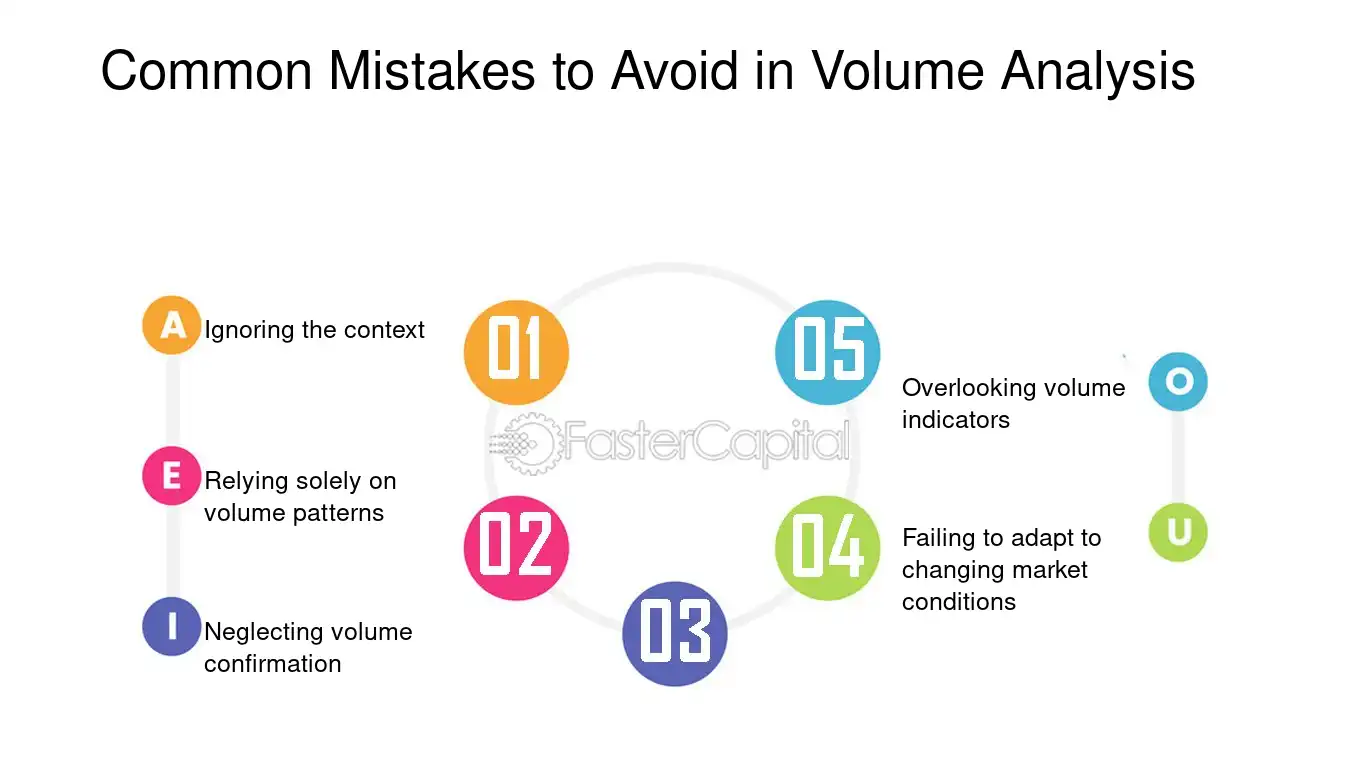
Avoid these mistakes in volume analysis for day trading:
1. Ignoring Context: Always consider volume relative to price action and market conditions. High volume during a downtrend can signal different insights than in an uptrend.
2. Overlooking Timeframes: Analyze volume across multiple timeframes. What looks significant on a 5-minute chart might not matter on a daily chart.
3. Relying Solely on Volume: Volume is a tool, not a standalone indicator. Combine it with other indicators like price patterns and moving averages for better accuracy.
4. Misinterpreting Volume Spikes: Not all spikes indicate strong trends. Distinguish between genuine buying/selling pressure and market noise.
5. Neglecting News Impact: Be aware that news events can skew volume. Volume analysis around major announcements can lead to misleading signals.
6. Failing to Adjust for Market Conditions: Recognize that volume characteristics can vary by market. What’s typical in stocks may not apply to Forex or cryptocurrencies.
7. Ignoring Historical Volume Patterns: Study past volume trends to understand current market behavior. Historical context can provide valuable insights into potential price movements.
How Can I Track Volume Changes During Trading Hours?
To track volume changes during trading hours, use real-time charting software or trading platforms that display volume indicators. Look for volume bars under price charts, which show trading activity. Set alerts for significant volume spikes or drops, and monitor volume relative to the average for that time of day. Use tools like a Level 2 quote to see order book activity, and consider volume oscillators to analyze trends.
What Tools Are Best for Volume Analysis in Day Trading?
The best tools for volume analysis in day trading include:
1. Trading Platforms: Most platforms like Thinkorswim, MetaTrader, and TradeStation offer built-in volume indicators.
2. Volume Indicators: Use tools like On-Balance Volume (OBV), Volume Weighted Average Price (VWAP), and Accumulation/Distribution to assess buying and selling pressure.
3. Charting Software: Platforms such as TradingView provide customizable charts with volume overlays for real-time analysis.
4. Level II Data: Accessing Level II quotes gives insights into order flow and market depth, crucial for volume analysis.
5. Market News Services: Tools like Benzinga and MarketWatch help track news that may influence volume spikes.
Utilizing these tools can enhance your volume analysis and decision-making in day trading.
Learn about What Are the Best AI Tools for Day Trading?
Conclusion about Volume Analysis for Different Markets in Day Trading
Incorporating volume analysis into your day trading strategy can significantly enhance your decision-making process. Understanding how volume impacts price movements, volatility, and market trends is essential for identifying profitable trading opportunities across stocks, forex, and cryptocurrencies. By utilizing key volume indicators and avoiding common pitfalls, you can refine your approach and improve your overall trading performance. For comprehensive insights and tools tailored to your trading needs, explore the resources available at DayTradingBusiness.
Learn about The Role of Volume in Day Trading Chart Analysis
Sources:
- The behavior of daily stock market trading volume - ScienceDirect
- The price discovery role of day traders in futures market: Evidence ...
- Volume Weighted Average Price (VWAP) The Holy Grail for Day ...
- Asymmetric information and the distribution of trading volume ...
- The Bitcoin volume-volatility relationship: A high frequency analysis ...