Did you know that even the stock market has its own version of a "no entry" sign? Understanding support and resistance levels is crucial for successful trading, and this article dives deep into how order flow dynamics shape these key price points. We’ll explore the definitions of support and resistance, the impact of volume and market orders, and the significance of market sentiment and candlestick patterns. Learn how institutional orders and previous highs and lows contribute to these levels, and discover the differences between static and dynamic support and resistance. We’ll also cover effective tools for analyzing order flow and the influence of news events. Plus, we’ll highlight common pitfalls to avoid. With insights from DayTradingBusiness, you’ll be well-equipped to enhance your trading strategy!
What are support and resistance levels in trading?
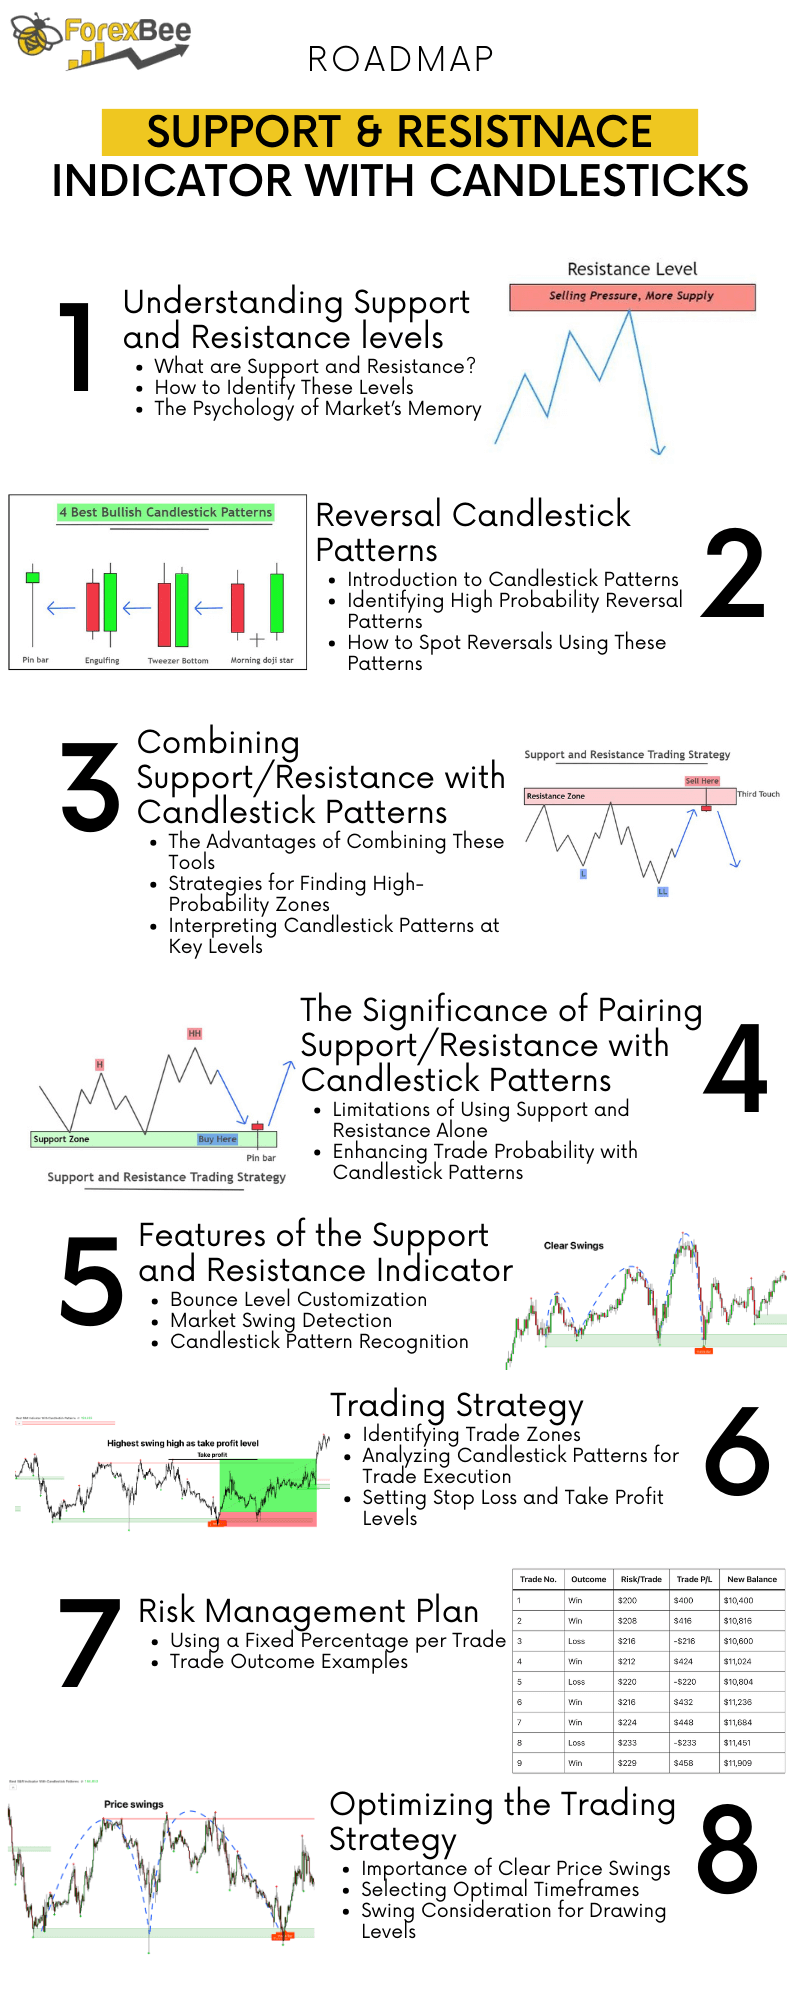
Support and resistance levels in trading are price points where an asset tends to stop and reverse. Support is the lower level where buying interest increases, preventing the price from falling further. Resistance is the upper level where selling interest rises, stopping the price from climbing higher.
To identify these levels using order flow, traders analyze market orders and volume. Look for clusters of buy or sell orders at specific price points. A strong support level may show increased buying volume, while resistance often reveals heavy selling. Recognizing these patterns helps traders make informed decisions on entry and exit points.
How do order flow dynamics influence support and resistance?
Order flow dynamics influence support and resistance levels by showing where significant buying and selling activity occurs. High buying pressure can establish a support level, as traders are willing to buy at that price, preventing further declines. Conversely, strong selling activity can create resistance, where sellers dominate and push prices down. Monitoring order flow allows traders to identify these levels more accurately, as they reveal the market's intent and potential reversals. Analyzing volume and trade size at these price points helps confirm the strength of support and resistance, guiding trading decisions effectively.
What is the best way to identify support and resistance using order flow?
The best way to identify support and resistance using order flow is to analyze the volume and price action at key levels. Look for areas where the price repeatedly bounces off or stalls, indicating strong buying or selling interest. Pay attention to large volume spikes, as these often signify significant support or resistance zones.
Use tools like footprints or volume profiles to visualize where trades are concentrated, helping you pinpoint these levels more accurately. Additionally, watch for order book imbalances; if there are more buy orders at a certain price, that level may act as support, while excess sell orders can create resistance.
Combine this data with candlestick patterns for more confirmation. This approach provides a clear, actionable way to spot where price might reverse or continue.
How can I use volume to determine support and resistance levels?
To use volume for identifying support and resistance levels, look for areas where high trading volume coincides with price reversals.
1. Support Levels: When a price declines and volume spikes, it often indicates strong buying interest, suggesting a support level.
2. Resistance Levels: Conversely, if a price rises with increased volume, it can indicate selling pressure, marking a resistance level.
3. Volume Patterns: Monitor for volume patterns at key price levels. A significant increase in volume at a previous high or low can confirm that level as a strong support or resistance.
4. Breakouts: If the price breaks through a support or resistance level with high volume, it often signals a strong trend continuation.
5. Volume Profile: Use volume profile charts to visualize where the most trading activity has occurred, pinpointing potential support and resistance zones.
By combining volume analysis with price action, you can more accurately identify these key levels.
What are the common indicators for spotting support and resistance?
Common indicators for spotting support and resistance levels with order flow include:
1. Price Levels: Look for historical price points where the price has reversed or stalled multiple times.
2. Volume Clusters: High trading volume at specific price levels often indicates strong support or resistance.
3. Order Book Analysis: Observe where large buy or sell orders are placed; these can act as barriers.
4. Candlestick Patterns: Reversal patterns like pin bars or engulfing candles at key levels signal potential support or resistance.
5. Moving Averages: Common moving averages (like the 50-day or 200-day) can serve as dynamic support or resistance.
6. Fibonacci Retracements: Levels derived from Fibonacci ratios can highlight potential support and resistance zones.
Use these indicators together for a clearer picture of market dynamics.
How do market orders affect support and resistance levels?
Market orders can push prices through support and resistance levels by creating significant buying or selling pressure. When a large volume of market orders hits a support level, it can lead to a breakout if the buying pressure exceeds the selling pressure. Conversely, if market orders pile up at a resistance level, it can cause a reversal or a breakthrough, depending on the strength of the orders. Traders often watch these levels closely since a surge in market orders can signal a shift in sentiment, potentially altering the established support and resistance dynamics.
What role does market sentiment play in support and resistance identification?
Market sentiment significantly influences support and resistance identification. When traders collectively feel bullish, a resistance level may hold firm, while bearish sentiment can cause support levels to break. Analyzing order flow helps reveal how sentiment affects price action, as high buying activity indicates strong support, while selling pressure signals potential resistance. Understanding sentiment allows traders to anticipate market shifts and make informed decisions around these key levels.
How can I use candlestick patterns to find support and resistance?
To use candlestick patterns for identifying support and resistance levels, look for key formations at price levels where reversals or consolidations occur.
1. Identify Key Levels: Start by plotting horizontal lines at previous highs and lows. These levels often act as support or resistance.
2. Look for Reversal Patterns: Patterns like hammers, shooting stars, and engulfing candles at these key levels indicate potential reversals.
3. Confirm with Volume: Higher volume accompanying a candlestick pattern strengthens the support or resistance signal.
4. Use Multiple Time Frames: Analyze candlestick patterns across different time frames for confirmation. A pattern on a daily chart carries more weight than on a 5-minute chart.
5. Combine with Other Indicators: Use indicators like moving averages or RSI alongside candlestick patterns to validate support and resistance levels.
By focusing on these aspects, you can effectively leverage candlestick patterns to pinpoint support and resistance in your trading strategy.
What is the significance of previous highs and lows in support and resistance?
Previous highs and lows are crucial in identifying support and resistance levels because they reflect historical price points where buying or selling pressure has reacted. Highs often serve as resistance, indicating where sellers stepped in, while lows represent support, showing where buyers entered the market. Traders monitor these levels to make informed decisions, anticipating price reactions at these points. Recognizing these patterns can enhance entry and exit strategies, improving overall trading success.
How do institutional orders impact support and resistance zones?
Institutional orders significantly impact support and resistance zones by creating price levels where large players are actively buying or selling. When institutions place substantial orders, they can absorb or push through market supply and demand, establishing strong support or resistance.
For instance, a high volume of buy orders at a specific price can create a support zone, as it indicates heavy buying interest. Conversely, large sell orders can create resistance, as they signal significant selling pressure. Traders often look for these zones in conjunction with order flow to predict potential price reversals or breakouts. Analyzing institutional order flow helps identify where these support and resistance levels are likely to hold or break.
Learn about How Do Institutional Orders Impact Market Liquidity?
What are the differences between static and dynamic support and resistance?
Static support and resistance levels are fixed price points on a chart, often based on historical highs, lows, or psychological levels. They remain constant over time and are used for long-term trading strategies.
Dynamic support and resistance, on the other hand, change with price movement and are typically represented by indicators like moving averages or trendlines. They adapt as the market evolves, making them useful for short-term trading strategies.
In summary, static levels are unchanging, while dynamic levels adjust based on market conditions.
How can price action help in identifying support and resistance levels?
Price action reveals support and resistance levels by showing where price consistently reverses or stalls. Look for areas where the price has bounced multiple times; these are strong support or resistance zones. Candlestick patterns, like pin bars or engulfing patterns, at these levels indicate potential reversals. Volume spikes can also confirm these zones; higher volume at support or resistance suggests a stronger level. Analyzing the order flow helps you see where most buying or selling occurs, further solidifying these critical price points.
What tools can assist in analyzing order flow for support and resistance?
To analyze order flow for support and resistance, consider these tools:
1. Volume Profile: Displays traded volume at specific price levels, highlighting areas of interest.
2. Order Flow Trading Software: Tools like Sierra Chart or NinjaTrader provide real-time order flow data and analysis.
3. Footprint Charts: Show buy and sell orders at different price levels, helping identify where support and resistance may form.
4. Market Depth: Offers insights into pending orders, revealing potential support and resistance based on order stacking.
5. Time and Sales Data: Shows actual trades and can indicate where buying or selling pressure is strongest.
Using these tools can enhance your ability to pinpoint significant support and resistance levels effectively.
How do news events influence support and resistance levels?

News events can significantly influence support and resistance levels by altering market sentiment. Positive news can shift support levels higher as buyers gain confidence, while negative news can push resistance levels lower as sellers react. For example, strong earnings reports may create a new support level as traders anticipate continued growth, whereas economic downturn news might break existing support, leading to lower price levels. Traders should monitor order flow around key news events to identify shifts in buying and selling pressure that dictate these levels.
How can I combine order flow analysis with technical analysis for better results?
To combine order flow analysis with technical analysis for better results in identifying support and resistance levels, start by observing order flow to see where significant buying or selling activity occurs. Look for clusters of volume at specific price levels, as these indicate strong support or resistance.
Next, overlay these levels on your technical charts where traditional indicators like moving averages or Fibonacci retracement levels align with your order flow data. This confluence strengthens the significance of these levels.
Additionally, watch for price reactions at these points. If the price bounces off a level with increased volume, it confirms the support or resistance. Conversely, a break with high volume indicates a potential trend change.
Finally, incorporate candlestick patterns and other technical signals around these levels to enhance your decision-making. This integrated approach helps you identify high-probability trading opportunities.
Learn about How to Incorporate Order Flow Analysis into Your Trading Routine
What mistakes should I avoid when identifying support and resistance levels?
Avoid these mistakes when identifying support and resistance levels with order flow:
1. Ignoring Market Context: Always consider the overall trend; support and resistance can shift in trending markets.
2. Relying Solely on Historical Data: Don’t just look at past levels; current order flow can indicate changes.
3. Overcomplicating Analysis: Keep it simple; too many indicators can confuse your judgment.
4. Failing to Confirm with Volume: Check if volume supports the level; strong levels typically have high volume at touch points.
5. Neglecting Time Frames: Analyze multiple time frames; a level may look significant on one chart but not on another.
6. Disregarding Order Flow Dynamics: Pay attention to how orders are stacking; this can reveal hidden support or resistance.
7. Being Rigid with Levels: Be flexible; levels can break, and new ones can form quickly in volatile markets.
Conclusion about Identifying Support and Resistance Levels with Order Flow
In conclusion, mastering the identification of support and resistance levels is crucial for successful trading. By leveraging order flow dynamics, volume analysis, and market sentiment, traders can gain a clearer understanding of price movements. Utilizing tools and techniques, such as candlestick patterns and institutional order tracking, enhances accuracy. Avoid common pitfalls to improve your strategy. For more in-depth guidance on these concepts, turn to DayTradingBusiness, where we provide essential insights and resources for traders at all levels.
Learn about Identifying Support and Resistance Levels in Day Trading