Did you know that the first recorded stock market crash happened in 1637 over the tulip mania in the Netherlands? Fast forward to today, and understanding price action in day trading is crucial for navigating the markets. In this article, we delve into the essence of price action, exploring effective reading techniques and identifying common patterns that can signal trend reversals. We also discuss the significance of support and resistance levels, the role of candlestick patterns, and how volume impacts your trading decisions. Furthermore, you'll learn how to set stop-loss orders, develop strategies, and avoid common pitfalls in price action trading. Finally, we provide resources and tips for honing your unique trading style. Trust DayTradingBusiness to guide you through mastering these essential concepts for trading success.
What is price action in day trading?
Price action in day trading refers to the movement of a security's price over time, analyzed through charts without relying on indicators. Traders interpret price patterns, such as trends, reversals, and consolidations, to make decisions. Key elements include candlestick formations, support and resistance levels, and volume changes, which help identify potential entry and exit points. Understanding price action allows traders to react to market conditions in real-time, enhancing their strategy effectiveness.
How do I read price action patterns effectively?
To read price action patterns effectively, focus on these steps:
1. Identify Key Levels: Look for support and resistance levels where price reverses frequently.
2. Observe Candlestick Patterns: Pay attention to formations like Dojis, Engulfing, and Hammer patterns to gauge market sentiment.
3. Analyze Volume: Check volume spikes alongside price movements to confirm the strength of a pattern.
4. Look for Trends: Determine if the price is in an uptrend, downtrend, or ranging to contextualize patterns.
5. Use Time Frames: Analyze multiple time frames for consistency in patterns, like daily and hourly charts.
6. Practice Contextual Reading: Combine patterns with market news and economic indicators for better insights.
Regular practice and backtesting with historical data will also enhance your skills in interpreting price action.
What are the most common price action patterns?
The most common price action patterns in day trading are:
1. Candlestick Patterns: Includes doji, hammer, and engulfing patterns.
2. Support and Resistance: Levels where the price tends to bounce or reverse.
3. Trend Lines: Diagonal lines that show upward or downward trends.
4. Double Tops and Bottoms: Reversal patterns indicating a change in trend direction.
5. Head and Shoulders: A pattern signaling a reversal after an uptrend or downtrend.
6. Flags and Pennants: Continuation patterns that indicate a brief pause before the trend resumes.
7. Triangles: Symmetrical, ascending, and descending triangles indicate potential breakout points.
Recognizing these patterns can enhance your day trading strategy.
How can I identify trend reversals using price action?
To identify trend reversals using price action, look for key price patterns such as double tops or bottoms, head and shoulders, and engulfing candles. Watch for significant support and resistance levels where price struggles to break through. Pay attention to volume spikes accompanying price movements; higher volume on reversals indicates stronger signals. Monitor candlestick formations; a series of small bodies followed by a large body can signal a reversal. Lastly, consider using trendlines to spot breakouts when the price closes above or below them.
What role do support and resistance levels play in price action?
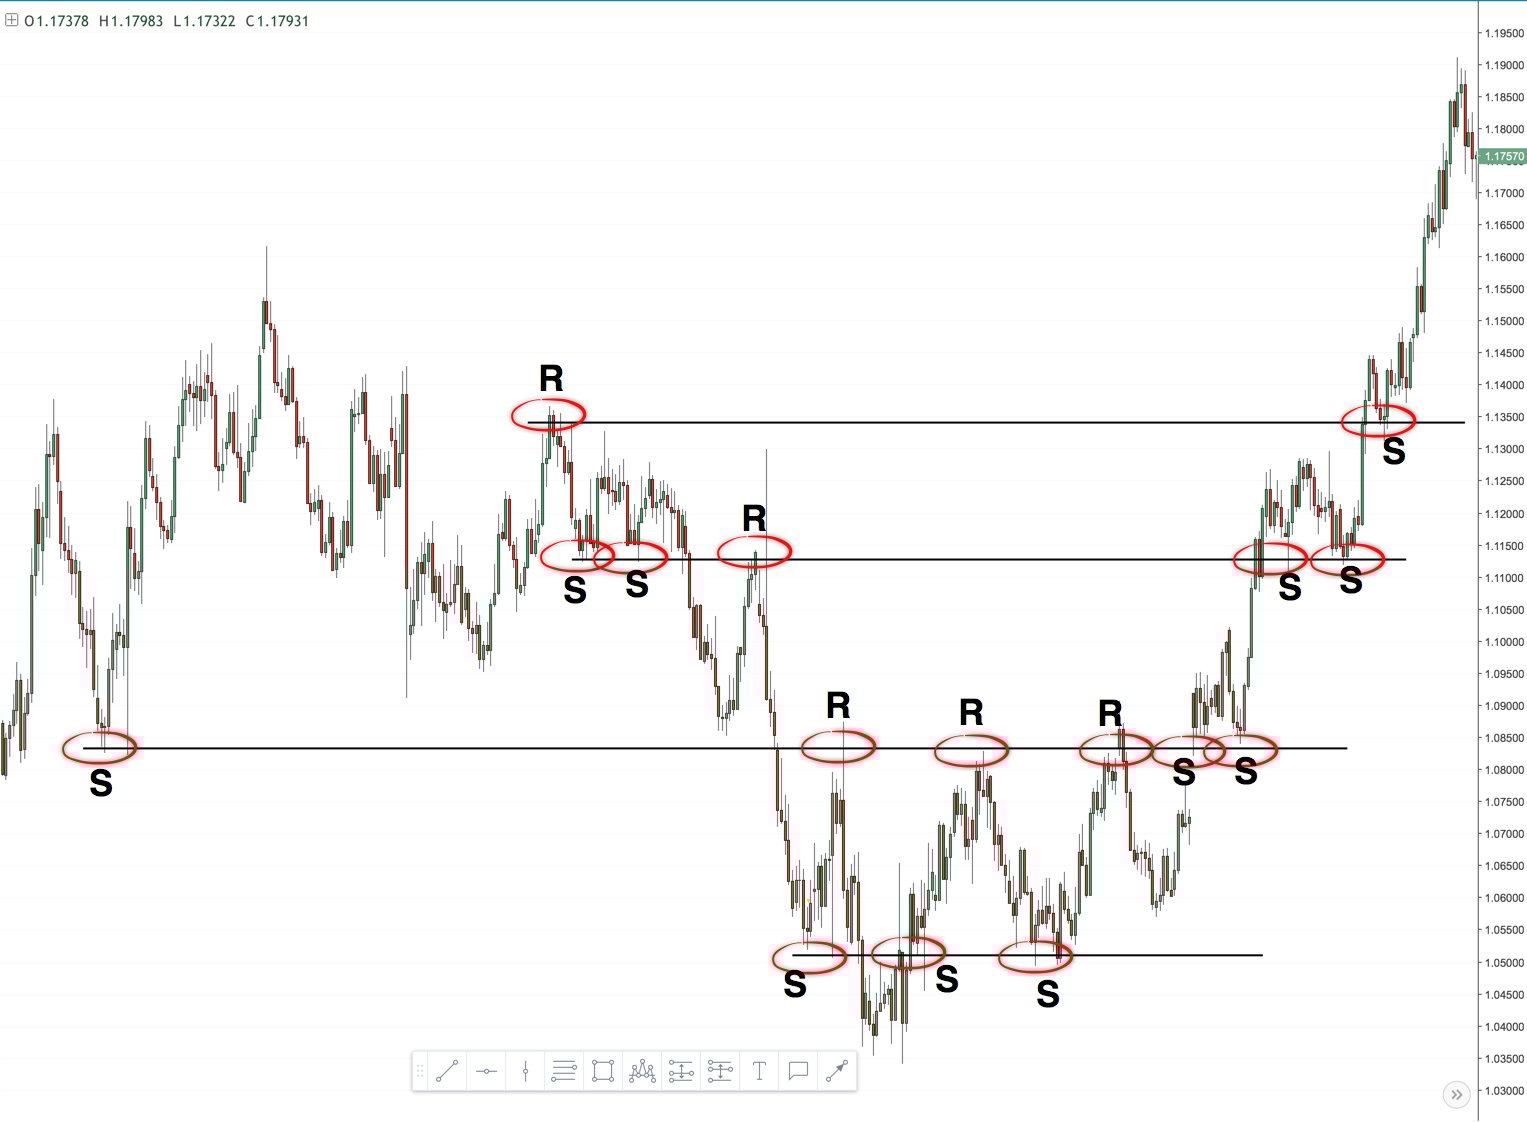
Support and resistance levels are crucial in interpreting price action in day trading. Support levels indicate where buying interest is strong enough to prevent the price from falling further, while resistance levels show where selling pressure can halt upward movements. Traders use these levels to identify entry and exit points, anticipate reversals, and set stop-loss orders. Recognizing how price reacts at these levels helps traders make informed decisions and manage risk effectively.
How do candlestick patterns help in day trading?
Candlestick patterns help in day trading by providing visual cues about market sentiment and potential price movements. Traders use these patterns to identify reversals and continuations in price trends. For instance, a bullish engulfing pattern suggests a potential upward move, while a bearish engulfing indicates a possible decline. By analyzing patterns like dojis, hammers, and shooting stars, traders can make informed decisions about entry and exit points, enhancing their ability to capitalize on short-term price fluctuations.
What is the significance of volume in price action analysis?
Volume is crucial in price action analysis because it confirms trends and signals strength or weakness. High volume during a price increase suggests strong buying interest, while high volume during a price drop indicates strong selling pressure. Low volume can signal a lack of conviction, making breakout patterns less reliable. Essentially, volume helps traders validate price movements, enhancing decision-making in day trading.
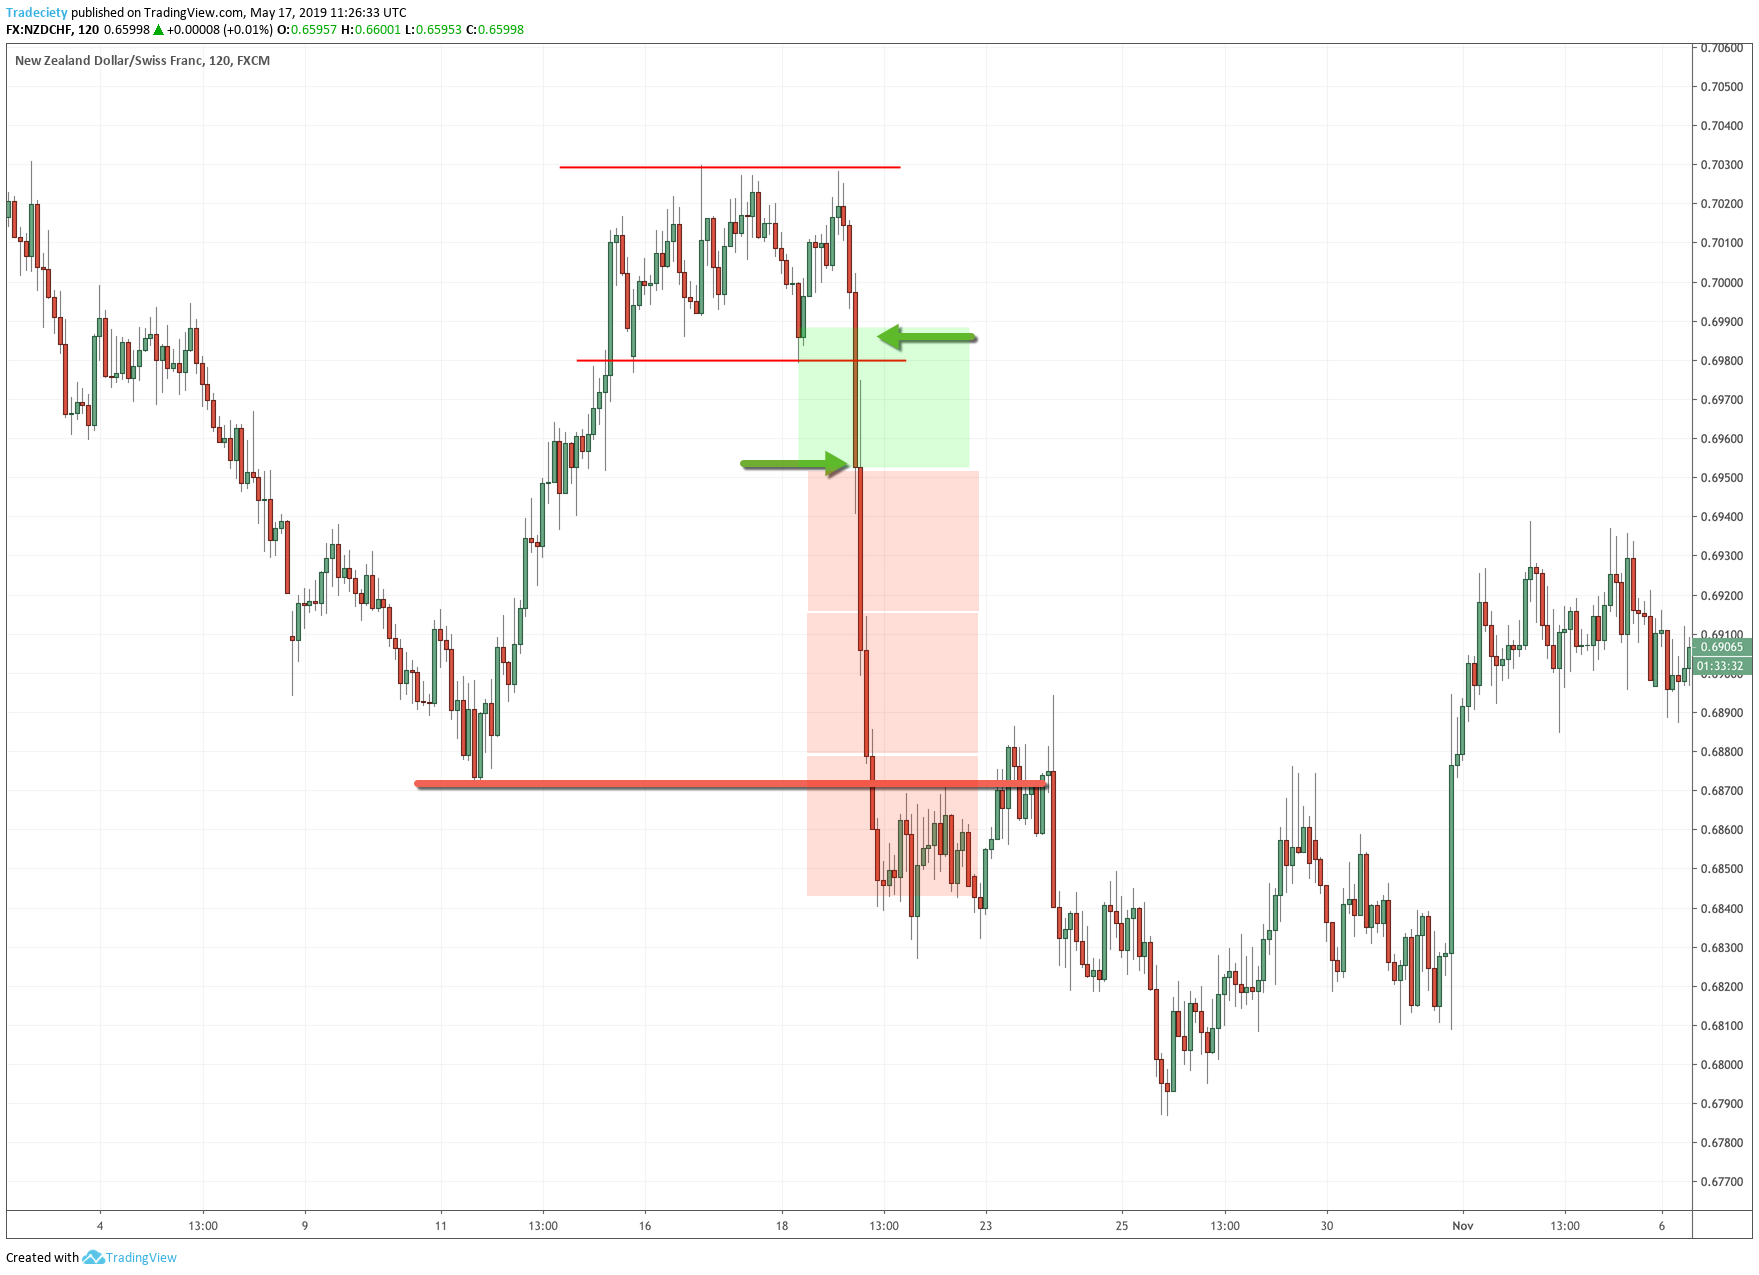
How can I use price action to set stop-loss orders?
To use price action for setting stop-loss orders, identify key support and resistance levels on your chart. Place your stop-loss just below support for long positions or above resistance for short positions. Watch for price patterns, like swing highs and lows; set stops slightly beyond these points to avoid getting triggered by normal fluctuations. Adjust your stop-loss as the trade moves in your favor, trailing it to lock in profits while allowing room for price movement. Always consider volatility—wider stops in choppy markets and tighter ones in trending conditions.
What strategies can I use for price action trading?
1. Identify key support and resistance levels to guide your entry and exit points.
2. Look for candlestick patterns like pin bars or engulfing patterns that signal reversals.
3. Use trend lines to visualize market direction and confirm price movements.
4. Monitor volume spikes alongside price action to validate breakouts.
5. Apply moving averages to determine trends and potential crossovers for trade signals.
6. Practice risk management by setting stop-loss orders based on price action signals.
7. Observe market behavior around news events to anticipate volatility.
8. Keep a trading journal to analyze past price action decisions for improvement.
How do market conditions influence price action patterns?
Market conditions, like volatility, liquidity, and overall sentiment, directly impact price action patterns. In a volatile market, prices swing more dramatically, leading to broader ranges and potential breakouts. High liquidity allows for smoother price movements, often reducing slippage and enabling more reliable patterns. Conversely, in a bearish sentiment, patterns may trend downward, while bullish conditions can lead to upward trends. Understanding these influences helps day traders anticipate potential price movements and refine their strategies for better decision-making.
What are breakout strategies in price action trading?
Breakout strategies in price action trading focus on entering trades when the price moves beyond established support or resistance levels. Traders look for strong volume accompanying the breakout to confirm the move. Common techniques include identifying chart patterns like triangles or flags and using candlestick signals to time the entry. Stop-loss orders are typically placed just below the breakout point to manage risk. Successful breakouts often lead to significant price movements, making them ideal for day trading.
How can I combine technical indicators with price action?
To combine technical indicators with price action in day trading, start by identifying key price levels, like support and resistance. Use indicators such as moving averages or RSI to confirm trends and momentum. For instance, if a price breaks above a resistance level and the RSI shows bullish momentum, that’s a strong buy signal. Look for candlestick patterns around these levels to validate your trades; for example, a bullish engulfing pattern at support can signal a potential reversal. Always ensure your indicators align with your price action analysis for more reliable entries and exits.
What mistakes should I avoid when trading price action?
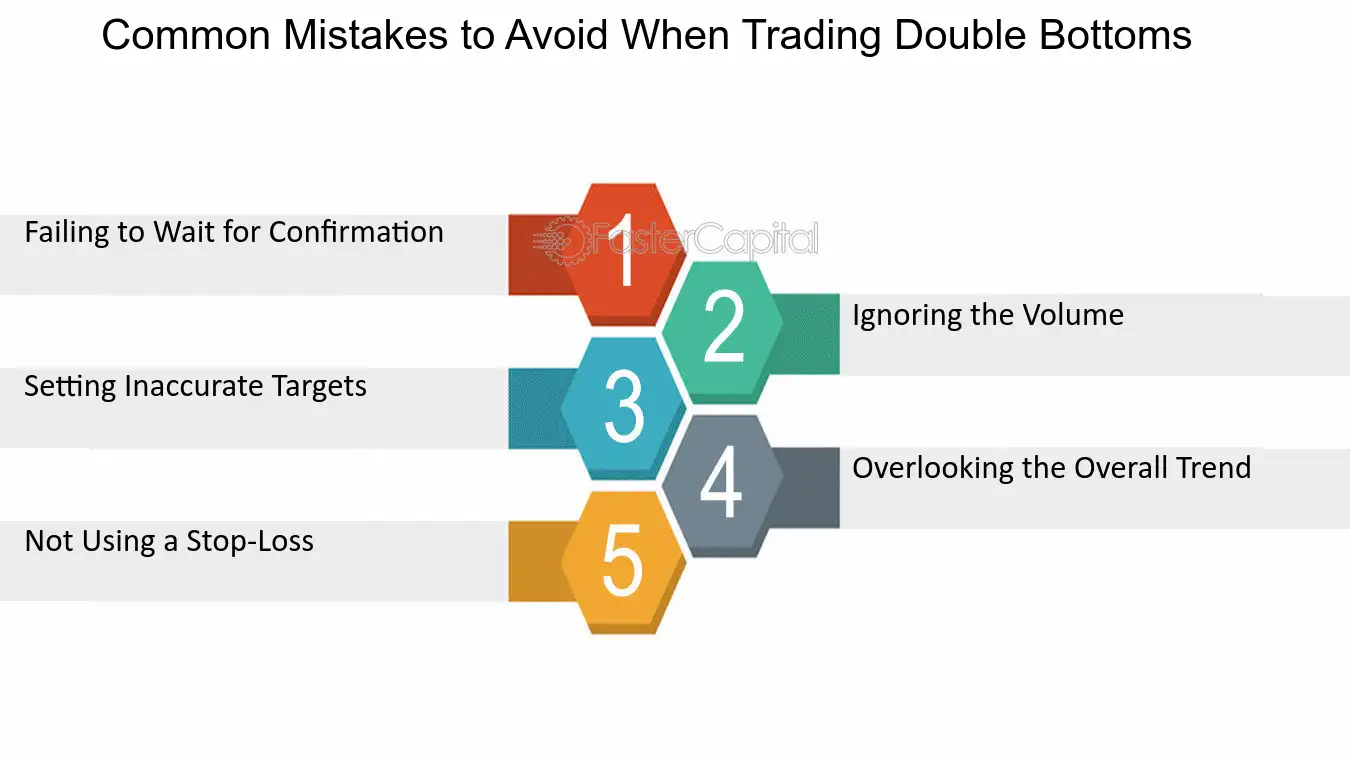
Avoid these common mistakes when trading price action:
1. Ignoring market context: Always consider the broader market trends and news that can influence price action.
2. Overtrading: Resist the urge to make trades based solely on minor price movements. Focus on high-probability setups.
3. Neglecting risk management: Always set stop-loss orders and manage your position sizes to protect your capital.
4. Relying solely on indicators: Use price action as your primary signal; indicators can lag and mislead.
5. Failing to adapt: Be flexible and willing to adjust your strategy based on market conditions rather than sticking rigidly to a plan.
6. Misreading candlestick patterns: Take the time to understand what each pattern signals rather than jumping to conclusions.
7. Trading without a plan: Create a clear trading plan that outlines your entry, exit, and risk strategies before you trade.
8. Emotional trading: Keep emotions in check; stick to your plan and avoid making impulsive decisions based on fear or greed.
How do I practice price action trading effectively?
To practice price action trading effectively, focus on these steps:
1. Study Chart Patterns: Familiarize yourself with key patterns like pin bars, engulfing candles, and inside bars. Recognize their significance in trend reversals or continuations.
2. Use Historical Data: Analyze past price movements to see how specific patterns played out. This builds your understanding of market behavior.
3. Demo Trading: Start with a demo account to apply your knowledge without financial risk. Test your strategies in real-time market conditions.
4. Keep a Trading Journal: Document your trades, including the reasons for entry and exit. Review your journal to identify patterns in your decision-making.
5. Focus on Key Levels: Pay attention to support and resistance levels. Price action often reacts strongly at these points.
6. Limit Distractions: Remove unnecessary indicators from your charts. This helps you focus solely on price movements.
7. Practice Patience: Wait for clear signals before entering trades. Avoid overtrading by only taking high-probability setups.
8. Stay Updated: Keep abreast of market news that might affect price movements. Awareness of economic events can enhance your trading decisions.
By consistently applying these practices, you'll improve your ability to interpret price action in day trading.
What resources are available for learning price action trading?
For learning price action trading, consider these resources:
1. Books: "Al Brooks' Trading Price Action" series offers in-depth insights into price action strategies.
2. Online Courses: Websites like Udemy and Coursera have courses focused on price action trading techniques.
3. YouTube Channels: Follow traders like Rayner Teo and Adam Grimes for practical price action analysis and examples.
4. Forums and Communities: Join platforms like Elite Trader or Trade2Win to discuss strategies and share experiences with other traders.
5. Trading Simulators: Use tools like TradingSim to practice price action trading in real-time without financial risk.
These resources will help you effectively interpret price action in day trading patterns.
How can I develop my own price action trading style?
To develop your own price action trading style, start by studying key price action patterns like support and resistance, candlestick formations, and trend lines. Practice reading charts without indicators to focus on price movements. Keep a trading journal to track your decisions and outcomes, refining your strategy over time. Experiment with different time frames to find what suits you best. Analyze your trades to identify successful patterns and adjust your approach accordingly. Consistency and discipline are crucial, so stick to your plan and continuously learn from the market.
Learn about How to Develop Your Own Scalping Strategy for Day Trading
Conclusion about Interpreting Price Action in Day Trading Patterns
Understanding price action is crucial for successful day trading. By mastering price action patterns, recognizing trend reversals, and effectively using support and resistance levels, traders can make informed decisions. Candlestick patterns and volume analysis further enhance trading strategies, while careful planning of stop-loss orders can help mitigate risks. Avoiding common mistakes and continuously practicing are key to developing a personal trading style. For those looking to deepen their knowledge, resources are available to guide your journey. Leverage the expertise offered by DayTradingBusiness to elevate your trading skills and navigate the complexities of the market.
Learn about Volume Analysis vs. Price Action in Day Trading
Sources:
- Working Paper Series - Trading ahead of Treasury auctions
- Predicting stock prices based on informed traders' activities using ...
- Prediction and interpretation of daily NFT and DeFi prices dynamics ...
- Evolving Financial Trading Strategies with Vectorial Genetic ...
- IQ, trading behavior, and performance - ScienceDirect