Did you know that trading volume can sometimes spike just because a cat video goes viral? In the world of day trading, understanding volume changes is crucial for identifying market trends and making informed decisions. This article dives into essential strategies for monitoring volume, the best tools for tracking it, and its significance in confirming price movements. Explore common volume indicators, effective methods for analyzing historical data, and how volume influences risk management. Learn to combine volume analysis with technical indicators and avoid common pitfalls, all while developing a robust volume-based trading strategy. Join us at DayTradingBusiness for expert insights that will elevate your trading game!
How Can I Monitor Volume Changes for Day Trading?
To monitor volume changes for day trading, use real-time charting software that displays volume bars alongside price charts. Look for spikes in volume, which often indicate strong buying or selling interest. Set alerts for unusual volume levels compared to recent averages. Utilize indicators like the Volume Moving Average or On-Balance Volume (OBV) to spot trends. Pay attention to news events that can cause volume surges. Finally, combine volume analysis with price action to confirm potential trades.
What Tools Are Best for Tracking Volume in Day Trading?
The best tools for tracking volume in day trading include:
1. Trading Platforms: Most platforms like ThinkorSwim, MetaTrader, and TD Ameritrade offer built-in volume indicators.
2. Charting Software: Tools like TradingView and StockCharts provide customizable volume charts and overlays.
3. Volume Analysis Tools: Specialized software like Trade Ideas and MarketSmith focus on volume analysis and alerts.
4. Mobile Apps: Apps like Robinhood and Webull allow you to monitor volume on the go with real-time data.
5. News Aggregators: Services like Benzinga and Yahoo Finance can help track volume spikes related to news events.
Choose the tool that best fits your trading style and needs.
Why Is Volume Important for Day Trading Success?
Volume is crucial for day trading success because it indicates the strength of price movements. High volume often confirms trends, signaling that a price movement is likely to continue. It helps traders identify entry and exit points, enhancing the accuracy of trades. Monitoring volume changes also allows traders to spot potential reversals or breakouts, giving them an edge in decision-making. In essence, understanding volume can lead to better timing and increased profitability in day trading.
How Do Volume Changes Indicate Market Trends?
Volume changes indicate market trends by showing the strength of price movements. Increased volume during a price rise suggests strong buying interest, signaling an uptrend. Conversely, high volume during a price drop indicates strong selling pressure, signaling a downtrend. Low volume can suggest a lack of conviction, making price movements less reliable. Day traders monitor these changes to confirm trends and make informed buy or sell decisions.
What Patterns Should I Look for in Volume Data?
Look for increasing volume during price uptrends, which signals strong buying interest. Conversely, decreasing volume during price declines can indicate weakening selling pressure. Watch for volume spikes at key support and resistance levels, as these often precede significant price moves. Additionally, identify patterns like volume accumulation, where price rises on increasing volume, suggesting potential breakout opportunities. Pay attention to divergences between volume and price; for example, if price moves higher but volume drops, it may indicate a reversal is coming.
How Can I Use Volume to Confirm Price Movements?
To use volume to confirm price movements in day trading, follow these steps:
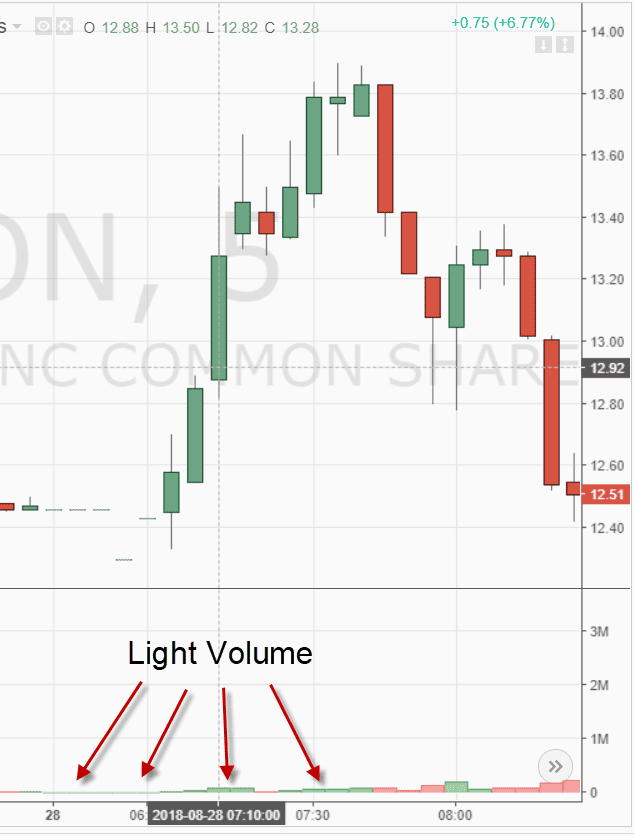
1. Look for Volume Spikes: When a price moves significantly, check if there's a corresponding spike in volume. High volume validates the price move.
2. Analyze Volume Trends: Observe volume trends during price consolidations. Increasing volume during an uptrend indicates strength, while decreasing volume may signal a reversal.
3. Use Volume Indicators: Employ indicators like the On-Balance Volume (OBV) or Volume Moving Average to gauge buying and selling pressure.
4. Check for Divergence: If price rises but volume falls, it could indicate weakness. Conversely, if price falls with rising volume, it may signal a strong downward trend.
5. Confirm Breakouts: For breakouts, ensure they occur on high volume. A breakout on low volume might suggest a false signal.
6. Watch for Support and Resistance: Increased volume at support or resistance levels can confirm these zones, reinforcing potential price reversals.
By integrating these volume analysis techniques, you can enhance your day trading strategies and improve decision-making.
What Are the Common Volume Indicators for Day Traders?
Common volume indicators for day traders include:
1. Volume Bars: Show the total trading volume over a specific period, helping identify trends.
2. Moving Average of Volume: Smoothing volume data helps spot significant changes or anomalies.
3. On-Balance Volume (OBV): Combines price movement and volume to indicate buying or selling pressure.
4. Accumulation/Distribution Line: Measures the cumulative flow of volume, indicating whether a stock is being accumulated or distributed.
5. Chaikin Money Flow (CMF): Combines price and volume to assess buying and selling pressure over a specific period.
6. Volume Rate of Change (VROC): Measures the percentage change in volume over time, highlighting spikes or drops.
Using these indicators helps day traders make informed decisions based on volume changes.
How Does Volume Impact Price Action in Day Trading?
Volume significantly impacts price action in day trading by indicating the strength of a price movement. High volume often confirms that a trend is strong, suggesting that the price will continue in that direction. Conversely, low volume can signal weakness, leading to potential reversals or consolidations. Traders monitor volume changes to identify entry and exit points; for example, a sudden spike in volume can indicate a breakout. Analyzing volume alongside price action helps traders make more informed decisions and increases the chances of day trading success.
How Can I Analyze Historical Volume Data Effectively?
To analyze historical volume data effectively for day trading, follow these steps:
1. Use Reliable Data Sources: Obtain historical volume data from trusted platforms like trading software or dedicated financial websites.
2. Identify Trends: Look for patterns in volume changes that precede price movements. High volume during price increases signals strong interest.
3. Compare with Price Action: Analyze volume alongside price charts. Look for volume spikes at key support or resistance levels to confirm potential reversals.
4. Calculate Volume Indicators: Utilize indicators like the Volume Moving Average or On-Balance Volume (OBV) to gauge momentum and strength.
5. Set Alerts for Anomalies: Monitor for unusual volume spikes that could indicate impending price shifts.
6. Review Timeframes: Evaluate volume across different timeframes (daily, hourly) to understand intraday trends and broader market sentiment.
By applying these strategies, you can leverage historical volume data to enhance your day trading decisions.
What Role Does Volume Play in Risk Management for Day Traders?
Volume is crucial for day traders as it indicates market activity and liquidity. High volume often confirms price movements, signaling strong trends. Traders watch for volume spikes to identify breakouts or reversals. Low volume can lead to false signals, increasing risk. Monitoring volume changes helps traders make informed decisions, ensuring they enter and exit trades at optimal times.
How Can I Combine Volume Analysis with Technical Indicators?
Combine volume analysis with technical indicators by first identifying key volume patterns, like spikes or drops, and then confirming these with indicators such as Moving Averages, RSI, or MACD. For example, if you see a volume spike alongside a bullish crossover on the MACD, it signals stronger momentum. Use volume to validate breakouts; a price move above resistance with high volume is more reliable. Monitor volume trends over time to enhance your day trading strategy and improve entry and exit points.
Learn about How to Combine Fundamental and Technical Analysis in Day Trading
What Are the Best Practices for Interpreting Volume Changes?
To interpret volume changes effectively for day trading, follow these best practices:
1. Contextual Analysis: Always consider volume changes in the context of price movements. Rising volume with price increases suggests strong buying interest, while rising volume with price decreases indicates selling pressure.
2. Moving Averages: Use volume moving averages to identify trends. Compare current volume to the average over a set period (like 20 or 50 days) to spot anomalies.
3. Volume Patterns: Look for volume patterns like spikes or surges. A significant increase can signal a potential breakout or reversal, while low volume may indicate consolidation.
4. Confirmation with Indicators: Combine volume analysis with technical indicators, such as Relative Strength Index (RSI) or Moving Average Convergence Divergence (MACD), to confirm trading signals.
5. News Impact: Monitor news and events that may affect volume. Major announcements often lead to spikes in trading volume, impacting price movements.
6. Volume by Price: Analyze volume at specific price levels using volume profiles. This helps identify key support and resistance levels based on historical trading activity.
7. Market Sentiment: Consider overall market sentiment. High volume in a bearish market may indicate panic selling, while high volume in a bullish market can suggest strong buyer confidence.
By applying these practices, you can make more informed trading decisions based on volume changes.
How Do News Events Affect Trading Volume?
News events can significantly impact trading volume by increasing activity as traders react to new information. Positive news typically drives higher buying volume, while negative news often leads to increased selling volume. Major announcements, earnings reports, or economic indicators can lead to spikes in volume due to heightened interest and volatility. Traders monitor these changes closely, as increased volume often signals potential price movement and opportunities for day trading success.
Learn about How News Events Affect Reversal Trading Strategies
What Mistakes Should I Avoid When Monitoring Volume?
1. Ignoring volume spikes: Don’t overlook sudden increases in volume, as they can indicate potential price changes.
2. Relying solely on volume indicators: Use volume in conjunction with price action for better insights.
3. Not considering context: Analyze volume trends relative to historical data for a clearer picture.
4. Overtrading based on volume: Avoid making impulsive trades just because volume is high; ensure it aligns with your strategy.
5. Neglecting time frames: Monitor volume across different time frames to capture short-term fluctuations and long-term trends.
6. Failing to account for news events: Be aware of scheduled news releases that can distort volume patterns.
How Can I Develop a Volume-Based Trading Strategy?
To develop a volume-based trading strategy, start by identifying key volume indicators like the Average Volume and Volume Oscillator. Monitor volume spikes during price movements to confirm trends. Use candlestick patterns alongside volume analysis to gauge market sentiment. Set entry points when volume increases on breakouts, and consider exit strategies when volume declines. Additionally, backtest your strategy with historical data to refine your approach. Focus on maintaining discipline and adjusting your strategy based on real-time volume changes for day trading success.
How Often Should I Check Volume When Day Trading?
Check volume every time you enter a trade and regularly during the day. Monitor it with each price movement to confirm trends or reversals. Pay close attention to volume spikes, as they often indicate strong buying or selling pressure. Regular checks help you make informed decisions and adjust your strategy as needed.
Learn about How to manage leverage risk when day trading?
Conclusion about Monitoring Volume Changes for Day Trading Success
Incorporating volume analysis into your day trading strategy is crucial for making informed decisions and enhancing your trading success. By utilizing the right tools and understanding volume patterns, you can effectively gauge market trends and confirm price movements. Remember to analyze historical data, stay aware of news events, and avoid common pitfalls to maximize your trading potential. For more in-depth guidance and resources, DayTradingBusiness is here to support your journey in mastering volume changes for optimal trading results.
Learn about How to Analyze Trading Volume for Day Trading Success