Did you know that 90% of traders lose money, often because they ignore critical market signals? In this article, we delve into the intricacies of spotting market reversals through order flow analysis. You'll learn what order flow analysis is and how to identify market reversals using key indicators. We’ll discuss the impact of volume, the significance of buy and sell orders, and how candlestick patterns can enhance your strategy. Additionally, we cover common pitfalls to avoid, the best tools for analysis, and the effects of market versus limit orders on your findings. Explore how to combine order flow with technical analysis, backtest your strategies, and understand the psychological influences at play. With insights from DayTradingBusiness, you'll gain valuable knowledge to refine your trading approach and increase your chances of success.
What is order flow analysis in trading?
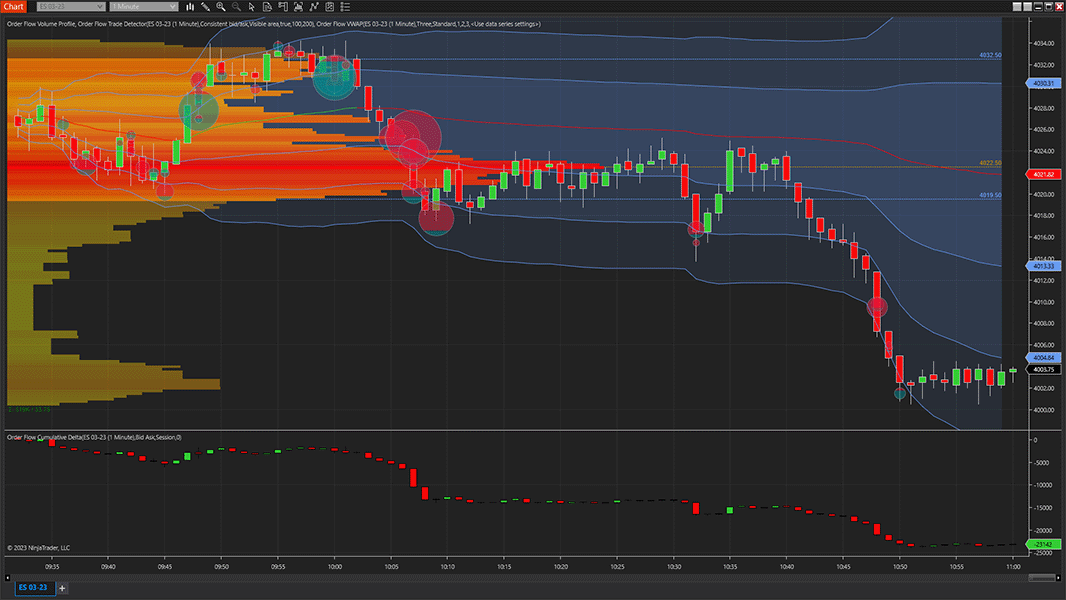
Order flow analysis in trading involves examining the buy and sell orders in the market to understand supply and demand dynamics. This method helps traders identify potential market reversals by analyzing the volume and speed of orders. By observing changes in order flow, traders can spot areas where buying or selling pressure shifts, indicating possible turning points in price movement.
How can I identify market reversals using order flow?
To identify market reversals using order flow, focus on the following key indicators:
1. Volume Analysis: Look for sudden spikes in volume at key support or resistance levels. High volume on a reversal candle often signals strong interest.
2. Order Book Dynamics: Monitor the order book for large buy or sell orders. A significant imbalance can indicate potential reversals as traders adjust their positions.
3. Price Action: Watch for price patterns like double tops/bottoms or engulfing candles that coincide with volume changes, signaling a shift in market sentiment.
4. Delta Analysis: Analyze the difference between buying and selling volume (delta). A shift from negative to positive delta can signal a bullish reversal, while the opposite indicates a bearish reversal.
5. Liquidity Gaps: Identify areas with low liquidity where price can quickly move. A reversal often occurs when price approaches these gaps with increasing order flow.
Combine these techniques to enhance your ability to spot market reversals effectively.
What key indicators in order flow signal a reversal?
Key indicators in order flow that signal a reversal include:
1. Divergence: Look for price moving in one direction while order flow shows increasing selling or buying pressure against it.
2. Volume Spikes: Sudden increases in volume at key levels can indicate a potential reversal, especially if it contradicts the prevailing trend.
3. Order Book Imbalance: A significant shift in the order book, such as a large buy order appearing in a downtrend, can suggest a reversal.
4. Absorption: When large sell orders are absorbed without significant price movement, it may signal buyers stepping in, hinting at a reversal.
5. Change in Sentiment: Monitoring shifts in market sentiment, reflected through order flow, can indicate a potential market turn.
Use these indicators to analyze order flow for effective reversal detection.
How does volume impact order flow and market reversals?
Volume significantly impacts order flow and market reversals. High trading volume during price changes indicates strong interest, suggesting a potential reversal. Conversely, low volume may signal weak momentum, making the reversal less reliable.
When order flow shows increasing buying or selling pressure alongside rising volume, it often confirms a trend. If volume spikes against the prevailing trend, it can indicate exhaustion, signaling a reversal. Monitoring these patterns allows traders to spot market reversals effectively.
What role do buy and sell orders play in spotting reversals?
Buy and sell orders are crucial in spotting market reversals because they indicate shifts in supply and demand. A surge in buy orders can signal bullish sentiment, while an increase in sell orders often reflects bearish sentiment. When buy orders outpace sell orders at a key support level, it may suggest a reversal to the upside. Conversely, if sell orders dominate at resistance, a downward reversal might be imminent. Analyzing the volume and patterns of these orders helps traders identify potential turning points in the market.
How can I use candlestick patterns in conjunction with order flow?
To use candlestick patterns with order flow for spotting market reversals, start by identifying key candlestick formations, like hammers or engulfing patterns, at potential reversal zones. Then, analyze the order flow—look for increased buying or selling volume that confirms the candlestick signal. For instance, if a bullish engulfing pattern appears with high buying volume, it suggests a strong reversal. Additionally, watch for divergence between candlestick patterns and order flow; if price action shows a reversal but order flow remains weak, it could indicate a false signal. Combining these tools enhances your ability to accurately predict market reversals.
What are the common mistakes in order flow analysis for reversals?
Common mistakes in order flow analysis for spotting market reversals include:
1. Ignoring Context: Failing to consider broader market trends can lead to false signals. Always assess the overall market sentiment.
2. Overlooking Volume: Not paying attention to volume levels can misinterpret the strength of a reversal. High volume often confirms a reversal, while low volume may indicate weakness.
3. Relying Solely on Patterns: Focusing only on specific patterns without incorporating other indicators can lead to missed opportunities. Use multiple indicators for confirmation.
4. Inconsistent Timeframes: Analyzing different timeframes without aligning them can create confusion. Stick to a consistent timeframe for clearer signals.
5. Ignoring Market Depth: Overlooking order book depth can result in misjudging support and resistance levels. Check the buy/sell orders to gauge market intentions.
6. Confirmation Bias: Allowing preconceived notions to influence analysis can lead to errors. Stay objective and open to all possible outcomes.
7. Neglecting News Events: Disregarding upcoming news or events can lead to unexpected market movements. Always factor in potential catalysts that could impact reversals.
How can I combine order flow with technical analysis for better predictions?
To combine order flow with technical analysis for better predictions, start by identifying key support and resistance levels using technical analysis. Next, analyze order flow to see where large buy or sell orders are placed around these levels. Look for signs of market reversal, such as sudden shifts in volume or price action that contradict the prevailing trend. Use tools like volume profile or delta analysis to assess buying and selling pressure. When you spot a significant shift in order flow at these technical levels, it may signal a potential reversal. Always confirm with additional indicators for stronger signals.
What tools are best for analyzing order flow effectively?
The best tools for analyzing order flow effectively include:
1. Order Flow Software: Tools like Sierra Chart, NinjaTrader, and TradingView offer advanced order flow analytics.
2. Footprint Charts: These visualize volume at price levels, helping identify buying and selling pressure.
3. Market Depth (Level II): Provides insights into pending orders, showing real-time supply and demand.
4. Time and Sales (Tape Reading): Displays actual trades, helping spot trends and reversals based on volume spikes.
5. Volume Profile: Analyzes trading volume across price levels to highlight significant support and resistance zones.
Using these tools can enhance your ability to spot market reversals through order flow analysis.
How do market orders vs. limit orders affect order flow analysis?
Market orders execute immediately at the current market price, influencing order flow by quickly absorbing liquidity and reflecting real-time demand. Limit orders, on the other hand, wait for a specific price, adding to the order book but indicating potential resistance or support levels. Analyzing the balance between these orders helps identify market reversals. A surge in market orders can signal strong momentum, while a buildup of limit orders may suggest sellers or buyers are ready to step in, indicating a possible reversal point.
Learn about The Role of Market Orders in Day Trading Order Flow
Can order flow analysis predict short-term vs. long-term reversals?
Yes, order flow analysis can help predict both short-term and long-term market reversals. For short-term reversals, traders look for sudden surges in buying or selling volume, changes in order book dynamics, or significant shifts in market sentiment. Long-term reversals often require analyzing cumulative order flow patterns, trends in liquidity, and sustained buying or selling pressure over time. By monitoring these factors, traders can identify potential reversal points effectively.
Learn about Order Flow Analysis vs. Technical Analysis in Day Trading
What are the psychological aspects behind order flow and market reversals?
Order flow analysis reveals psychological aspects like fear and greed that drive market reversals. When buyers overwhelm sellers, it indicates strong bullish sentiment, while a surge of sellers can signal bearish pressure. Traders often react to price movements based on collective emotions, leading to overreactions. For instance, a sudden spike in volume might reflect panic selling, suggesting a potential reversal as sentiment shifts. Recognizing these patterns in order flow helps traders anticipate changes in market direction, leveraging psychological triggers to spot reversals effectively.
How do news events influence order flow and potential reversals?
News events can significantly impact order flow by creating sudden shifts in supply and demand. When positive news breaks, buying pressure often increases, leading to upward price movements. Conversely, negative news can trigger selling, causing prices to drop.
Traders watch order flow closely during these events. A surge in buy orders after favorable news can indicate strong bullish sentiment, while a spike in sell orders following bad news may signal bearish trends.
Potential reversals can be identified when order flow diverges from price action. For example, if prices rise but order flow shows weakening buying interest, it may suggest an imminent reversal. Conversely, if prices fall but order flow indicates strong buying, a bottom may be forming.
In summary, news events change order flow dynamics, and analyzing these shifts helps spot potential market reversals.
What strategies can I use to trade reversals identified through order flow?
To trade reversals identified through order flow, consider these strategies:
1. Identify Key Levels: Look for significant support and resistance levels where price reversals often occur.
2. Watch Volume: Analyze volume spikes at these levels. Increased volume can indicate stronger reversals.
3. Use Limit Orders: Place limit orders slightly above resistance or below support to catch reversals as they occur.
4. Look for Divergence: Check for divergence between price and order flow indicators. For example, if prices are making new lows but order flow shows less selling pressure, a reversal may be imminent.
5. Employ Time Frames: Monitor multiple time frames. A reversal on a higher time frame can provide stronger signals than on a lower one.
6. Confirm with Price Action: Wait for confirmation through candlestick patterns, such as pin bars or engulfing patterns, before entering a trade.
7. Set Stop Losses: Always use stop losses to protect your capital in case the reversal fails.
8. Manage Risk: Consider the risk-reward ratio before entering trades. Aim for at least 2:1 for better long-term success.
By applying these strategies, you can effectively trade market reversals identified through order flow analysis.
How can I backtest order flow analysis for spotting market reversals?
To backtest order flow analysis for spotting market reversals, follow these steps:
1. Data Collection: Gather historical order flow data, including volume, price levels, and trades.
2. Identify Key Patterns: Look for reversal signals like absorption, imbalances, or increased volume at critical levels.
3. Define Entry and Exit Criteria: Set specific rules for when to enter a trade based on order flow signals and when to exit.
4. Simulate Trades: Use a backtesting tool or software to simulate trades based on your criteria over the historical data.
5. Analyze Results: Evaluate your performance metrics—win rate, risk-reward ratio, and drawdowns—to assess the effectiveness of your strategy.
6. Refine Strategy: Adjust your criteria and repeat the process to improve accuracy in spotting market reversals.
This systematic approach helps you validate your order flow analysis methodology for identifying market reversals effectively.
Learn about How to Incorporate Order Flow Analysis into Your Trading Routine
What are the limitations of order flow analysis in predicting market reversals?
Order flow analysis has several limitations in predicting market reversals. First, it relies heavily on real-time data, which can be noisy and subject to rapid changes, making it difficult to discern true market sentiment. Second, order flow does not account for external factors like news events or economic reports that can disrupt established patterns. Additionally, it may lead to false signals, as large orders can be executed for reasons unrelated to market direction, such as hedging or liquidation. Lastly, order flow analysis often requires substantial experience and context to interpret correctly, limiting its effectiveness for novice traders.
Conclusion about Spotting Market Reversals Through Order Flow Analysis
In conclusion, mastering order flow analysis is essential for effectively spotting market reversals. By understanding the dynamics of buy and sell orders, analyzing volume, and utilizing key indicators, traders can enhance their predictive capabilities. Incorporating candlestick patterns and technical analysis further refines your approach, while being aware of common pitfalls ensures a more accurate assessment. For those looking to deepen their trading knowledge and skills, DayTradingBusiness offers valuable insights and resources to help you navigate the complexities of order flow analysis.
Sources:
- Currency Orders and Exchange-Rate Dynamics: Explaining the ...
- Twenty years of the four-factor prothrombin complex concentrate ...
- Desmopressin treatment improves platelet function under flow in ...
- Limb-threatening Deep Venous Thrombosis Complicating Warfarin ...
- Evaluation of andexanet alfa and four‐factor prothrombin complex ...
- Value of hospital anticoagulation stewardship programme: A ...