Did you know that even professional traders can sometimes mistake a coffee stain on their chart for a bullish flag? In the world of day trading, pattern analysis is crucial, yet many traders fall into common pitfalls that can lead to costly mistakes. This article delves into the most frequent missteps in pattern analysis, offers tips to enhance your skills, and explains how to recognize signs of misinterpretation. We’ll explore the impact of emotional biases, the importance of market context, and how to avoid confirmation bias in your strategies. Additionally, we’ll discuss essential tools for accurate analysis, the effect of news events, and how to distinguish between reliable and unreliable patterns. With insights from DayTradingBusiness, you’ll learn best practices for documenting trades and effectively backtesting your strategies, ensuring you navigate the trading landscape with confidence.
What are the most common mistakes in day trading pattern analysis?
Common mistakes in day trading pattern analysis include:
1. Ignoring volume: Traders often overlook volume trends, which can indicate the strength of a pattern.
2. Overtrading: Frequently jumping into trades based on minor patterns can lead to unnecessary losses.
3. Misinterpreting patterns: Misunderstanding chart patterns or their implications can result in poor decision-making.
4. Lack of a trading plan: Not having a clear strategy for entry and exit points can lead to impulsive trades.
5. Failing to adapt: Sticking rigidly to patterns without considering market conditions can be detrimental.
6. Emotional trading: Letting fear or greed drive decisions can overshadow objective analysis.
7. Neglecting risk management: Failing to set stop losses can expose traders to significant losses.
Avoiding these mistakes can improve day trading success.
How can I improve my pattern recognition skills for day trading?
To improve your pattern recognition skills for day trading, focus on these strategies:
1. Study Charts Regularly: Analyze historical price charts daily to familiarize yourself with various patterns like head and shoulders, flags, and triangles.
2. Use Pattern Recognition Tools: Leverage software that highlights patterns automatically to enhance your understanding and speed of recognition.
3. Practice with Simulated Trading: Engage in paper trading to apply pattern recognition in real-time without financial risk.
4. Keep a Trading Journal: Document your trades, noting patterns you recognized and outcomes. This helps reinforce learning.
5. Learn from Mistakes: Identify common mistakes in your pattern analysis and adjust your strategy accordingly.
6. Focus on a Few Patterns: Master a handful of patterns instead of trying to learn them all. This depth will improve your recognition skills.
7. Stay Updated: Follow market news and events, as they can influence pattern reliability and recognition.
By consistently applying these methods, you'll enhance your ability to recognize patterns, ultimately improving your day trading performance.
Why do traders fail in pattern analysis during day trading?
Traders often fail in pattern analysis during day trading due to several key mistakes. Firstly, they may rely too heavily on historical patterns without considering current market conditions, leading to poor predictions. Secondly, many traders overlook the importance of volume; patterns without significant volume may not hold up. Thirdly, emotional decision-making can cloud judgment, causing traders to misinterpret or ignore patterns. Additionally, a lack of a solid trading plan can result in inconsistent analysis, making it easy to misread signals. Lastly, insufficient backtesting of patterns can lead to overconfidence in their effectiveness.
What are the signs of misinterpretation in trading patterns?
Signs of misinterpretation in trading patterns include:
1. False Breakouts: When a price moves past a support or resistance level but quickly reverses, indicating a misread of market sentiment.
2. Inconsistent Volume: Low volume during a pattern formation can suggest a lack of conviction, leading to misinterpretation of the pattern's strength.
3. Ignoring Context: Failing to consider market news or broader trends can skew the interpretation of a pattern.
4. Overreliance on Indicators: Relying too heavily on technical indicators without confirming with price action can lead to misinterpretations.
5. Pattern Recognition Bias: Seeing patterns that aren't there, often due to cognitive biases, can lead to poor trading decisions.
6. Reversal Patterns in Trend Markets: Misreading continuation patterns as reversal signals in a strong trend can cause significant losses.
7. Late Entry or Exit: Entering or exiting trades too late based on a misinterpretation of the pattern can result in missed opportunities or losses.
How does emotional bias affect day trading pattern analysis?
Emotional bias can significantly distort day trading pattern analysis. Traders may rely too heavily on their emotions, leading them to misinterpret patterns. For instance, fear can cause a trader to exit a position too early, while greed might push them to hold onto a losing trade longer than necessary. This emotional interference can cloud judgment, resulting in poor decision-making and missed opportunities. Ultimately, recognizing and managing emotional bias is crucial for accurate pattern analysis in day trading.
What role does market context play in pattern analysis?
Market context is crucial in pattern analysis because it helps traders understand the conditions under which patterns form. Ignoring market trends, news events, and sentiment can lead to misinterpretation of patterns. For example, a bullish pattern in a downtrending market may not hold. Traders should always consider broader market dynamics to avoid common mistakes like overtrading or misreading signals. Analyzing volume and volatility within the context also enhances the reliability of the patterns observed.
How can I avoid confirmation bias in trading strategies?

To avoid confirmation bias in trading strategies, regularly challenge your assumptions by seeking contrary evidence. Diversify your information sources; follow analysts with different viewpoints. Keep a trading journal to document decisions and outcomes, helping you analyze mistakes objectively. Use data-driven analysis instead of relying solely on gut feelings. Set clear criteria for entering and exiting trades, and stick to them, regardless of personal beliefs. Regularly review your strategies and adjust based on performance rather than emotional attachment.
What tools can help with accurate pattern analysis in day trading?
To enhance accuracy in pattern analysis for day trading, consider using these tools:
1. Charting Software: Platforms like TradingView or Thinkorswim offer advanced charting capabilities and technical indicators.
2. Technical Analysis Tools: Use tools like TrendSpider for automated analysis and pattern recognition.
3. Backtesting Software: Programs like Amibroker allow you to test strategies against historical data.
4. Real-time Data Feeds: Services like Livevol or eSignal provide up-to-the-minute market data to inform your analysis.
5. News Aggregators: Tools like Benzinga Pro help track market-moving news that can impact patterns.
Utilizing these tools can significantly reduce common mistakes in day trading pattern analysis.
How do false breakouts impact pattern analysis?
False breakouts can mislead traders by creating the illusion of a trend change or continuation. They often result in premature entries or exits, causing losses. Traders may misinterpret these signals, leading to poor decision-making in pattern analysis. Recognizing false breakouts helps refine strategies, improve risk management, and enhance overall trading performance.
What common patterns should I focus on as a day trader?
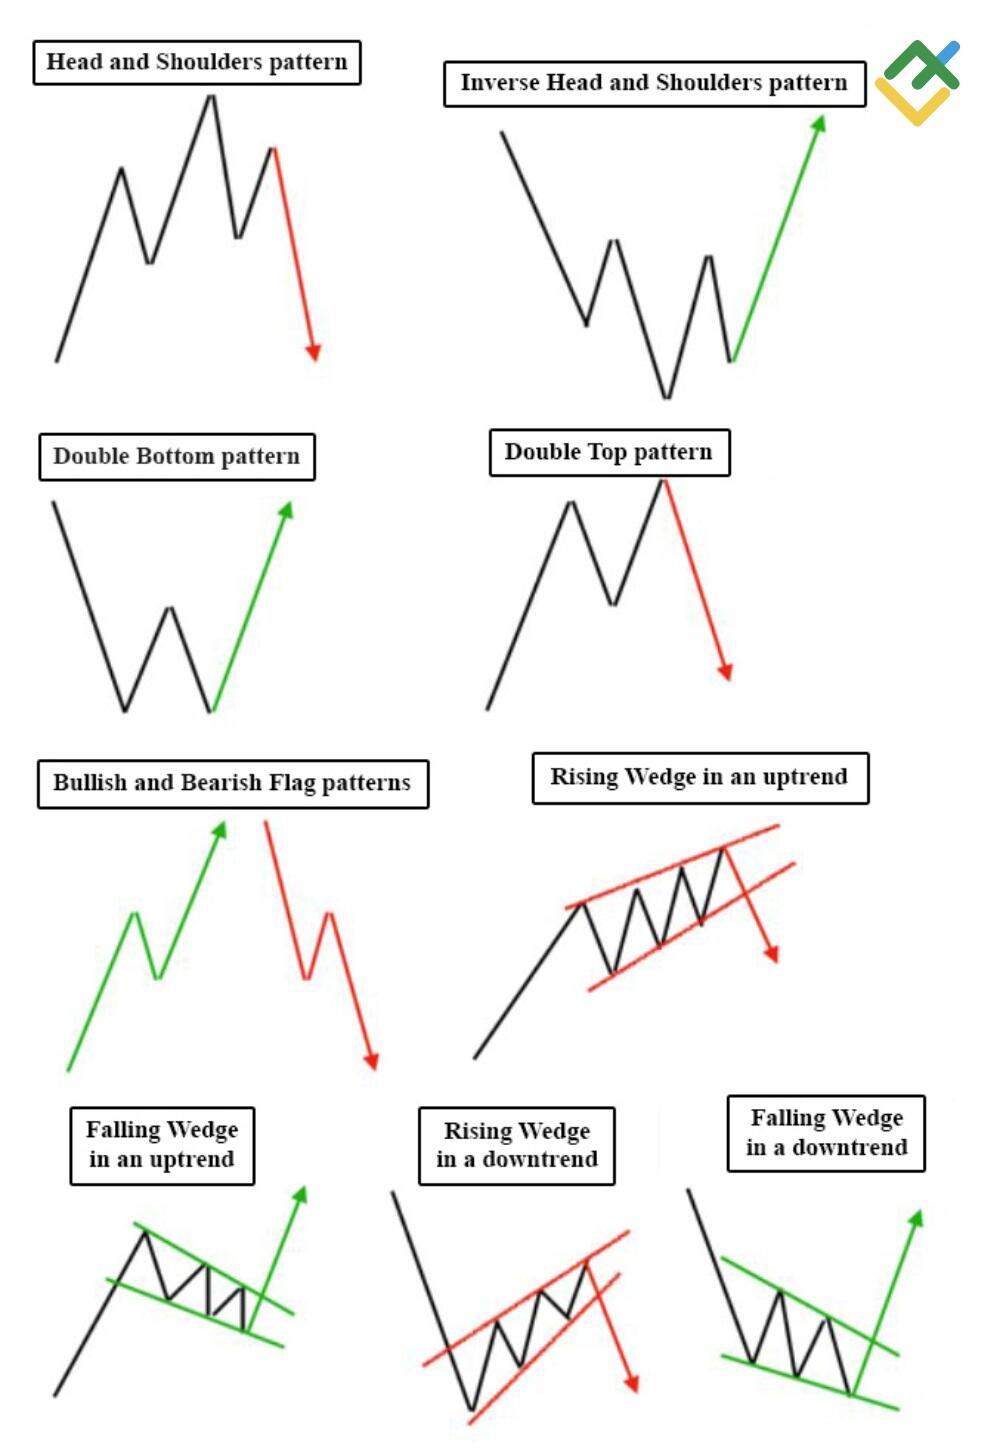
Focus on these common patterns in day trading:
1. Breakouts: Identify stocks that break through resistance levels with high volume.
2. Reversals: Watch for signs of trend reversals, like double tops or bottoms.
3. Flags and Pennants: Look for these continuation patterns after strong price movements.
4. Moving Averages: Use crossovers as signals for potential buy or sell opportunities.
5. Volume Spikes: Significant volume can confirm the strength of a price move.
Avoid overanalyzing and stick to these key patterns for better trading decisions.
How can I differentiate between reliable and unreliable patterns?
To differentiate between reliable and unreliable patterns in day trading, focus on the following:
1. Volume Confirmation: Reliable patterns often show increased volume during breakouts or reversals. Unreliable patterns may lack this support.
2. Historical Performance: Check how similar patterns performed in the past. Reliable patterns typically have a history of consistent outcomes.
3. Market Context: Analyze the broader market conditions. Patterns that align with overall trends are more trustworthy, while those that contradict them may be unreliable.
4. Timeframe Consistency: Verify patterns across multiple timeframes. A pattern that appears on a daily chart but not on a 5-minute chart may be less reliable.
5. Risk Management: Set clear stop-loss levels. If a pattern fails and hits your stop, it’s a sign of unreliability.
6. News Impact: Be aware of upcoming news events. Patterns can become unreliable before significant news due to volatility.
By using these criteria, you can better assess the reliability of trading patterns.
What impact do news events have on trading patterns?
News events can significantly influence trading patterns by causing volatility and shifts in market sentiment. Positive news often leads to price spikes, while negative news can trigger sharp declines. Traders may overreact to news, leading to erratic patterns and false signals. It's crucial to differentiate between short-term reactions and long-term trends to avoid making impulsive decisions based on fleeting news. Recognizing this can help traders make more informed choices and refine their pattern analysis.
Learn about How News Events Impact Day Trading Decisions
How can I backtest my pattern analysis effectively?
To backtest your pattern analysis effectively, follow these steps:
1. Select a Trading Platform: Use a trading platform that allows for backtesting, such as TradingView or MetaTrader.
2. Define Your Patterns: Clearly the patterns you want to test, including entry and exit points.
3. Gather Historical Data: Obtain high-quality historical price data for the asset you’re analyzing.
4. Set Up Your Backtest: Input your patterns into the platform, specifying the conditions for trades based on your analysis.
5. Run the Backtest: Execute the backtest and analyze the results, focusing on win rates, average returns, and drawdowns.
6. Analyze Results: Review the trades taken, noting any patterns in losses or missed opportunities.
7. Refine Your Strategy: Adjust your patterns based on the backtest results and retest to improve accuracy.
8. Document Findings: Keep a detailed record of your tests to track improvements and identify recurring mistakes.
By following these steps, you can effectively backtest your pattern analysis and improve your day trading strategy.
What are the best practices for documenting trading patterns?
To effectively document trading patterns, follow these best practices:
1. Clear Entries and Exits: Note the exact price points for your entries and exits, including the rationale behind each decision.
2. Consistent Format: Use a uniform template for documenting trades. This could include date, time, asset, strategy used, and outcomes.
3. Visual Aids: Incorporate charts or screenshots to illustrate patterns, making it easier to analyze visually later.
4. Emotional State: Record your emotions during trades to identify any psychological biases affecting your decisions.
5. Review and Reflect: Regularly review your documented trades to identify patterns in your successes and mistakes.
6. Use Annotations: Add notes explaining why you entered or exited a trade, highlighting key indicators or events.
7. Track Performance Metrics: Keep metrics like win/loss ratio, average profit/loss, and trade duration to evaluate overall performance.
8. Stay Objective: Focus on the facts of the trade rather than personal feelings or assumptions to maintain objectivity in your analysis.
Implementing these practices will help you avoid common mistakes in day trading pattern analysis and improve your overall trading strategy.
How do volume and volatility influence pattern analysis?
Volume and volatility are crucial for effective pattern analysis in day trading. High volume confirms the strength of a price movement, indicating that the pattern is more likely to hold. Conversely, low volume can signal a weak pattern, making it less reliable.
Volatility impacts how patterns develop; higher volatility often leads to more rapid price swings, which can distort patterns and lead to false signals. Traders should prioritize patterns formed in high volume and moderate volatility for better accuracy. Avoid relying on patterns that lack volume support or occur during extreme volatility, as they are prone to failure.
What mistakes should beginners avoid in day trading pattern analysis?
Beginners in day trading pattern analysis should avoid these common mistakes:
1. Ignoring Volume: Relying solely on price patterns without considering volume can lead to false signals. Always check if a pattern is supported by significant volume.
2. Overtrading: Chasing every pattern can lead to losses. Focus on high-probability setups rather than forcing trades.
3. Neglecting Risk Management: Failing to set stop-loss orders can result in larger losses. Always define your risk before entering a trade.
4. Lack of a Trading Plan: Trading without a clear plan can lead to emotional decisions. Develop a strategy that outlines entry, exit, and risk parameters.
5. Underestimating Market Conditions: Patterns can behave differently in various market conditions. Be aware of overall market trends and sentiment.
6. Overanalyzing: Getting caught up in too many indicators can lead to confusion. Stick to a few reliable patterns and indicators.
7. Ignoring News Events: Economic reports or news can drastically affect price movements. Stay informed about upcoming events that could impact the market.
8. Focusing on the Wrong Time Frame: Using a time frame that doesn’t match your trading style can lead to misinterpretation of patterns. Choose a time frame that suits your trading strategy.
Avoiding these mistakes can enhance your pattern analysis and improve your trading outcomes.
Learn about Common Mistakes in Day Trading Analysis to Avoid
Conclusion about Common Mistakes in Day Trading Pattern Analysis
In conclusion, avoiding common mistakes in day trading pattern analysis is crucial for success. By enhancing your pattern recognition skills, understanding market context, and mitigating emotional biases, you can improve your trading outcomes. Utilizing the right tools and focusing on reliable patterns will further bolster your strategy. Always remember to backtest your analyses and document your findings for continuous improvement. For comprehensive support and insights, consider leveraging the resources offered by DayTradingBusiness to refine your trading approach.
Learn about Common Mistakes in Day Trading Sentiment Analysis
Sources:
- Understanding the High Failure Rate in Trading: Why 99% of ...
- An analysis of intraday patterns in price clustering on the Tokyo ...
- The behavior of daily stock market trading volume - ScienceDirect
- The Round-the-Clock Market for U.S. Treasury Securities
- Opinion Paper: “So what if ChatGPT wrote it?” Multidisciplinary ...
- The investment behavior and performance of various investor types ...