Did you know that even the best traders can sometimes get tricked by a mirage on the trading charts? In the world of trading, spotting fakeouts can be as tricky as finding a needle in a haystack. This article from DayTradingBusiness dives into the critical role of volume analysis in identifying genuine market movements versus deceptive fakeouts. You'll learn the fundamentals of volume analysis, how it reflects market trends, and the telltale signs of fakeouts. We’ll also cover essential volume patterns, the importance of price action, and how moving averages can enhance your analysis. Plus, discover practical tools and common pitfalls to avoid, ensuring you’re well-equipped to enhance your trading strategies and skills.
What is volume analysis in trading?
Volume analysis in trading refers to evaluating the amount of a security traded over a specific period to assess the strength of a price movement. To spot fakeouts, look for discrepancies between price action and volume. A price breakout on low volume suggests a potential fakeout, as it lacks strong support. Conversely, a breakout accompanied by high volume indicates genuine interest and likely continuation. Always compare volume spikes with historical levels to identify anomalies.
How does volume indicate market trends?
Volume indicates market trends by showing the strength of price movements. High volume during a price increase suggests strong buyer interest, confirming a bullish trend. Conversely, high volume during a price drop indicates strong selling pressure, signaling a bearish trend.
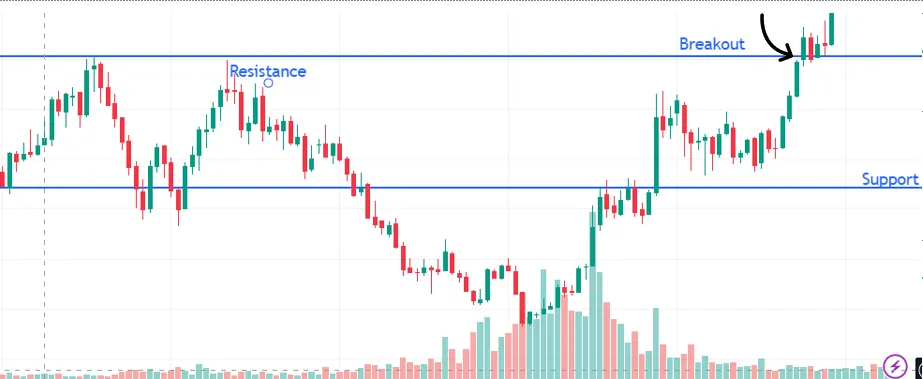
Fakeouts occur when price moves in one direction but lacks corresponding volume. For example, if a stock breaks resistance but volume is low, it may retrace quickly, misleading traders. Monitoring volume helps identify these fakeouts, as genuine trends typically show consistent volume support. Always look for volume spikes at key price levels to confirm trend validity.
What are fakeouts in trading?
Fakeouts in trading occur when the price briefly breaks through a support or resistance level but then quickly reverses direction. To spot fakeouts using volume analysis, look for low volume during the breakout; this indicates a lack of conviction. Conversely, if the price breaks out with high volume, it’s more likely to be a genuine move. Watch for price action that returns below the broken level with increased volume, confirming the fakeout.
How can I identify a fakeout using volume?
To identify a fakeout using volume, look for these key signals:
1. Volume Spike: A significant increase in volume during a breakout suggests strength. If the price moves but the volume is low, it may indicate a fakeout.
2. Volume Divergence: If the price breaks above resistance with low volume while the previous moves had higher volume, it signals potential weakness.
3. Volume Confirmation: After a breakout, watch for sustained volume. If the price retraces quickly with high volume, it likely indicates a fakeout.
4. Volume Patterns: Compare the breakout volume to historical patterns. A break with volume below average may hint at a false move.
5. Follow-Up Action: Observe the next few candles. If the price fails to hold the breakout level and volume decreases, it’s often a fakeout.
Use these volume analysis techniques to enhance your trading decisions and spot potential fakeouts effectively.
What volume patterns should I look for to spot fakeouts?
To spot fakeouts using volume analysis, watch for these patterns:
1. Volume Spike on Breakout: Genuine breakouts typically show a sharp increase in volume. If the breakout occurs with low volume, it may indicate a fakeout.
2. Divergence: If price moves higher but volume declines, it suggests weakening momentum, signaling a potential fakeout.
3. Volume Clusters: Look for high volume near support or resistance levels. If a breakout occurs without breaking these volume clusters, it might reverse.
4. Volume Confirmation: After a breakout, check for sustained volume. A quick drop in volume after a breakout often precedes a fakeout.
5. Volume Patterns: Observe if the volume follows a pattern—consolidation before a breakout should show increasing volume. If it doesn’t, be cautious.
Monitor these volume patterns to effectively identify potential fakeouts.
How does low volume signal a potential fakeout?
Low volume during a price movement can indicate a potential fakeout because it suggests a lack of genuine interest or commitment from traders. When prices rise or fall significantly but the volume is low, it often means that the move isn't backed by strong buying or selling pressure. This can lead to false breakouts where the price quickly reverses, trapping traders who entered based on the misleading signal. Always look for volume confirmation; strong trends should be accompanied by high volume to signal authenticity.
What are the signs of a genuine breakout versus a fakeout?
Signs of a genuine breakout include strong volume that exceeds average levels, sustained price movement above key resistance, and confirmation on multiple time frames. A fakeout often shows low volume, quick reversals back below resistance, and lack of follow-through in subsequent sessions. Look for volume spikes during breakouts; if volume decreases while the price moves up, it’s likely a fakeout.
How can I use volume spikes to detect fakeouts?
To detect fakeouts using volume spikes, watch for sudden increases in trading volume that accompany price movements. If the price breaks through a support or resistance level but the volume is low, it may indicate a fakeout. Conversely, a genuine breakout usually has high volume supporting the move. Monitor the volume during key price levels; if a spike occurs but the price reverses quickly, it likely signals a fakeout. Always compare the volume to the average volume for that period to confirm the significance of the spike.
What role does price action play in volume analysis?
Price action reveals market sentiment, while volume analysis confirms it. When price moves significantly but volume is low, it may indicate a fakeout—an illusion of strength without solid backing. Conversely, a strong price move with high volume signals genuine interest, helping traders identify true breakouts. For effective volume analysis, always compare volume spikes with price action to distinguish between authentic trends and potential traps.
How can moving averages help in volume analysis for fakeouts?
Moving averages smooth out price data over a specific period, helping traders identify trends more clearly. In volume analysis, they can highlight unusual spikes or drops in trading volume. When a price breaks a trend line but the moving average shows declining volume, it may signal a fakeout. Conversely, if the volume increases alongside a price movement that crosses the moving average, it indicates stronger conviction and less likelihood of a fakeout. Use moving averages as a filter to confirm volume trends and avoid getting trapped in false signals.
What tools can assist in volume analysis?
To assist in volume analysis and spot fakeouts, use these tools:
1. Volume Indicators: Use indicators like On-Balance Volume (OBV) and Chaikin Money Flow (CMF) to assess buying and selling pressure.
2. Candlestick Patterns: Analyze candlestick patterns alongside volume spikes to confirm trends or reversals.
3. Moving Averages: Apply volume-weighted moving averages to smooth out volume data and identify trends more clearly.
4. Volume Profile: Utilize volume profile charts to see where most trading occurred at specific price levels, highlighting support and resistance zones.
5. Technical Analysis Software: Platforms like TradingView or MetaTrader offer built-in tools for real-time volume analysis and charting.
6. Market Sentiment Tools: Use sentiment analysis tools to gauge overall market mood, which can influence volume behavior.
These tools can help identify genuine price moves versus fakeouts.
How do different timeframes affect volume analysis?
Different timeframes reveal varying volume patterns that can indicate potential fakeouts. In shorter timeframes, like 5-minute or 15-minute charts, volume spikes may signal quick reversals or breakouts that could be false. On the other hand, longer timeframes, like daily or weekly charts, provide more reliable volume trends, helping to confirm trends or warn against fakeouts.
For instance, if a stock breaks a resistance level with high volume on a daily chart, it’s more trustworthy than a similar move on a 5-minute chart. Monitoring volume across multiple timeframes helps identify discrepancies that can signal a fakeout. Always consider volume in context; a sudden drop in volume after a breakout can suggest a lack of conviction, indicating a potential fakeout.
Can volume analysis be used in all trading strategies?
Yes, volume analysis can be used in all trading strategies. It helps identify fakeouts by confirming price movements. For example, a breakout accompanied by high volume suggests strength, while a breakout with low volume may indicate a potential fakeout. Traders should look for volume spikes at key price levels to validate trends and avoid false signals.
What are the common mistakes to avoid when analyzing volume?
1. Ignoring Context: Don’t analyze volume in isolation; consider price action and market conditions.
2. Overlooking Trends: Avoid using volume analysis without recognizing whether the market is bullish or bearish.
3. Misinterpreting Low Volume: Low volume doesn’t always indicate weakness; it can signal consolidation or lack of interest.
4. Relying Solely on Volume Spikes: A sudden volume increase is not always a sign of a trend change; confirm with price movement.
5. Neglecting Historical Volume: Compare current volume to historical averages for better context.
6. Failing to Use Multiple Timeframes: Analyze volume across different timeframes to capture trends and avoid false signals.
7. Disregarding News Events: Market news can skew volume; account for these factors when analyzing.
8. Not Considering Volume Patterns: Look for patterns like accumulation or distribution to understand potential fakeouts.
9. Ignoring Divergence: Watch for volume divergence from price; it can indicate potential reversals.
10. Relying on Volume Alone: Combine volume analysis with other indicators for more reliable signals.
How do market conditions influence volume and fakeouts?
Market conditions significantly influence volume and fakeouts. In trending markets, higher volume often confirms the trend, while low volume can indicate a fakeout. For example, if a stock breaks through resistance with low volume, it may quickly reverse, signaling a fakeout. Conversely, in volatile markets, sudden spikes in volume can trigger false breakouts. Always watch for consistent volume patterns; a genuine breakout typically shows sustained volume increase, while fakeouts often lack this. Use volume analysis to differentiate between real moves and fakeouts effectively.
How can I practice volume analysis to improve my trading skills?
To practice volume analysis for spotting fakeouts, start by reviewing historical charts of assets you trade. Focus on identifying key price levels where fakeouts often occur.
1. Observe Volume Spikes: When the price breaks through a support or resistance level, check the volume. A genuine breakout usually shows increased volume; a fakeout often has low volume.
2. Use Volume Indicators: Incorporate tools like the On-Balance Volume (OBV) or Volume Moving Averages to assess whether price action is supported by sufficient volume.
3. Analyze Candlestick Patterns: Look for candlestick formations at breakout points. A strong candlestick accompanied by high volume signals a valid move, while weak formations with low volume suggest a fakeout.
4. Backtest Strategies: Backtest your volume analysis methods on different time frames and assets to see how often fakeouts occur and refine your approach based on results.
5. Paper Trade: Implement your volume analysis strategy in a simulated environment to build confidence without risking real capital.
Regularly practicing these steps will help you better recognize fakeouts and enhance your overall trading skills.
Learn about How to Use Volume to Improve Day Trading
Conclusion about How to Spot Fakeouts with Volume Analysis
In conclusion, mastering volume analysis is essential for effectively identifying fakeouts in trading. By understanding how volume correlates with market trends and recognizing specific patterns, traders can differentiate between genuine breakouts and deceptive price movements. Utilizing tools like moving averages and being mindful of market conditions further enhances this skill. For those looking to deepen their knowledge and improve their trading strategies, resources from DayTradingBusiness can provide valuable insights and guidance.