Did you know that the stock market can be influenced by how many people are tweeting about their lunch? In the world of day trading, understanding key sentiment metrics is essential for navigating market movements. This article dives into the crucial sentiment indicators every trader should know, including how these metrics impact decision-making and market trends. You'll discover effective tools for measuring trading sentiment, the influence of social media, and the differences between bullish and bearish sentiment. Additionally, we cover the role of news events, volatility, and how institutional traders leverage sentiment analysis. Finally, we'll explore the limitations of these metrics and how to integrate them into your trading strategy for better outcomes. Join DayTradingBusiness as we unravel the complexities of market sentiment!
What are the key sentiment metrics for day traders?
Key sentiment metrics for day traders include:
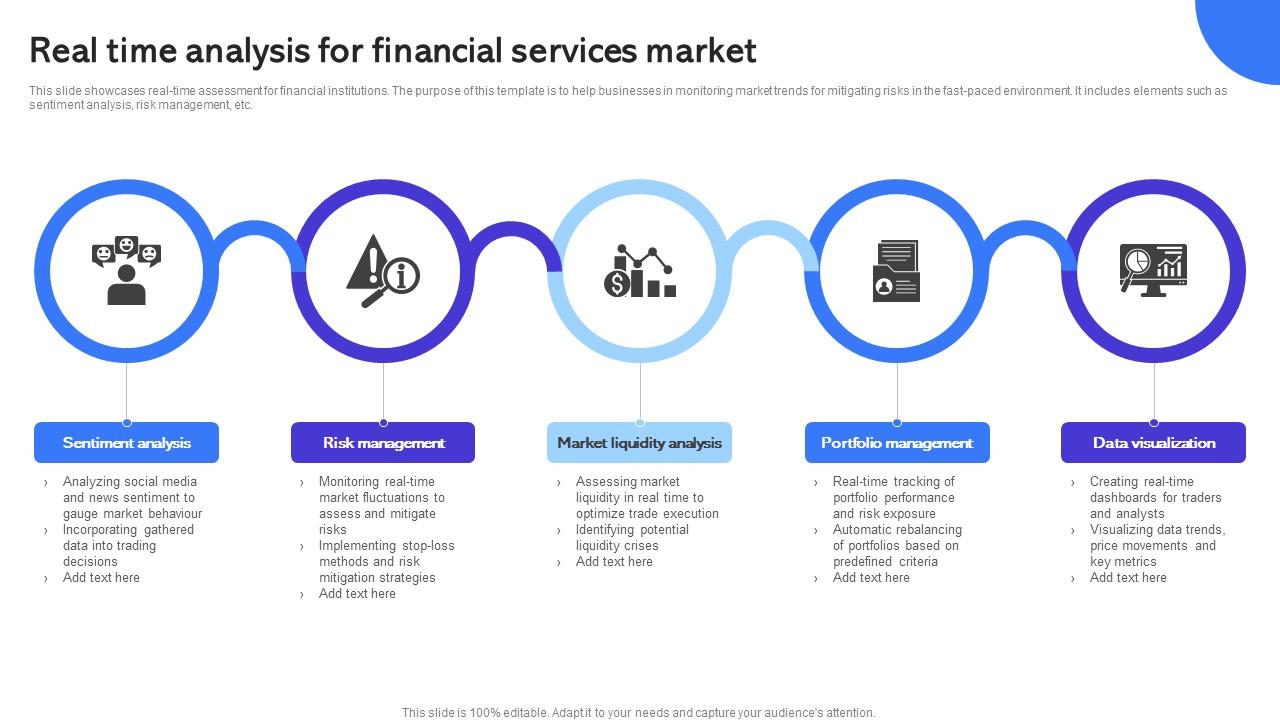
1. Fear and Greed Index: Measures market sentiment based on volatility, market momentum, and social media activity.
2. Put/Call Ratio: Compares the volume of put options to call options, signaling bullish or bearish sentiment.
3. Social Media Sentiment: Analyzes sentiment from platforms like Twitter and Reddit to gauge trader mood and trends.
4. Market News Sentiment: Evaluates headlines and news articles for positive or negative sentiment affecting stocks.
5. Short Interest: Indicates the number of shares sold short; high short interest can signal bearish sentiment.
6. Investor Surveys: Polls like the AAII Sentiment Survey reveal individual investor sentiment toward the market.
These metrics help traders understand market psychology and make informed trading decisions.
How do sentiment metrics impact day trading decisions?
Sentiment metrics impact day trading decisions by providing insights into market psychology. Key metrics include the Fear and Greed Index, which indicates overall market sentiment, and social media sentiment analysis, revealing trader emotions. High bullish sentiment may signal potential price increases, prompting buy decisions, while bearish sentiment can indicate selling opportunities. Additionally, metrics like put/call ratios help assess market sentiment extremes, guiding traders on entry and exit points. Understanding these metrics helps day traders gauge market trends and make informed trading choices.
Which tools can I use to measure trading sentiment?
You can use tools like the Fear & Greed Index, the Commitment of Traders (COT) report, and social media sentiment analysis platforms like StockTwits or Twitter. Other useful tools include sentiment indicators from trading platforms like TradingView or MetaTrader, as well as news sentiment analysis tools like MarketPsych. These tools help gauge market sentiment by analyzing trader behavior and sentiment trends.
What is the role of social media sentiment in trading?
Social media sentiment plays a crucial role in trading by influencing market perception and price movements. Traders analyze sentiment metrics, such as tweet volume, positive or negative sentiment scores, and trending hashtags, to gauge public opinion on stocks. High positive sentiment can signal potential upward trends, while negative sentiment might indicate selling pressure. Monitoring platforms like Twitter, Reddit, and stock-related forums allows traders to identify shifts in sentiment quickly, helping them make informed buy or sell decisions. Understanding these metrics can enhance trading strategies and improve overall market timing.
How can trader sentiment influence market trends?

Trader sentiment influences market trends by shaping buying and selling decisions. Key sentiment metrics include the Fear and Greed Index, which gauges overall market emotion, and the Commitment of Traders report, revealing positioning of futures traders. High bullish sentiment often leads to price increases, while bearish sentiment can trigger sell-offs. Additionally, social media sentiment and news sentiment analysis can highlight trader reactions to events. Monitoring these metrics helps day traders anticipate market movements and adjust strategies accordingly.
What are the differences between bullish and bearish sentiment?
Bullish sentiment indicates optimism about price increases, leading traders to buy assets in anticipation of growth. In contrast, bearish sentiment reflects pessimism, prompting traders to sell or short assets, expecting price declines. Bullish traders focus on positive indicators, like strong earnings or economic growth, while bearish traders pay attention to negative trends, such as market downturns or poor forecasts. Understanding these sentiments helps day traders gauge market trends and make informed decisions.
How do news events affect market sentiment?
News events significantly impact market sentiment by shaping trader perceptions and expectations. Positive news, like strong economic data or earnings beats, can boost confidence, leading to increased buying activity. Conversely, negative news, such as geopolitical tensions or poor economic reports, often triggers selling, resulting in market declines. Key sentiment metrics day traders should monitor include the VIX (volatility index), which measures market fear, and consumer confidence indices, which gauge economic optimism. Social media trends and news sentiment analysis can also provide insights into real-time trader sentiment shifts.
Why is volatility an important sentiment metric?
Volatility is crucial for day traders because it indicates the degree of price fluctuations in a security. High volatility often signals potential for significant price movements, creating opportunities for profits. It helps traders assess risk—higher volatility means greater potential reward, but also increased risk. Understanding volatility allows traders to make informed decisions about entry and exit points, manage their positions effectively, and tailor their strategies to market conditions.
How can I identify market sentiment shifts?
To identify market sentiment shifts, focus on these key sentiment metrics:
1. Fear and Greed Index: This tracks investor emotions and can signal market extremes.
2. Volume Analysis: Sudden spikes in trading volume may indicate a shift in sentiment.
3. Social Media Trends: Monitor platforms like Twitter and Reddit for real-time sentiment changes.
4. News Sentiment: Analyze headlines and news articles for positive or negative tones affecting market mood.
5. Put/Call Ratios: High put options relative to calls suggest bearish sentiment, while the opposite indicates bullishness.
6. Market Surveys: Look at trader sentiment surveys to gauge overall market outlook.
Combining these metrics gives a clearer picture of sentiment shifts, helping you make informed trading decisions.
What are the best sentiment indicators for day trading?
The best sentiment indicators for day trading include:
1. Put/Call Ratio: Measures the volume of put options versus call options. A high ratio suggests bearish sentiment, while a low ratio indicates bullish sentiment.
2. VIX (Volatility Index): Reflects market volatility. A rising VIX often signals fear or uncertainty among traders, while a declining VIX suggests confidence.
3. Market Breadth Indicators: Such as the Advance-Decline Line, show the number of stocks advancing versus declining. A positive breadth indicates bullish sentiment.
4. Social Media Sentiment: Analyzes sentiment from platforms like Twitter or Reddit. Tools that gauge buzz around stocks can reveal trader sentiment shifts.
5. Surveys and Polls: Like the AAII Sentiment Survey, measure investor sentiment directly. High bullish sentiment can precede market corrections.
6. News Sentiment Analysis: Uses algorithms to assess the tone of news articles related to specific stocks or the market. Positive news can drive prices up, while negative news can lead to declines.
Using these indicators helps day traders gauge market sentiment effectively.
How do institutional traders use sentiment metrics?

Institutional traders use sentiment metrics to gauge market mood and predict price movements. They analyze indicators like the Fear & Greed Index, put-call ratios, and social media sentiment to identify bullish or bearish trends. By interpreting these metrics, they can make informed decisions on entry and exit points, adjust positions, and manage risk effectively. For example, elevated fear levels might prompt buying opportunities, while extreme greed could signal a market correction.
Learn about How Do Institutional Traders Use Technical and Fundamental Analysis?
Can sentiment analysis predict price movements?
Yes, sentiment analysis can predict price movements. Key sentiment metrics include social media trends, news sentiment, and investor sentiment surveys. Tracking these metrics helps traders gauge market mood, potentially indicating bullish or bearish trends. For example, a surge in positive tweets about a stock may signal upcoming price increases. Conversely, negative news can foreshadow declines. Effective use of sentiment analysis enables day traders to make informed decisions based on market psychology.
What are the limitations of sentiment metrics in trading?

Sentiment metrics in trading have several limitations. First, they can be subjective and vary widely based on the data source. Second, sentiment analysis often lags behind market movements, leading to delayed reactions. Third, it may not account for fundamental factors that drive price changes. Fourth, extreme sentiment can indicate market tops or bottoms, making it risky if traders rely solely on these metrics. Lastly, sentiment can change rapidly, making it challenging to maintain a consistent trading strategy based on these indicators.
How do investor sentiment surveys work?
Investor sentiment surveys gauge the attitudes and emotions of traders and investors regarding market conditions. They typically involve questions about market direction, buying or selling intentions, and overall confidence levels. Responses are collected from a sample of investors, often through online platforms or financial institutions.
The results are then analyzed to create metrics like the Bullish Percentage Index, which shows the percentage of bullish versus bearish sentiment. These metrics help day traders identify potential market trends and reversals, as extreme sentiment can signal overbought or oversold conditions. Keeping track of these surveys can inform trading strategies and timing decisions.
What role does fear and greed play in trading sentiment?
Fear and greed are primary drivers of trading sentiment. Fear often leads to panic selling, causing prices to drop as traders rush to cut losses. Greed, on the other hand, fuels buying frenzies, pushing prices up as traders chase profits. These emotions create market volatility, influencing key sentiment metrics like the Fear and Greed Index, which gauges overall market sentiment. Understanding how fear and greed impact trading can help traders make informed decisions, manage risk, and identify potential market reversals.
How can I integrate sentiment metrics into my trading strategy?
To integrate sentiment metrics into your trading strategy, start by tracking key indicators like the Fear & Greed Index, market sentiment surveys, and social media sentiment analysis. Use tools like the Commitment of Traders report to gauge positioning among different market participants. Incorporate sentiment analysis from platforms like Twitter or StockTwits to understand public sentiment around specific stocks.
Combine these metrics with technical analysis; for example, when sentiment is overly bullish and technical indicators show overbought conditions, consider taking profits or shorting. Conversely, if sentiment is overly bearish and technicals indicate support, look for buying opportunities. Monitor sentiment changes regularly, as they can signal potential market reversals.
Conclusion about Key Sentiment Metrics Every Day Trader Should Know
Understanding key sentiment metrics is essential for day traders aiming to enhance their decision-making process. By leveraging tools that measure trading sentiment, analyzing social media trends, and recognizing the impact of news events, traders can better anticipate market movements. Sentiment analysis can reveal shifts in market psychology, distinguishing between bullish and bearish phases, and highlighting the roles of fear and greed. While these metrics provide valuable insights, it’s crucial to recognize their limitations and integrate them thoughtfully into a comprehensive trading strategy. For deeper insights and support in mastering these concepts, consider resources from DayTradingBusiness.
Learn about Key Chart Patterns Every Day Trader Should Know
Sources:
- Improving the Odds of Value Investing | CFA Institute Enterprising ...
- Do Sentiment Metrics Matter to the Markets? | CFA Institute ...
- Market sentiment-aware deep reinforcement learning approach for ...
- Media sentiment and international asset prices - ScienceDirect
- A novel strongly-typed Genetic Programming algorithm for ...