Did you know that some traders believe the stock market has a secret language, and it’s not just the charts talking? In this article, we’ll decode the vital day trading indicators that can elevate your trading game. Learn how moving averages can signal opportunities, what the Relative Strength Index (RSI) reveals, and how MACD can refine your decisions. Discover the significance of Bollinger Bands, volume indicators, and candlestick patterns in your strategy. We also discuss the impact of Fibonacci levels, trend lines, and chart patterns on your trading approach. Plus, understand volatility through the Average True Range (ATR) and the role of sentiment analysis. With insights on common pitfalls and the benefits of using multiple indicators, as well as the importance of backtesting, this article equips you with everything you need to enhance your day trading skills. Dive in with DayTradingBusiness for a comprehensive look at interpreting day trading indicator signals!
What are the key day trading indicators to watch?
Key day trading indicators to watch include:
1. Moving Averages (MA): Identify trends by smoothing price data. Look for crossovers between short-term and long-term MAs for buy/sell signals.
2. Relative Strength Index (RSI): Gauge momentum. An RSI above 70 indicates overbought conditions, while below 30 suggests oversold.
3. Volume: Analyze trading volume to confirm price movements. High volume on price increases signals strength; high volume on decreases indicates weakness.
4. Bollinger Bands: Measure volatility. Prices touching the upper band may signal overbought conditions, while touching the lower band may signal oversold.
5. MACD (Moving Average Convergence Divergence): Track momentum and trend direction. Look for MACD line crossovers and divergence from price.
6. Stochastic Oscillator: Compare a security’s closing price to its price range over a specific period. Values above 80 indicate overbought, while below 20 indicate oversold.
Monitor these indicators closely for effective day trading strategies.
How do moving averages signal trading opportunities?
Moving averages signal trading opportunities by smoothing price data to identify trends. A bullish signal occurs when a short-term moving average crosses above a long-term moving average, indicating potential upward momentum. Conversely, a bearish signal arises when a short-term moving average crosses below a long-term moving average, suggesting downward pressure. Traders often look for these crossover points to enter or exit positions, as they highlight shifts in market sentiment. Additionally, moving averages can act as support or resistance levels, providing further trading insights.
What does the Relative Strength Index (RSI) indicate for traders?
The Relative Strength Index (RSI) indicates whether an asset is overbought or oversold, helping traders identify potential reversal points. An RSI above 70 suggests the asset may be overbought, signaling a potential sell opportunity. Conversely, an RSI below 30 indicates an oversold condition, suggesting a potential buy opportunity. Traders often use these signals to enter or exit positions effectively.
How can MACD help in day trading decisions?
MACD helps in day trading by providing signals for potential buy and sell opportunities. When the MACD line crosses above the signal line, it indicates a bullish trend, suggesting a buy. Conversely, when the MACD line crosses below the signal line, it's a bearish signal, indicating a sell. Additionally, traders look at MACD divergence from price trends to identify potential reversals. This can enhance decision-making by confirming trends or signaling caution when price action diverges from MACD signals.
What role do Bollinger Bands play in trading strategies?
Bollinger Bands help traders identify volatility and potential price reversals. When the bands widen, it indicates higher volatility, suggesting that a strong price movement may occur. Conversely, when the bands contract, it signals lower volatility.
Traders use the bands to spot overbought or oversold conditions. A price touching the upper band may suggest overbought conditions, while touching the lower band may indicate oversold conditions. This can help in making buy or sell decisions.
Additionally, trends can be assessed by observing price movement relative to the bands. If prices consistently touch the upper band, it indicates a strong uptrend, while consistent touches on the lower band suggest a downtrend. Integrating Bollinger Bands with other indicators can enhance trading strategies and improve decision-making.
How do volume indicators influence day trading signals?
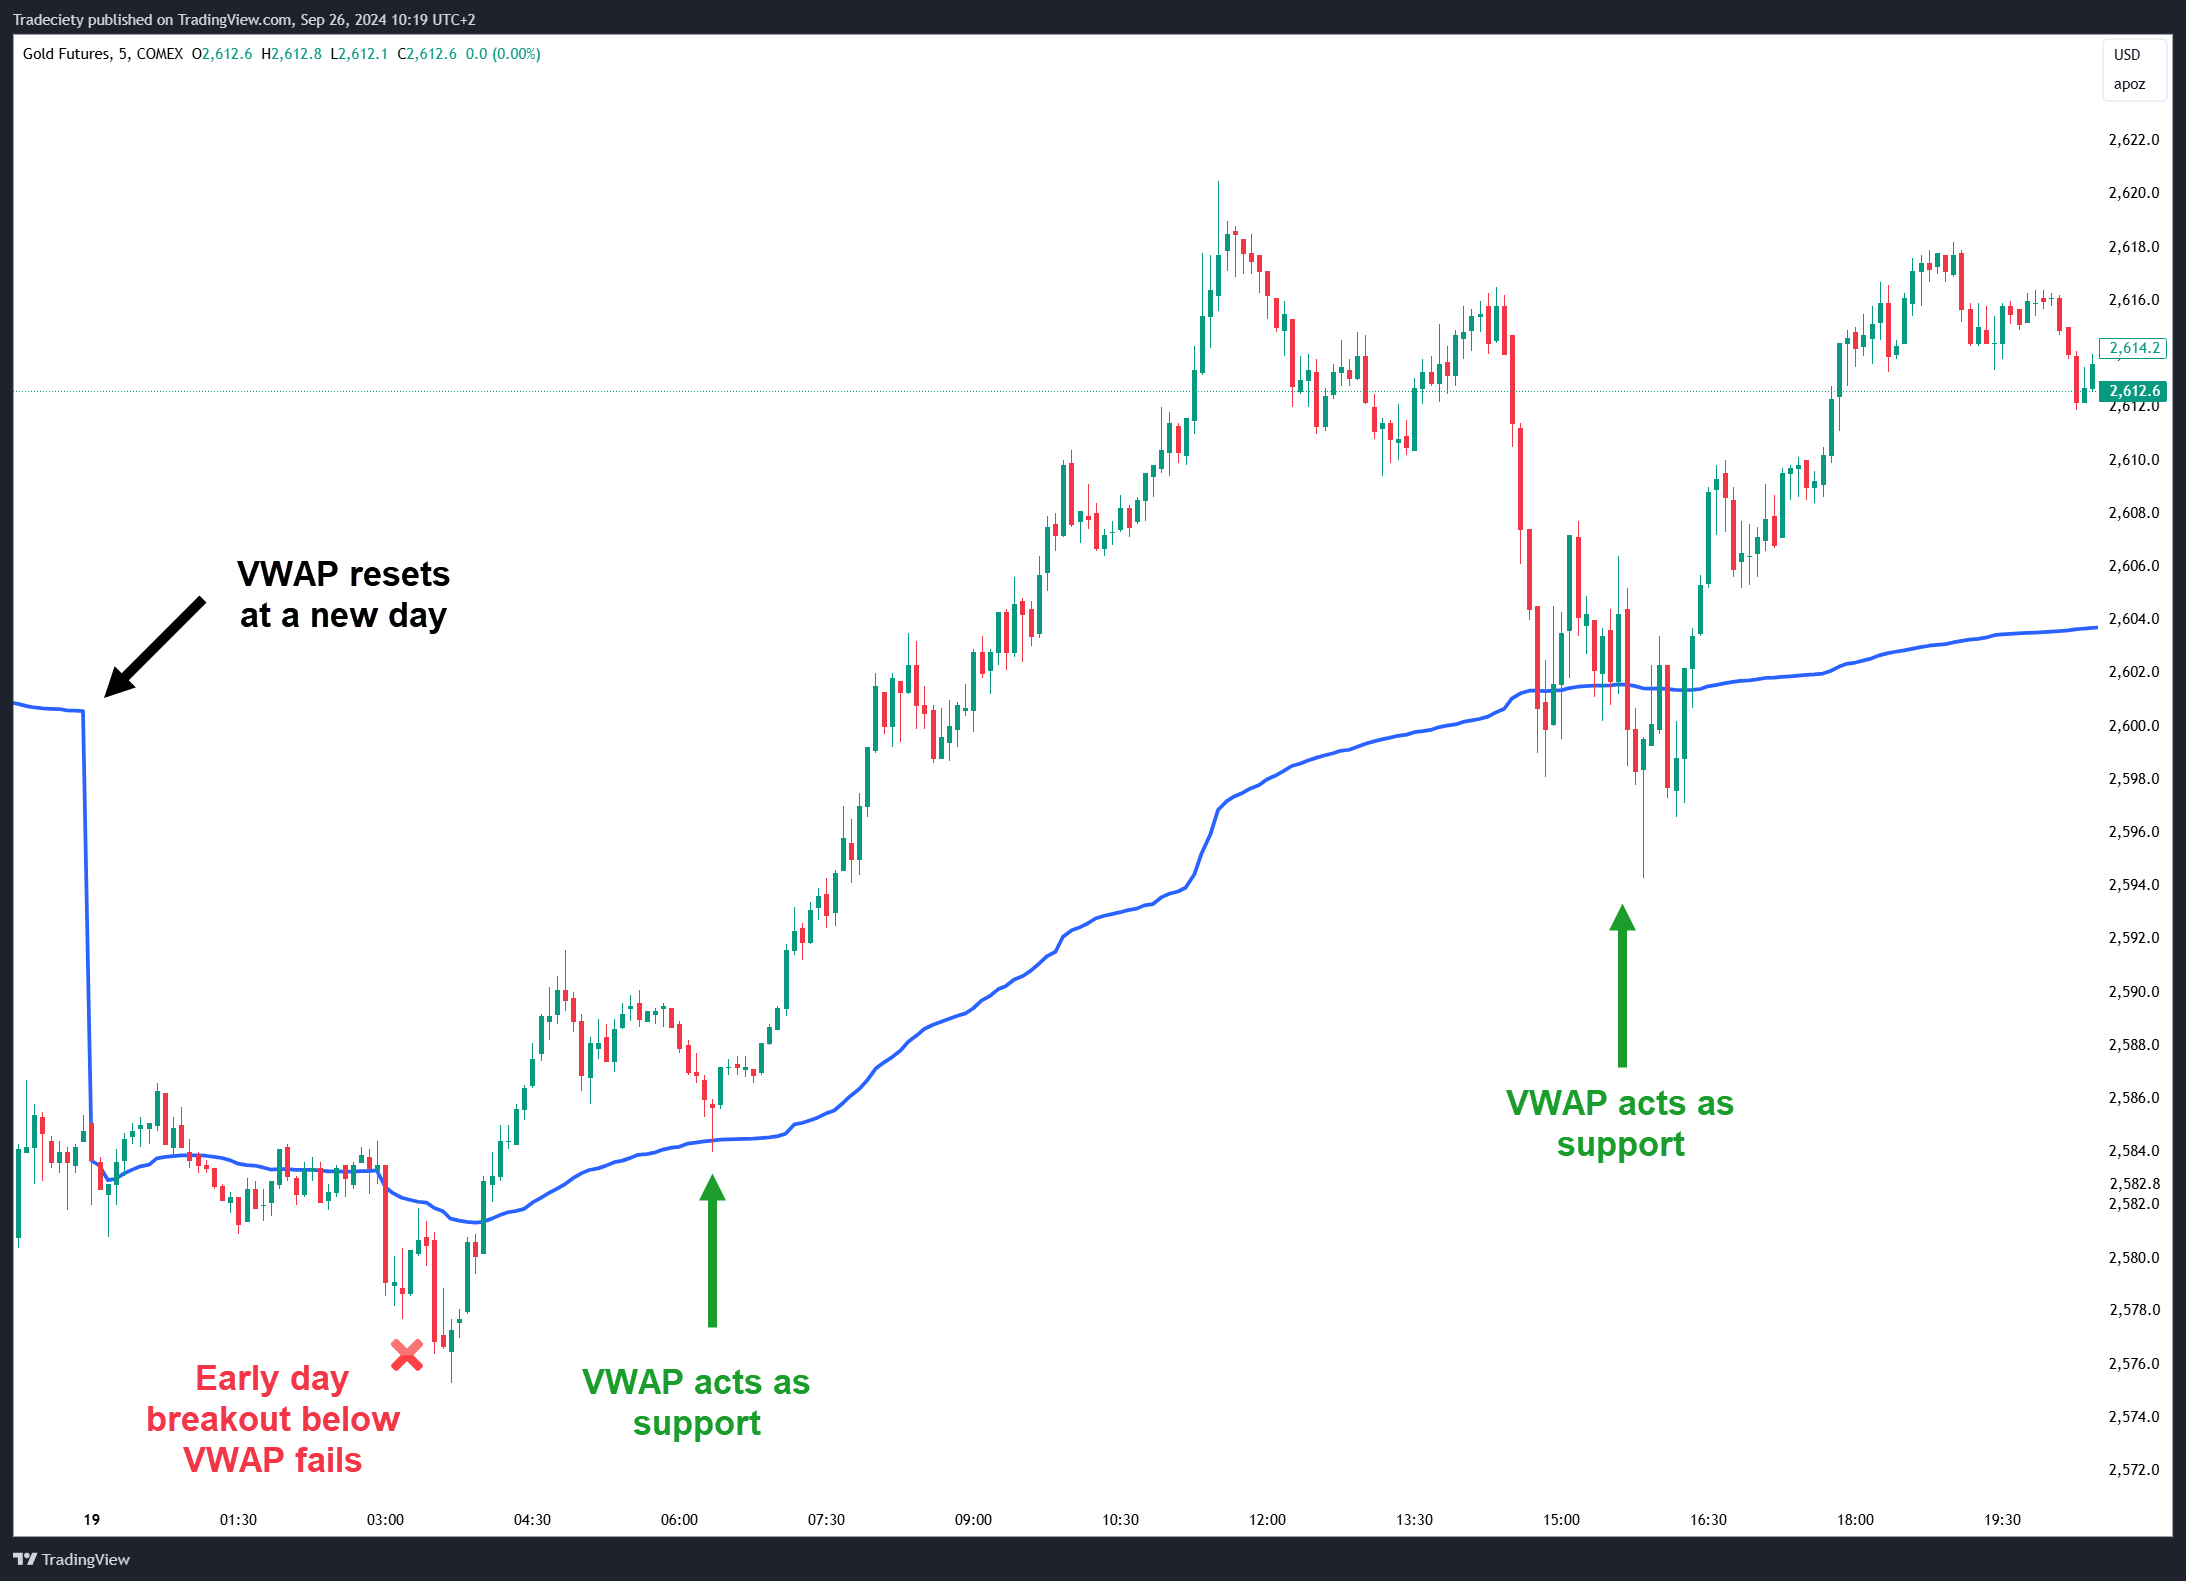
Volume indicators influence day trading signals by providing insights into the strength of price movements. High volume during a price increase suggests strong buying interest, signaling a potential uptrend. Conversely, high volume during a price drop indicates strong selling pressure, signaling a potential downtrend. Traders often look for divergences between price and volume; for instance, if prices rise but volume declines, it may signal a weakening trend. Volume spikes can also confirm breakouts or reversals, making them crucial for validating trade entries and exits in day trading strategies.
What are the best practices for interpreting candlestick patterns?
To interpret candlestick patterns effectively in day trading, follow these best practices:
1. Understand Basic Patterns: Familiarize yourself with key patterns like doji, engulfing, and hammer. Each signals potential market reversals or continuations.
2. Look for Context: Consider the overall trend. A bullish engulfing pattern in a downtrend may indicate a reversal, while the same pattern in an uptrend suggests continuation.
3. Use Volume as Confirmation: Higher trading volume alongside a candlestick pattern adds validity. For example, a bullish pattern with increased volume is more reliable.
4. Combine with Other Indicators: Use additional indicators like moving averages or RSI to strengthen your analysis. This helps confirm signals from candlestick patterns.
5. Identify Support and Resistance Levels: Patterns near these levels carry more weight. A hammer at support is a stronger buy signal than one in the middle of a range.
6. Watch for Gaps: Gaps can enhance the significance of patterns. A gap up followed by a bullish candlestick can indicate strong buying interest.
7. Practice Risk Management: No pattern is foolproof. Set stop-loss orders to manage risk and protect your capital when trading based on candlestick signals.
By applying these practices, you can enhance your ability to interpret candlestick patterns in day trading effectively.
How do traders use Fibonacci retracement levels?
Traders use Fibonacci retracement levels to identify potential reversal points in a stock's price movement during day trading. They plot horizontal lines at key Fibonacci levels—typically 23.6%, 38.2%, 50%, 61.8%, and 100%—after a significant price movement. When the price retraces to these levels, traders look for signs of a reversal, such as candlestick patterns or volume spikes, to enter or exit trades. This technique helps in setting stop-loss orders and profit targets, enhancing risk management.
What is the significance of trend lines in day trading?
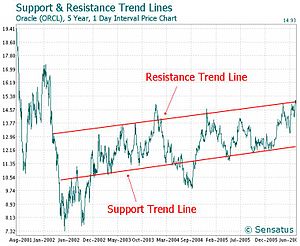
Trend lines are crucial in day trading as they help identify market direction, potential support and resistance levels, and entry or exit points. By connecting significant price points, traders can visualize trends, making it easier to spot reversals or continuations. A well-drawn trend line can signal when to buy or sell, enhancing decision-making and risk management. Understanding these signals can lead to more profitable trades and improved timing in the fast-paced trading environment.
How can chart patterns guide day trading decisions?
Chart patterns can guide day trading decisions by helping traders identify potential price movements. Key patterns like head and shoulders, triangles, and flags signal reversals or continuations. For example, a bullish flag suggests a price breakout, indicating a buying opportunity. Traders use these patterns to set entry and exit points, manage risk, and confirm signals from other indicators. Recognizing these patterns enhances decision-making, improving the chances of profitable trades.
Learn about How to Use Chart Patterns for Day Trading Analysis
What does the Average True Range (ATR) tell us about volatility?
The Average True Range (ATR) measures market volatility by calculating the average range between high and low prices over a set period. A higher ATR indicates greater volatility, suggesting larger price swings, while a lower ATR signals less volatility and tighter price movements. Traders use ATR to assess risk and adjust their strategies accordingly, helping them decide on entry and exit points in day trading.
How can sentiment analysis enhance trading signal interpretation?
Sentiment analysis enhances trading signal interpretation by analyzing social media, news, and market sentiment to gauge investor emotions. It identifies bullish or bearish trends, providing context to day trading indicators. For example, if a technical indicator signals a buy but sentiment is overwhelmingly negative, it may suggest caution. Conversely, strong positive sentiment can reinforce bullish signals. By integrating sentiment analysis, traders can make more informed decisions, improving the accuracy of their trades and reducing risk.
Learn about How to Build a Sentiment Analysis Dashboard for Day Trading
What are the common mistakes in reading day trading indicators?
Common mistakes in reading day trading indicators include:
1. Overreliance on Single Indicators: Traders often focus too much on one indicator, ignoring others that provide context.
2. Ignoring Market Context: Failing to consider broader market trends can lead to misinterpretation of signals.
3. Misreading Lagging Indicators: Some traders act on lagging indicators too late, missing optimal entry or exit points.
4. Neglecting Time Frames: Using different time frames without understanding their implications can lead to conflicting signals.
5. Emotional Decision-Making: Letting emotions influence reactions to indicator signals often results in poor trading choices.
6. Skipping Backtesting: Not backtesting indicators can lead to overconfidence in their reliability.
7. Forgetting Volume Analysis: Ignoring volume alongside indicators can skew the understanding of price movements.
8. Chasing Signals: Reacting impulsively to every signal without a plan can lead to losses.
Avoiding these pitfalls can improve your interpretation of day trading indicator signals.
Learn about Common mistakes that increase stop-loss risk in day trading
How do economic news releases impact day trading indicators?
Economic news releases significantly impact day trading indicators by causing volatility and altering market sentiment. Traders often react to data like unemployment rates, GDP growth, or inflation figures, which can lead to sharp price movements. For instance, positive economic news may boost indicators like moving averages or momentum signals, suggesting bullish trends. Conversely, negative news can trigger sell-offs, affecting indicators like RSI or MACD, signaling potential bearish conditions. Thus, staying updated on economic releases is crucial for interpreting day trading indicators effectively.
Learn about How News Events Impact Day Trading Decisions
What are the benefits of using multiple indicators?
Using multiple indicators in day trading enhances decision-making by providing a more comprehensive view of market conditions. It helps confirm signals, reducing the risk of false positives. Combining trend indicators, like moving averages, with momentum indicators, such as the RSI, can clarify entry and exit points. Additionally, multiple indicators can highlight different aspects of price action, leading to more informed strategies. Diversifying your analysis also allows for adaptation to varying market environments, improving overall trading performance.
How can backtesting improve the interpretation of trading signals?
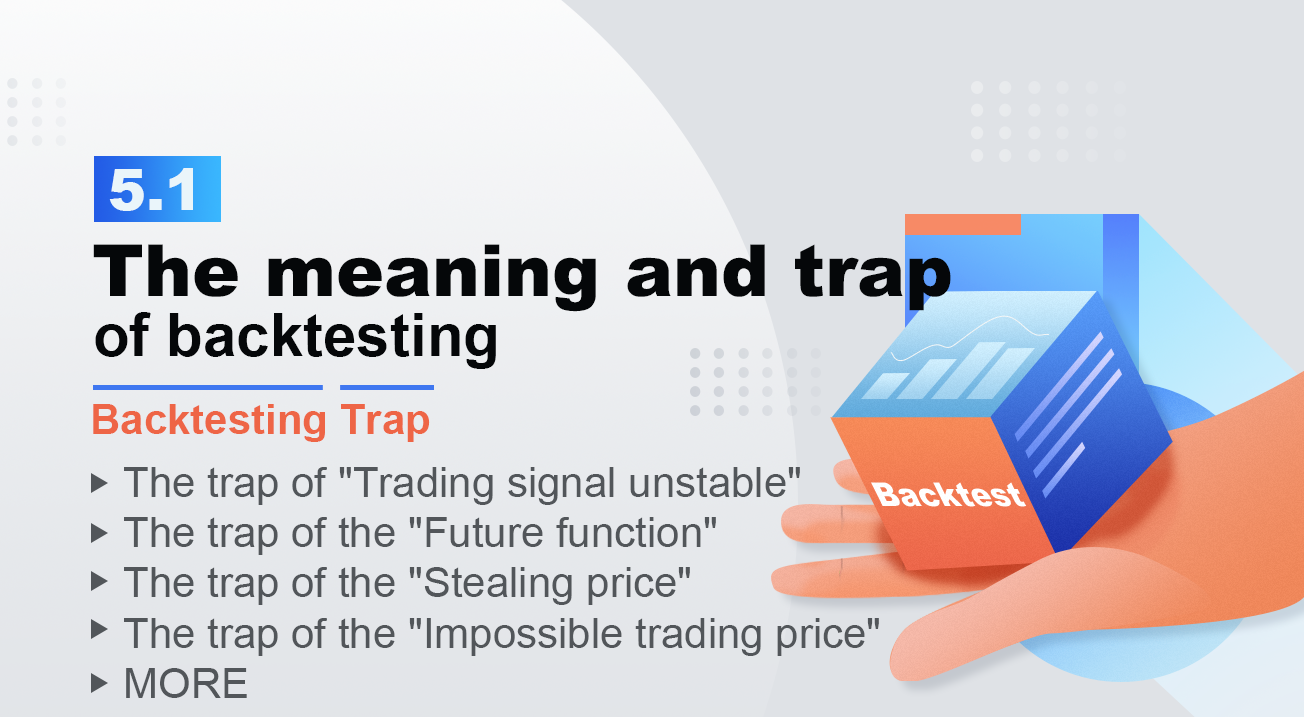
Backtesting enhances the interpretation of trading signals by providing empirical evidence of a strategy's effectiveness over historical data. It allows traders to see how well specific indicators would have performed in the past, helping to identify reliable patterns and refine entry and exit points. By analyzing past performance, traders can adjust their strategies to improve accuracy and reduce risk. Additionally, backtesting helps in understanding the market conditions under which signals are most effective, leading to more informed trading decisions.
Learn about How to Use Backtesting to Improve Your Day Trading Performance
Conclusion about Interpreting Day Trading Indicator Signals
Incorporating various day trading indicators can significantly enhance your trading strategy. By understanding tools like moving averages, RSI, MACD, and Bollinger Bands, you can identify potential market movements and make informed decisions. Additionally, analyzing volume, candlestick patterns, and Fibonacci levels will further refine your approach. Remember, avoiding common pitfalls and leveraging sentiment analysis, alongside backtesting, are essential for successful trading. For comprehensive insights and support on navigating these indicators, DayTradingBusiness is here to help you maximize your trading potential.
Learn about Interpreting Technical Signals for Day Trading Decisions
Sources:
- Enhancing daily stock trading with a novel fuzzy indicator ...
- Prediction and interpretation of daily NFT and DeFi prices dynamics ...
- Inconsistency across short-term and long-term oriented signals ...
- Measuring Liquidity in Financial Markets
- Mixing Financial Stress with GPT-4 News Sentiment Analysis for ...
- Decoding market reactions: Analysis of divergent signals of ESG ...