Did you know that the average person swallows eight spiders a year while sleeping? Thankfully, when it comes to trading, you can avoid the creepy crawlies by mastering volume analysis. This article dives into the crucial role of volume in trading, highlighting its significance for entry and exit signals. Discover how to spot entry points using volume, identify effective indicators for exits, and enhance your trading strategies. Learn to recognize bullish and bearish trends, interpret volume spikes, and avoid common pitfalls. We also explore the differences in volume analysis between stocks and cryptocurrencies, and how news events can influence trading volume. With insights from DayTradingBusiness, you'll gain the tools to utilize historical volume data and improve your overall trading decisions.
What is volume in trading and why is it important for signals?
Volume in trading refers to the number of shares or contracts traded within a specific period. It's important for signals because high volume can indicate strong interest and potential price movement, confirming the strength of a trend. Low volume might suggest weak support for a price change, signaling caution. Traders often use volume alongside price movements to identify entry and exit points, ensuring they act based on robust market activity.
How can I use volume to identify entry signals in my trades?
To use volume for entry signals in your trades, look for these key indicators:
1. Volume Spikes: A sudden increase in volume can indicate strong interest and potential price movement. Enter trades when volume spikes accompany a breakout.
2. Volume Trends: Analyze volume trends relative to price movement. Increasing volume on upward price movement suggests strength, while decreasing volume on upward trends can signal a reversal.
3. Confirmation with Price Action: Wait for price to break above resistance or below support with high volume. This confirms the strength of the move.
4. Volume Divergence: If price makes new highs or lows but volume decreases, it may signal a weakening trend. Consider this as a potential exit signal.
5. Moving Average of Volume: Use a moving average of volume to identify average trading activity. A move above this average can indicate a strong entry point.
Incorporate these strategies into your trading plan for more effective entry signals.
What are the best volume indicators for exit signals?
The best volume indicators for exit signals include:
1. Volume Oscillator: Measures the difference between two volume averages, signaling potential reversals when it diverges from price trends.
2. Accumulation/Distribution Line: Indicates whether a stock is being accumulated or distributed, helping to identify potential exit points based on buying or selling pressure.
3. On-Balance Volume (OBV): Tracks volume flow to confirm price trends. A drop in OBV can signal it's time to exit.
4. Chaikin Money Flow (CMF): Combines price and volume to show buying or selling pressure over a specific period, indicating exits when it turns negative.
5. Volume Profile: Shows traded volume at different price levels, helping identify key support and resistance levels for exit strategies.
Using these indicators can enhance exit timing by highlighting shifts in market sentiment.
How does volume analysis improve trading strategies?
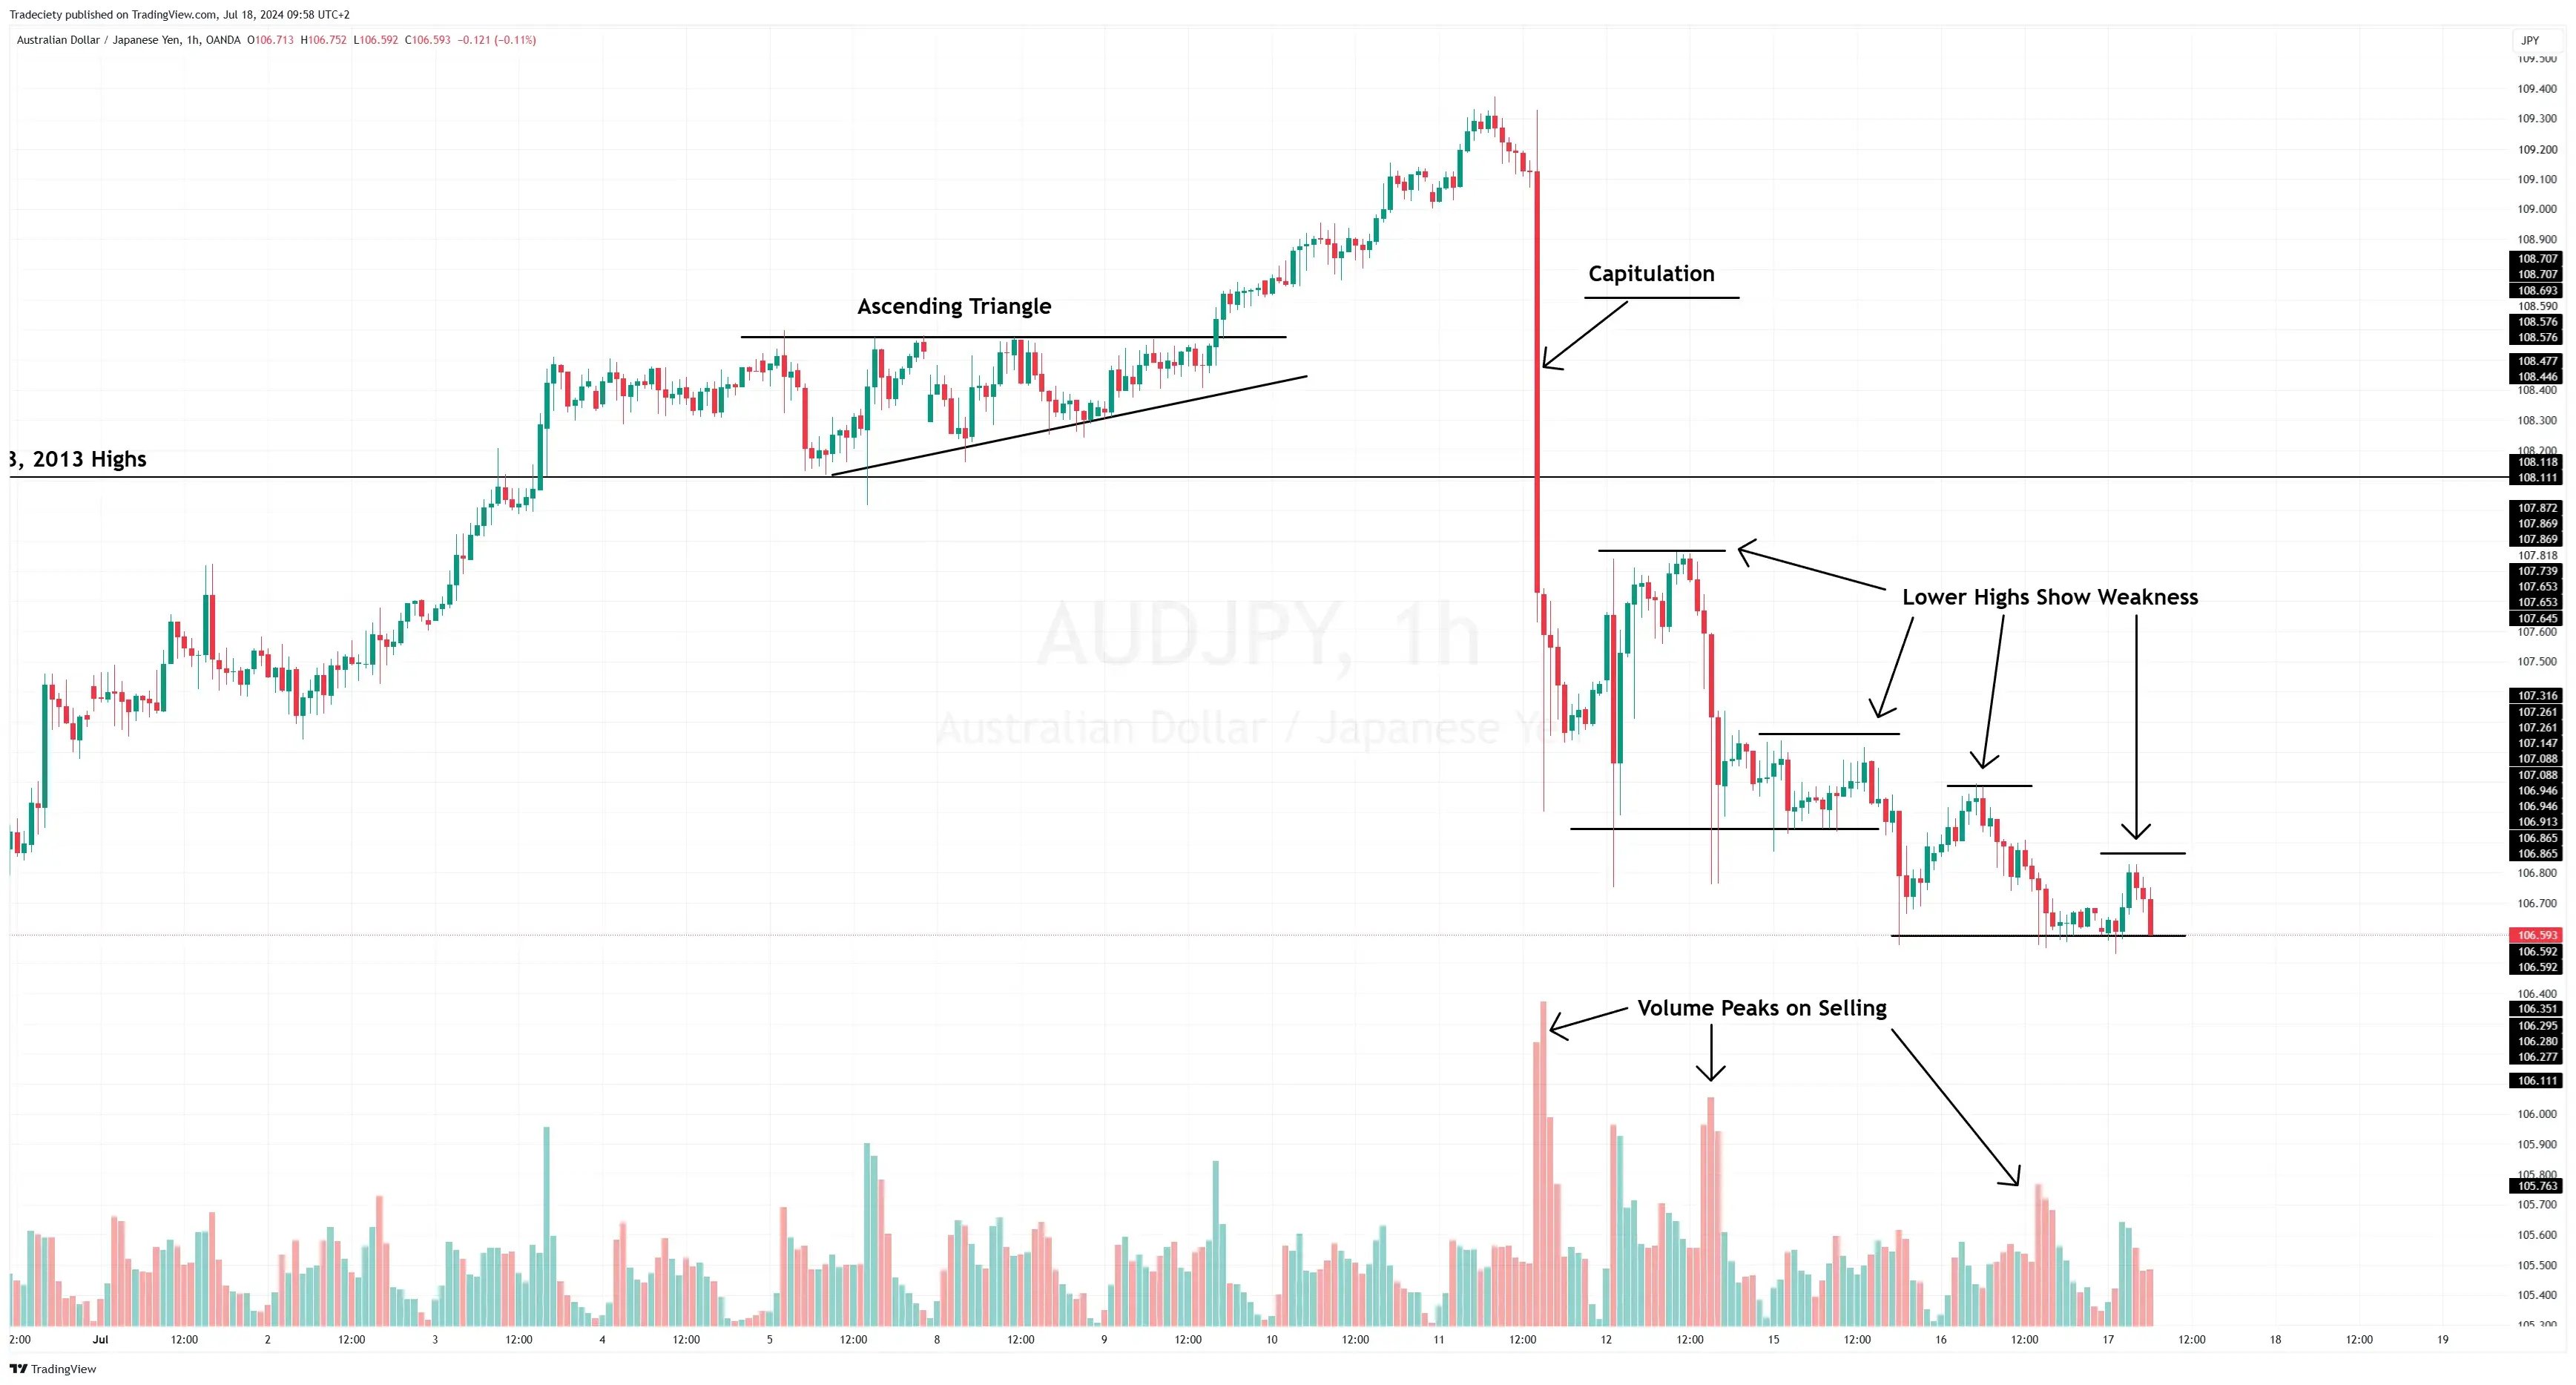
Volume analysis improves trading strategies by providing insights into market strength and potential price movements. High volume during a price increase signals strong buyer interest, suggesting a good entry point. Conversely, high volume during a price decrease indicates selling pressure, which may prompt a strategic exit. Additionally, volume can confirm trends; if prices rise with increasing volume, the trend is likely strong. By incorporating volume analysis, traders can make more informed decisions, enhancing their entry and exit signals for better profitability.
What role does volume play in confirming price movements?
Volume confirms price movements by indicating the strength of a trend. High volume during a price increase suggests strong buying interest, reinforcing the upward movement. Conversely, high volume during a price decline signals strong selling pressure, validating the downward trend. Low volume can indicate weak price movements, making it less reliable. Traders often use volume spikes as entry or exit signals; for instance, entering a trade on a breakout accompanied by high volume increases the likelihood of sustained movement.
How can I spot bullish and bearish volume trends?
To spot bullish and bearish volume trends, look for these key indicators:
1. Rising Volume with Price Increase: This signals bullish sentiment. If volume increases while prices rise, it suggests strong buying interest.
2. Rising Volume with Price Decrease: This indicates bearish sentiment. If volume spikes during a price drop, it shows heightened selling pressure.
3. Divergence: If price moves up but volume declines, it may signal weakening bullish momentum. Conversely, if prices drop while volume falls, bearish momentum might be fading.
4. Volume Spikes: Sudden increases in volume can indicate strong market interest, often leading to reversals or breakouts.
5. Moving Averages: Use volume moving averages to smooth out fluctuations. A consistent increase above the average can confirm a trend.
Monitor these patterns to refine your entry and exit signals effectively.
What is the significance of volume spikes for entry and exit points?
Volume spikes indicate increased trading activity and can serve as crucial signals for entry and exit points. A volume spike during a price increase suggests strong buying interest, signaling a good entry point. Conversely, a volume spike during a price drop can indicate selling pressure, suggesting an exit point. High volume often confirms price trends, while low volume may signal potential reversals. Monitoring these spikes helps traders make informed decisions and maximize profits.
How do I interpret low volume during a price breakout?
Low volume during a price breakout often signals weakness in the move. It suggests that there’s insufficient buying interest to sustain the breakout, making it potentially unreliable. Traders should be cautious; consider waiting for higher volume confirmation before entering a position. This can indicate stronger momentum and a higher likelihood of continuation. If the breakout occurs with low volume, it may be wise to look for additional signals or wait for a pullback.
Can volume help me avoid false signals in trading?
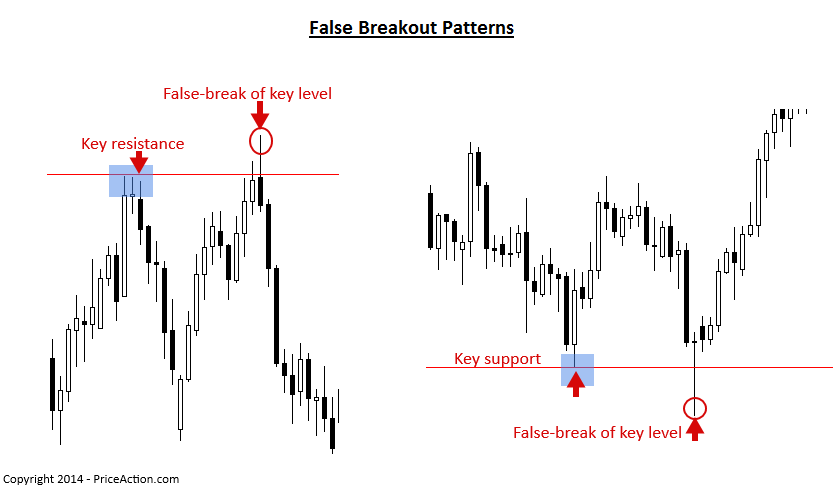
Yes, volume can help you avoid false signals in trading. High volume often confirms the strength of a price movement, indicating that it’s less likely to reverse. Conversely, low volume can suggest weak interest, making price movements more suspect. By analyzing volume alongside price trends, you can better identify genuine entry and exit points, reducing the chances of being misled by false breakouts or reversals.
What patterns should I look for when analyzing volume?
When analyzing volume, look for these key patterns:
1. Volume Spikes: Sudden increases in volume often signal strong buying or selling interest, indicating potential reversals or breakouts.
2. Volume Trends: Consistently rising or falling volume can confirm the strength of a price trend. Increasing volume with price movement suggests momentum.
3. Volume Divergence: If price moves in one direction while volume decreases, it may indicate a weakening trend, signaling a possible reversal.
4. Support and Resistance Levels: High volume at certain price levels can indicate strong support or resistance, guiding entry and exit points.
5. Accumulation and Distribution: Look for patterns where volume increases during price declines (accumulation) or price increases (distribution) to gauge market sentiment.
These patterns can help refine your entry and exit signals effectively.
How can I combine volume with other indicators for better signals?
Combine volume with indicators like Moving Averages, Relative Strength Index (RSI), or Bollinger Bands for better signals. For example, use volume spikes alongside a Moving Average crossover to confirm trends. If RSI shows overbought conditions with high volume, consider it a signal to exit. Additionally, when price breaks a support or resistance level on increased volume, it strengthens the validity of that breakout. Always look for confluence between volume and other indicators to enhance your entry and exit strategies.
What are the common mistakes traders make with volume analysis?
Common mistakes traders make with volume analysis include:
1. Ignoring Context: Not considering the market context or news that impacts volume spikes.
2. Overrelying on Volume Alone: Using volume without other indicators can lead to false signals.
3. Misinterpreting Volume Trends: Confusing increasing volume during a downtrend as bullish.
4. Neglecting Timeframes: Analyzing volume on the wrong timeframe can distort signals.
5. Failing to Confirm Breakouts: Entering trades based solely on volume without price confirmation.
6. Overtrading on Low Volume: Taking positions in low-volume conditions, which can lead to slippage.
7. Not Adjusting for Market Conditions: Using the same volume analysis techniques in different market environments.
Avoiding these pitfalls can enhance your trading decisions based on volume analysis.
How does volume differ between stocks and cryptocurrencies for signals?
Volume in stocks typically indicates the number of shares traded over a specific period, while in cryptocurrencies, it represents the number of coins exchanged. For stocks, high volume often signals strong interest or momentum, confirming price trends. In cryptocurrencies, volume can be more volatile and less predictable, reflecting rapid changes in market sentiment.
Using volume for entry signals in stocks might involve looking for breakouts with increased volume, while in crypto, traders often look for volume spikes to confirm price movements. For exit signals, declining volume in stocks could suggest weakening momentum, whereas in crypto, a sudden drop in volume might indicate an impending price reversal.
What resources can I use to track volume effectively?

To track volume effectively for entry and exit signals, use these resources:
1. Trading Platforms: Tools like Thinkorswim, MetaTrader, or TradingView offer real-time volume data and customizable charts.
2. Volume Indicators: Look for indicators like On-Balance Volume (OBV) or Volume Moving Average on your trading software to analyze trends.
3. Market Data Services: Platforms like Bloomberg or Reuters provide comprehensive volume analysis and insights.
4. Stock Screeners: Use screeners like Finviz or Yahoo Finance to filter stocks based on volume criteria.
5. Financial News Websites: Sites like MarketWatch or CNBC often highlight volume trends in their stock analyses.
These resources will help you monitor and interpret volume changes for better trading decisions.
How can I utilize historical volume data in my trading?
To utilize historical volume data in your trading, analyze past trading volumes alongside price movements. Look for spikes in volume as potential indicators of strong trends or reversals. Use volume to confirm breakouts; a price increase with high volume suggests strength, while low volume may signal weakness. For entry signals, consider buying when volume exceeds the average during upward price movement. For exits, monitor volume declines; if price rises but volume falls, it could indicate a reversal. Always combine volume analysis with other indicators for better decision-making.
What is the impact of news events on trading volume signals?
News events can significantly influence trading volume signals. When major news breaks, trading volume often spikes as traders react to the information. High volume during such times can indicate strong conviction in price movements, signaling potential entry or exit points. For instance, if a stock experiences a sudden increase in volume after positive earnings news, it may suggest bullish sentiment, making it a good entry point. Conversely, if volume surges on negative news, it may indicate a sell signal. Monitoring volume in relation to news can help traders identify genuine trends versus false signals.
Learn about How News Events Impact Day Trading Decisions
Conclusion about Utilizing Volume for Entry and Exit Signals
Incorporating volume analysis into your trading strategy is essential for making informed entry and exit decisions. By understanding how volume influences price movements, you can better identify potential trends and avoid false signals. Leveraging the right volume indicators, recognizing patterns, and staying aware of market conditions will significantly enhance your trading effectiveness. For further insights and resources, DayTradingBusiness is here to support your journey in mastering volume for successful trading.