Did you know that even the most seasoned traders sometimes forget the golden rule: never trust a chart that doesn’t wear pants? In the world of day trading, mastering technical indicators is essential for making informed decisions and maximizing profits. This article dives into the various technical indicators that can enhance your trading strategies, from moving averages and RSI to MACD and candlestick patterns. You’ll learn how to choose the right indicators, identify common trading patterns, and understand the importance of volume. Additionally, we’ll discuss the role of market conditions and how to effectively backtest your strategies. With insights from DayTradingBusiness, you’ll be equipped to avoid common pitfalls and improve your trading performance.
What Are Technical Indicators in Day Trading?
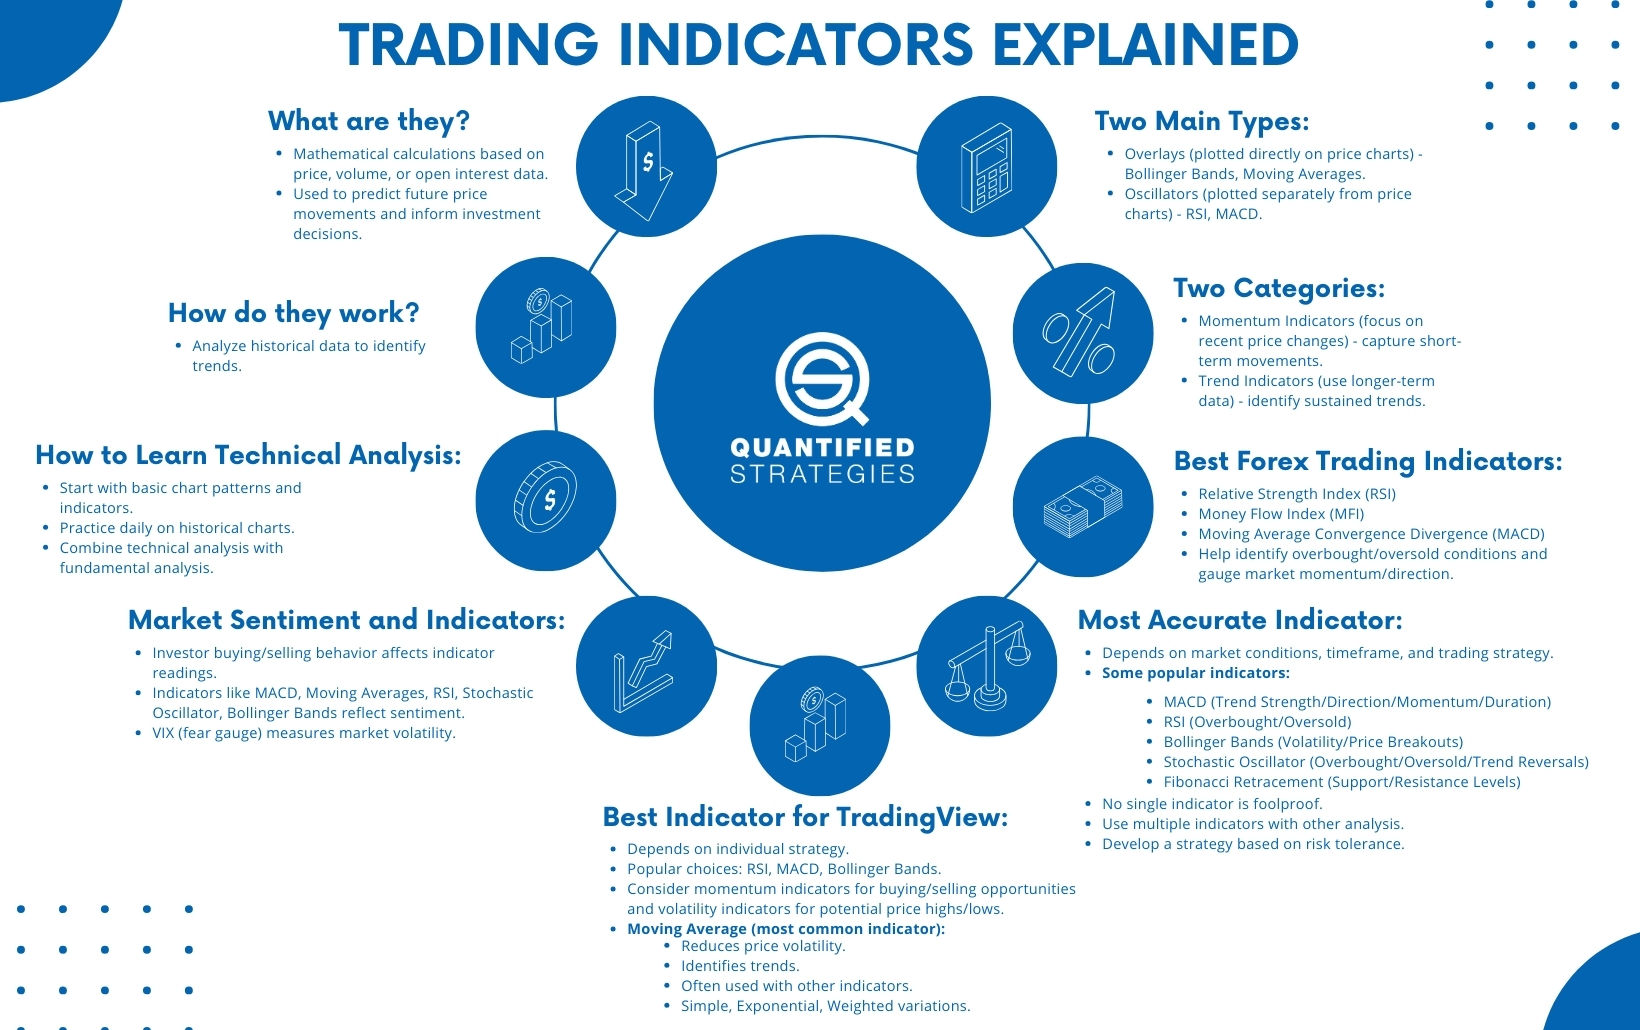
Technical indicators in day trading are mathematical calculations based on price, volume, or open interest of a security. Traders use them to identify trends, market momentum, and potential entry or exit points. Common indicators include Moving Averages, Relative Strength Index (RSI), and Bollinger Bands.
To use technical indicators effectively with day trading patterns, combine them with chart patterns like flags or head and shoulders. For instance, if a stock shows a bullish flag pattern alongside a rising Moving Average, it may suggest a strong upward trend. Always confirm signals from multiple indicators to increase reliability.
How Do I Choose the Right Technical Indicators for Day Trading?
To choose the right technical indicators for day trading, consider your trading style and strategy. Start with trend indicators like moving averages to identify market direction. Use oscillators such as the Relative Strength Index (RSI) or Stochastic to gauge overbought or oversold conditions. Volume indicators can help confirm trends and reversals.
Combine indicators for better signals; for instance, pair a moving average with RSI for trend confirmation. Test your chosen indicators on historical data to see how well they align with your trading patterns. Adjust your selection based on what works best for your specific approach and market conditions.
What Common Patterns Should I Look for in Day Trading?
Look for these common patterns in day trading:
1. Breakouts: Identify when a stock moves above resistance levels. This can signal a potential upward trend.
2. Pullbacks: Watch for a stock that retraces after a strong move; this can offer entry points for a continuation of the trend.
3. Reversals: Spot patterns like double tops or bottoms, indicating potential trend changes.
4. Volume Spikes: Increased volume often precedes significant price movements, confirming breakout or reversal patterns.
5. Moving Averages: Look for crossovers (e.g., when a short-term average crosses above a long-term average) for buy or sell signals.
6. Candlestick Patterns: Patterns like doji, hammer, or engulfing candles can indicate market sentiment shifts.
7. Divergence: Check if price moves in the opposite direction of indicators like RSI or MACD, signaling possible reversals.
Use these patterns alongside technical indicators to enhance your day trading strategy.
How Do Moving Averages Work in Day Trading Strategies?
Moving averages smooth out price data to identify trends in day trading. They calculate the average price over a specific period, helping traders spot entry and exit points.
Short-term moving averages, like the 5-day or 10-day, react quickly to price changes and are useful for identifying momentum. Long-term moving averages, such as the 50-day or 200-day, provide insight into the overall trend direction.
Traders often use crossovers—when a short-term moving average crosses above or below a long-term moving average—as signals to buy or sell. Additionally, moving averages can act as dynamic support and resistance levels.
Incorporating moving averages into day trading strategies enhances decision-making by providing clear visual cues about market trends.
What Is the Role of RSI in Day Trading?
The Relative Strength Index (RSI) helps day traders identify overbought or oversold conditions in a stock. When the RSI is above 70, it signals that the asset may be overbought, suggesting a potential sell opportunity. Conversely, an RSI below 30 indicates oversold conditions, hinting at a possible buying opportunity. Traders often use RSI to confirm entry and exit points, aligning it with other technical indicators and day trading patterns for better decision-making.
How Can I Use MACD for Day Trading Decisions?
To use MACD for day trading, follow these steps:
1. Understand MACD Components: Familiarize yourself with the MACD line, signal line, and histogram. The MACD line is the difference between two moving averages, the signal line is the average of the MACD line, and the histogram shows the difference between the MACD line and signal line.
2. Identify Crossovers: Watch for MACD line crossovers with the signal line. A bullish crossover (MACD crosses above the signal line) suggests a potential buy signal, while a bearish crossover indicates a sell signal.
3. Look for Divergence: Check for divergence between MACD and price. If the price is making new highs while MACD is not, it may signal a reversal, and vice versa.
4. Use Histogram: Pay attention to the histogram. Increasing bars suggest momentum in the direction of the MACD line, while decreasing bars may signal weakening momentum.
5. Combine with Other Indicators: Enhance decisions by using MACD with other indicators like RSI or moving averages for confirmation.
6. Set Entry and Exit Points: Use MACD signals to determine precise entry and exit points, aligning them with your risk management strategy.
7. Practice with Charts: Analyze historical charts to see how MACD behaved during different price movements, helping you refine your strategy.
By applying these techniques, you can effectively use MACD to inform your day trading decisions.
What Are Candlestick Patterns and How Do They Help Day Traders?
Candlestick patterns are visual representations of price movements on a chart, showing open, high, low, and close prices for a specific time frame. They help day traders identify market trends, reversals, and potential entry and exit points. By recognizing patterns like doji, engulfing, or hammer, traders can make informed decisions based on market sentiment. These patterns, combined with other technical indicators, enhance trading strategies, increasing the likelihood of profitable trades. Understanding candlestick patterns is crucial for effective day trading.
How Do Bollinger Bands Assist in Day Trading?

Bollinger Bands assist in day trading by providing visual cues for price volatility and potential market reversals. Traders use the bands to identify overbought or oversold conditions. When the price touches the upper band, it may indicate a selling opportunity; conversely, touching the lower band suggests a buying opportunity. The width of the bands shows market volatility—narrow bands indicate low volatility and potential breakouts, while wide bands suggest high volatility. By combining Bollinger Bands with other indicators, traders can enhance their strategies and make more informed decisions.
What Is the Importance of Volume in Day Trading?
Volume is crucial in day trading as it indicates the strength of a price movement. High volume confirms trends, making them more reliable, while low volume can signal potential reversals or weak trends. Traders use volume in conjunction with technical indicators to validate entry and exit points. For example, if a stock breaks out of resistance on high volume, it’s more likely to continue rising. Monitoring volume helps traders assess market sentiment and avoid false signals.
How Can I Combine Multiple Indicators for Better Day Trading?
To combine multiple indicators for better day trading, start by selecting a mix of trend indicators (like Moving Averages) and momentum indicators (such as RSI). Use Moving Averages to identify the trend direction, and apply RSI to determine overbought or oversold conditions.
Next, incorporate volume indicators like the Volume Moving Average to confirm price movements. When multiple indicators align, it signals a stronger trading opportunity. For instance, if the price is above the Moving Average and RSI shows momentum, it indicates a potential buy.
Always backtest your strategy with historical data to refine your approach and ensure it fits your trading style.
Learn about How to hedge multiple positions in day trading?
What Are the Best Day Trading Strategies Using Technical Indicators?
The best day trading strategies using technical indicators involve:
1. Moving Averages: Use the 50-day and 200-day moving averages to identify trends. A crossover signals potential buy or sell opportunities.
2. Relative Strength Index (RSI): Look for overbought or oversold conditions. An RSI above 70 suggests selling, while below 30 indicates buying.
3. Bollinger Bands: Trade based on price touching or breaking the bands. A price break above the upper band could signal a sell, while a break below the lower band may signal a buy.
4. MACD (Moving Average Convergence Divergence): Look for MACD line crossovers. A bullish crossover indicates a buy, while a bearish crossover suggests a sell.
5. Volume Indicators: High volume during price increases can confirm a trend. Use volume spikes to validate breakout strategies.
6. Fibonacci Retracement: Identify retracement levels to set entry and exit points. Trading at these levels can enhance profit potential.
Combine these indicators for confirmation and adjust strategies based on market conditions. Always manage risk effectively.
Learn about Best Strategies for Success with Day Trading Prop Firms
How Do I Interpret Divergence in Technical Indicators?
To interpret divergence in technical indicators while day trading, look for discrepancies between price movement and an indicator, like the RSI or MACD. For instance, if prices are making new highs but the indicator is not, that’s bearish divergence, signaling a potential price reversal. Conversely, if prices hit new lows while the indicator rises, that’s bullish divergence, suggesting a possible upward reversal. Always confirm with additional indicators or patterns for more reliable signals.
What Mistakes Should I Avoid When Using Indicators in Day Trading?
Avoid these mistakes when using indicators in day trading:
1. Overcomplicating with Too Many Indicators: Relying on multiple indicators can lead to confusion. Stick to a few that complement each other.
2. Ignoring Market Context: Indicators are more effective when you consider the broader market conditions. Don't trade based solely on indicator signals.
3. Neglecting Time Frames: Using indicators on the wrong time frame can mislead you. Ensure your indicators align with your trading strategy's time frame.
4. Focusing Solely on Lagging Indicators: Lagging indicators react after price moves. Use leading indicators to anticipate trends but balance them with lagging ones for confirmation.
5. Not Backtesting Your Strategy: Failing to backtest can result in unprofitable trades. Always test your indicator strategy on historical data.
6. Ignoring Risk Management: No indicator guarantees success. Set stop-loss orders and manage risk regardless of indicator signals.
7. Letting Emotions Influence Decisions: Rely on indicators, not emotions. Stick to your strategy, even in volatile markets.
By avoiding these mistakes, you can effectively use technical indicators in day trading patterns.
How Can I Backtest Technical Indicators for Day Trading?

To backtest technical indicators for day trading, follow these steps:
1. Select Indicators: Choose the technical indicators you want to test, like moving averages or RSI.
2. Gather Data: Obtain historical price data for the assets you're interested in. Use platforms like TradingView or MetaTrader.
3. Set Parameters: Define the parameters for your indicators. For example, set the periods for moving averages.
4. Develop a Strategy: Create a clear trading strategy that includes entry and exit signals based on your indicators.
5. Use Backtesting Software: Utilize backtesting tools or software (like Amibroker or NinjaTrader) to simulate trades based on historical data.
6. Analyze Results: Review the performance metrics, like win rate and profit factor, to assess the effectiveness of your strategy.
7. Refine and Repeat: Adjust your strategy or indicators based on results and backtest again.
This process allows you to evaluate how well your chosen technical indicators work with day trading patterns.
Learn about How to Backtest Day Trading Indicators
What Resources Are Available for Learning Technical Indicators?
You can learn about technical indicators through various resources. Start with online courses on platforms like Udemy or Coursera that focus on day trading and technical analysis. Websites like Investopedia offer articles and tutorials on specific indicators. Books such as "Technical Analysis of the Financial Markets" by John Murphy provide in-depth knowledge. YouTube channels dedicated to trading often cover technical indicators in real-time scenarios. Joining trading forums and communities can also provide insights and practical tips from experienced traders. Finally, practice using indicators on demo trading platforms to reinforce your learning.
How Do Market Conditions Affect the Use of Technical Indicators in Day Trading?
Market conditions significantly influence how technical indicators are used in day trading. In a trending market, indicators like moving averages can help identify entry and exit points effectively. Conversely, in a ranging market, oscillators such as RSI or Stochastic can signal overbought or oversold conditions.
Volatility impacts the reliability of indicators; high volatility may lead to false signals, while low volatility can result in missed opportunities. Traders must adjust their strategies based on market sentiment, incorporating indicators that align with current conditions to enhance decision-making. For instance, in a bullish market, traders might focus on momentum indicators, while in bearish conditions, they may prioritize reversal patterns.
Learn about How Do Market Makers and Liquidity Providers Affect Day Trading?
Conclusion about How to Use Technical Indicators with Day Trading Patterns
Incorporating technical indicators effectively is crucial for successful day trading. By understanding their roles—from moving averages to RSI, MACD, and candlestick patterns—you can enhance your trading strategies and decision-making processes. Remember to combine multiple indicators for a comprehensive analysis and avoid common pitfalls. For those looking to deepen their knowledge, resources are available, and adapting your approach to market conditions is essential. Leverage insights from DayTradingBusiness to refine your skills and maximize your trading potential.
Learn about How to Use Stochastic Indicators in Day Trading