Did you know that the stock market has more ups and downs than a roller coaster ride? Understanding day trading continuation patterns can help you navigate these twists and turns with confidence. In this article, we delve into the essence of continuation patterns and how they signal market trends. You'll discover the most common types, including flags, wedges, and triangles, and learn to identify these patterns effectively. We’ll also explore the significance of volume, the key differences between continuation and reversal patterns, and strategies for trading them successfully. Additionally, we’ll discuss risk management and how candlestick analysis can enhance your trading decisions. With insights from DayTradingBusiness, you'll be equipped to spot opportunities and succeed in the dynamic world of day trading.
What are day trading continuation patterns?
Day trading continuation patterns are formations that indicate a prevailing trend is likely to continue. Common types include flags, pennants, and triangles. These patterns typically appear after a price movement and suggest that traders can expect further movement in the same direction. For example, a bull flag forms after a strong upward move, followed by a consolidation period before continuing upward. Recognizing these patterns helps day traders make informed decisions about when to enter or exit trades.
How do continuation patterns indicate market trends?
Continuation patterns, like flags, pennants, and triangles, signal that a trend is likely to continue after a brief pause. They form during a trend and suggest that market participants are consolidating before pushing the price in the same direction. For example, a bullish flag follows a price rise, indicating that buyers are still in control. Traders look for breakout points to enter trades, confirming that the existing trend is resuming. Recognizing these patterns helps in predicting market movements and making informed day trading decisions.
What are the most common types of continuation patterns?
The most common types of continuation patterns in day trading are:
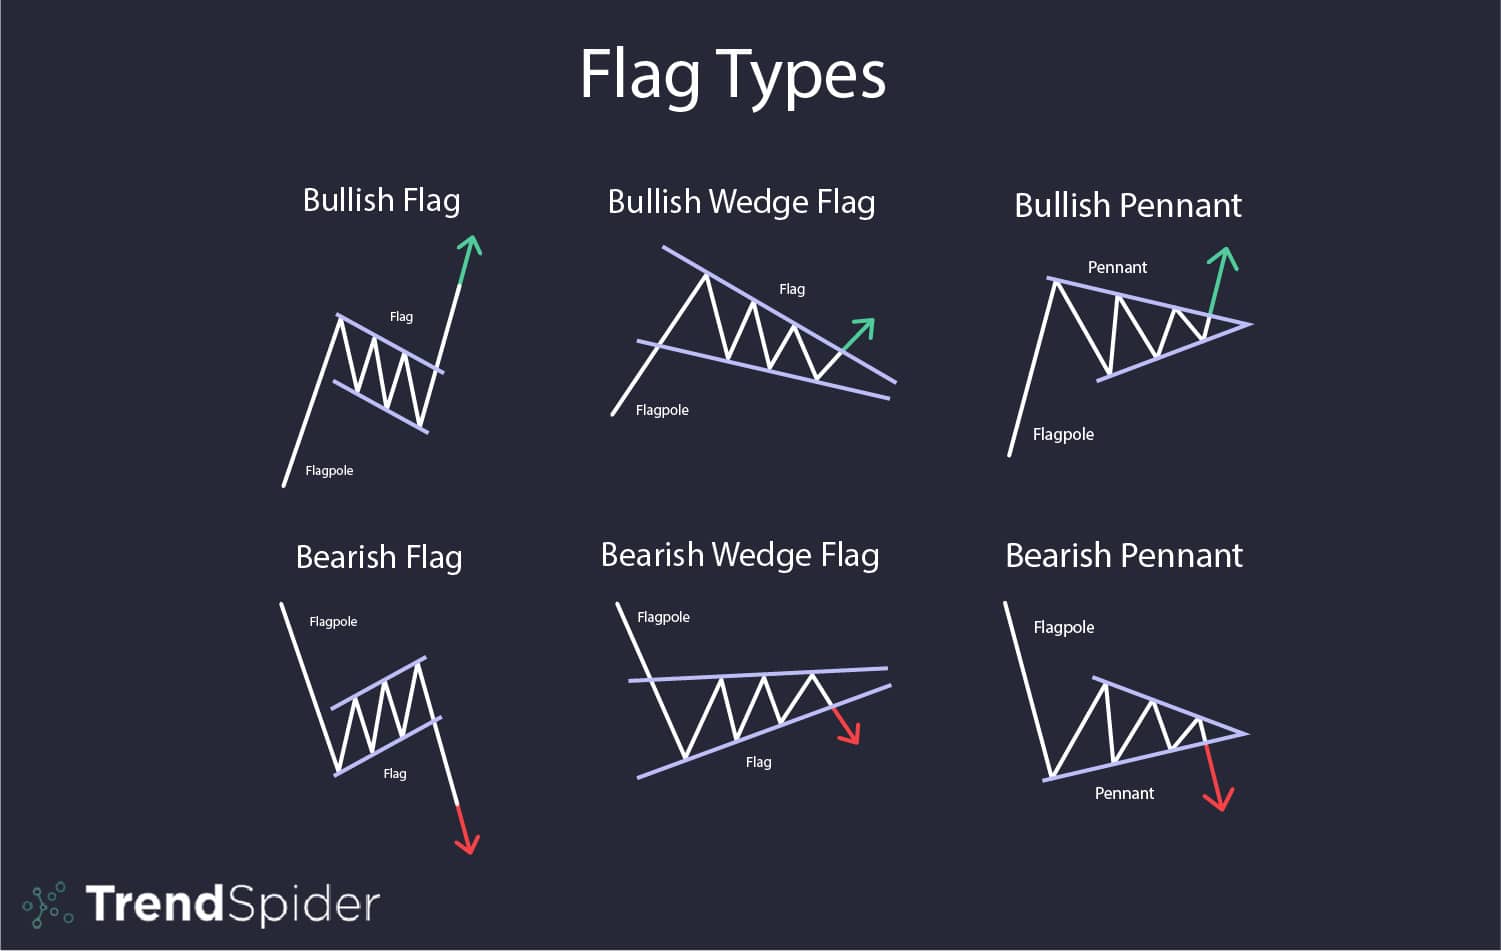
1. Flags: Small rectangular shapes that slope against the trend, indicating a brief consolidation before the price continues in the same direction.
2. Pennants: Similar to flags but with converging trendlines, forming a small symmetrical triangle. They signal a continuation after a strong price movement.
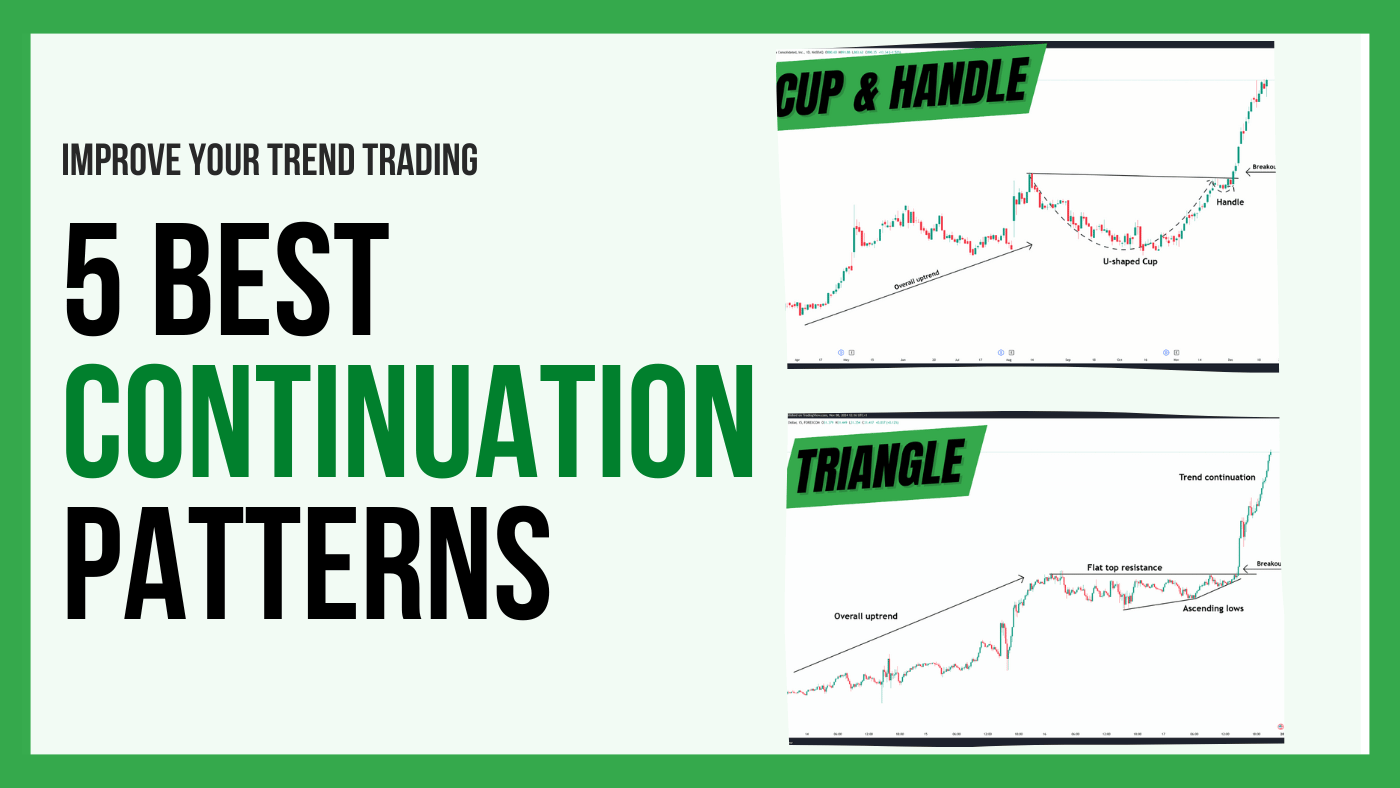
3. Triangles: Can be ascending, descending, or symmetrical. They indicate a period of consolidation where the price breaks out in the direction of the prior trend.
4. Wedges: Formed by converging trendlines that slope against the prevailing trend, suggesting a potential continuation upon breakout.
5. Rectangles: Horizontal price ranges that show consolidation. A breakout above or below indicates the continuation of the trend.
Recognizing these patterns can help traders anticipate price movements effectively.
How can I identify a flag pattern in day trading?
To identify a flag pattern in day trading, look for a sharp price movement followed by a consolidation period that resembles a rectangle or a parallelogram. The flag should tilt against the prevailing trend, with the breakout occurring in the direction of the trend. Confirm the pattern with increased volume during the breakout. Use a shorter time frame, like 5-minute or 15-minute charts, to spot flags quickly. Always set a stop-loss to manage risk.
What does a wedge pattern look like in day trading?
A wedge pattern in day trading appears as two converging trend lines, with price action tightening as it approaches the apex. There are two types: rising wedges, where the price makes higher highs and higher lows, indicating potential bearish reversal, and falling wedges, characterized by lower highs and lower lows, signaling possible bullish reversal. Traders often look for a breakout from these patterns to confirm their trading decisions.
How do triangles serve as continuation patterns?
Triangles serve as continuation patterns in day trading by indicating a pause in price movement before the prevailing trend resumes. They form when price consolidates between converging trendlines, signaling a potential breakout. An ascending triangle suggests bullish continuation, while a descending triangle indicates bearish continuation. Traders watch for breakouts above or below these patterns to enter positions aligned with the existing trend, often accompanied by increased volume to confirm the move.
What is the significance of the rectangle pattern in trading?
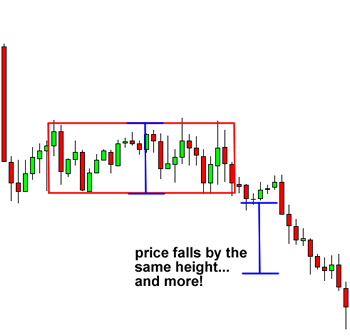
The rectangle pattern in trading signifies a period of consolidation where the price moves within a defined range. It indicates indecision among buyers and sellers. Traders often view this as a potential continuation pattern; a breakout above resistance suggests bullish momentum, while a drop below support indicates bearish sentiment. Recognizing this pattern can help traders make informed decisions about when to enter or exit trades.
How can volume confirm continuation patterns in day trading?
Volume can confirm continuation patterns in day trading by indicating the strength of the trend. When a continuation pattern, like a flag or triangle, forms, rising volume during the breakout suggests strong buyer or seller interest, validating the pattern. Conversely, low volume can signal weakness, indicating the trend may not continue. Traders often look for volume spikes at the breakout point to confirm their entry signals and increase the likelihood of a successful trade.
What are the key differences between continuation and reversal patterns?
Continuation patterns signal that a trend will continue after a brief pause, while reversal patterns indicate a potential change in trend direction. Key differences include:
1. Trend Direction: Continuation patterns appear in an existing trend (e.g., flags, pennants), while reversal patterns (e.g., head and shoulders, double tops) suggest an upcoming trend shift.
2. Formation Duration: Continuation patterns typically form over a shorter timeframe, while reversal patterns may take longer to develop.
3. Volume Behavior: In continuation patterns, volume often decreases during the formation and increases upon breakout. In reversal patterns, volume may spike as the trend exhausts.
4. Market Sentiment: Continuation patterns reflect ongoing market strength, whereas reversal patterns indicate a shift in sentiment, signaling potential weakness in the current trend.
Understanding these differences helps traders make informed decisions based on price action and market behavior.
How do I trade using continuation patterns effectively?
To trade using continuation patterns effectively, first identify common patterns like flags, pennants, and triangles on your chart. Wait for a breakout in the direction of the prevailing trend, confirming it with volume. Set entry points just above resistance for bullish patterns or below support for bearish ones. Use stop-loss orders to manage risk, placing them just outside the pattern. Target profits by measuring the pattern's height and projecting that distance from the breakout point. Finally, monitor the trade closely and adjust your strategy based on market conditions.
What are the risks associated with trading continuation patterns?
Trading continuation patterns carries several risks. First, false breakouts can occur, leading to losses if the price reverses unexpectedly. Second, market volatility can amplify losses, especially if stop-loss orders are not properly set. Third, psychological factors may affect decision-making, causing traders to hold onto losing positions too long. Lastly, insufficient volume can result in low liquidity, making it difficult to execute trades at desired prices. Always assess these risks before trading continuation patterns.
How does candlestick analysis enhance continuation pattern trading?
Candlestick analysis enhances continuation pattern trading by providing visual insight into market sentiment and potential price movements. Each candlestick reflects buying and selling pressure, helping traders identify trends. For instance, a series of bullish candlesticks in an uptrend signals strength, suggesting the trend will continue. Conversely, bearish candlesticks in a downtrend indicate weakness. Recognizing these patterns allows traders to make informed decisions about entry and exit points, increasing the likelihood of successful trades. Patterns like flags or pennants, confirmed by candlestick formations, offer clearer signals for continuation, improving overall trading strategy effectiveness.
What tools can help me spot continuation patterns?
To spot continuation patterns in day trading, use tools like:
1. Charting Software: Platforms like TradingView or MetaTrader allow you to analyze price movements and identify patterns visually.
2. Technical Indicators: Tools like moving averages or the MACD can help confirm trends and continuation signals.
3. Volume Analysis: Look for volume spikes using tools like Thinkorswim to validate the strength of a continuation pattern.
4. Pattern Recognition Software: Tools like StockCharts can automatically identify common continuation patterns like flags or pennants.
5. News Aggregators: Keeping track of financial news with tools like Benzinga can provide context that influences continuation patterns.
Using these tools effectively can enhance your ability to spot and trade continuation patterns.
How do market conditions affect the reliability of continuation patterns?
Market conditions significantly impact the reliability of continuation patterns in day trading. In trending markets, these patterns often signal strong momentum and are more likely to succeed. Conversely, in choppy or volatile markets, continuation patterns can fail due to erratic price movements. Factors like volume also play a role; higher volume during a pattern formation increases its reliability. Always assess the broader market context and sentiment to better gauge the effectiveness of these patterns.
Learn about How Market Conditions Affect HFT Strategies
What strategies can I use alongside continuation patterns?
Use these strategies alongside continuation patterns in day trading:
1. Volume Analysis: Confirm the strength of the continuation pattern by checking for increased volume during the breakout.
2. Trend Indicators: Apply moving averages to identify the trend direction and ensure it aligns with the continuation pattern.
3. Momentum Indicators: Use tools like RSI or MACD to gauge momentum and validate the continuation signal.
4. Support and Resistance: Identify key levels that could influence price movement and use them to set entry and exit points.
5. Risk Management: Set stop-loss orders to protect against false breakouts and determine position sizing based on your risk tolerance.
6. Time Frames: Analyze multiple time frames to ensure consistency in the continuation pattern across different charts.
7. Market News: Stay informed about economic news that could impact market sentiment and affect the continuation pattern.
Implementing these strategies can enhance your trading decisions with continuation patterns.
How can I manage my risk when trading continuation patterns?
To manage risk when trading continuation patterns, set a clear stop-loss order just below the pattern's support level. Define your position size based on your risk tolerance, typically risking no more than 1-2% of your trading capital. Use a risk-reward ratio of at least 1:2 to ensure potential gains outweigh risks. Monitor market conditions closely and be prepared to exit if the pattern fails. Lastly, keep an eye on volume; strong volume during the breakout can validate the pattern and reduce risk.
Learn about How to manage leverage risk when day trading?
Conclusion about Day Trading Continuation Patterns Explained
In summary, understanding day trading continuation patterns is crucial for capitalizing on existing market trends. By recognizing common patterns such as flags, wedges, and triangles, traders can make informed decisions and enhance their trading strategies. Utilizing candlestick analysis and volume confirmation further strengthens the reliability of these patterns. Always be aware of market conditions and manage risks effectively to navigate the challenges associated with trading. For more in-depth insights and strategies, explore the resources available through DayTradingBusiness.