Did you know that many traders would rather watch paint dry than analyze volume charts? Yet, understanding these charts can be a game changer in day trading! In this article, we dive into the essentials of reading volume charts, exploring what they are and why they matter. You'll learn how to interpret volume spikes, identify trends, and recognize the significance of high volume in stocks. We’ll also discuss common volume indicators, the relationship between volume and price action, and how to spot false breakouts. Discover the role of volume in support and resistance levels, its importance during earnings reports, and the best chart patterns to watch for. Plus, we’ll highlight tools for volume analysis and tips for avoiding common mistakes. Join us at DayTradingBusiness as we equip you with the skills to master volume charts and enhance your trading strategies!
What are volume charts in day trading?
Volume charts in day trading display the number of shares or contracts traded over a specific timeframe. They help traders gauge market activity and strength of price movements. High volume often indicates strong interest in a stock, while low volume may suggest a lack of conviction.
To read volume charts effectively, look for spikes in volume that coincide with price changes; these can signal potential reversals or continuations. Compare current volume to historical averages to assess significance. Use volume alongside price action to confirm trends or identify potential breakouts.
How do I interpret volume spikes on charts?
To interpret volume spikes on charts for day trading, look for sudden increases in trading volume compared to the average. A volume spike often indicates heightened interest or activity, signaling potential price movement.
If the price rises alongside the volume spike, it suggests strong buying interest, indicating a bullish trend. Conversely, if the price drops with increased volume, it signals selling pressure, hinting at a bearish trend.
Always consider the context—news events or earnings reports can cause spikes. Also, check if the volume is above key moving averages for confirmation. Use these insights to make informed trading decisions.
Why is volume important in day trading?
Volume is crucial in day trading because it indicates the strength of a price movement. High volume often signals strong interest and can confirm trends, while low volume may suggest weakness or potential reversals. By reading volume charts, traders can identify entry and exit points more effectively, assess the reliability of breakouts, and avoid false signals. Understanding volume helps traders make informed decisions, enhancing their chances of success.
What does high volume indicate in a stock?
High volume in a stock indicates strong investor interest and activity. It often signals that a significant price move is occurring or about to happen. For day trading, high volume can confirm the strength of a trend, making it a crucial factor for deciding when to enter or exit a trade.
How can I use volume to identify trends?
To use volume for identifying trends in day trading, start by observing the volume bars alongside price movements. High volume during price increases suggests strong buying interest, signaling an uptrend. Conversely, high volume during price declines indicates strong selling pressure, marking a downtrend.
Look for volume spikes; if they occur during a breakout, it confirms the trend's strength. A rising price with decreasing volume may indicate a weakening trend, suggesting caution. Additionally, compare current volume to average volume levels; significant deviations can signal potential reversals or continuations. Always consider volume in conjunction with price action for clearer trend analysis.
What are the common volume indicators for traders?
Common volume indicators for traders include:
1. Volume Bars: Show the number of shares traded during a specific time frame. Taller bars indicate higher volume.
2. Moving Average of Volume: Averages volume over a set period to identify trends.
3. On-Balance Volume (OBV): Combines price movement and volume, helping gauge buying and selling pressure.
4. Accumulation/Distribution Line: Measures price and volume to indicate whether a stock is being accumulated or distributed.
5. Chaikin Money Flow (CMF): Combines price and volume over a specific period to show buying and selling pressure.
These indicators help traders assess market strength and make informed decisions.
How does volume relate to price action?
Volume reflects the number of shares traded and can indicate the strength of a price movement. High volume often confirms a price trend, suggesting strong buyer or seller interest. Conversely, low volume may signal a lack of conviction, making price moves less reliable. In day trading, watching volume alongside price action helps identify potential reversals or breakouts. For instance, if a stock rises on high volume, it likely indicates strong buying pressure, whereas a price increase on low volume might hint at a potential pullback.
How can I spot false breakouts using volume?
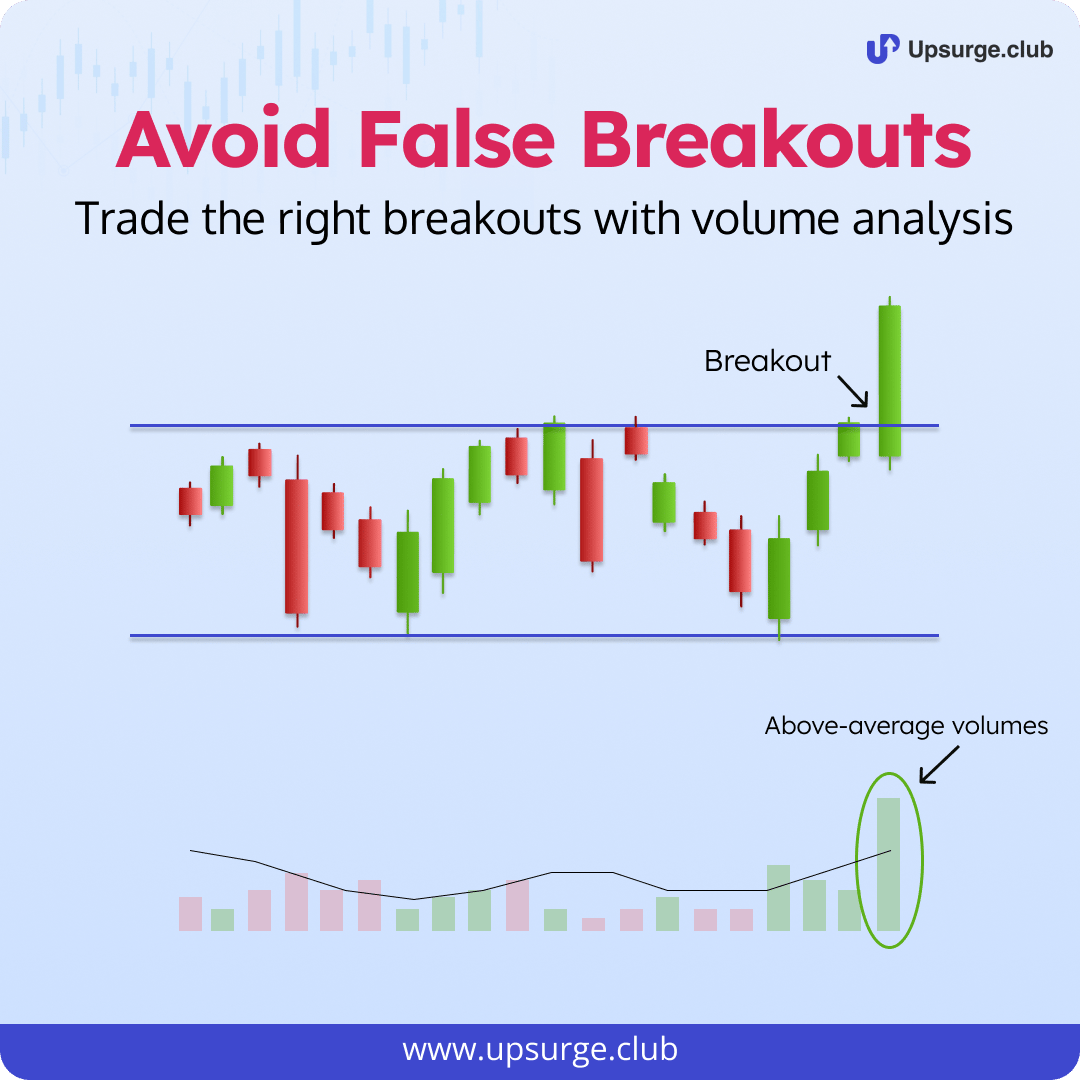
To spot false breakouts using volume, look for the following indicators:
1. Volume Spike: A genuine breakout usually has a significant volume increase. If the breakout occurs with low volume, it may be false.
2. Volume Divergence: If prices rise but volume decreases, it suggests weak buying pressure, indicating a potential false breakout.
3. Previous Highs: Compare the breakout volume to past breakouts. If the current volume is lower than previous successful breakouts, it might not hold.
4. Volume Confirmation: After a breakout, watch for sustained volume. If the price pulls back but volume remains low, it's likely a false move.
5. Volume Patterns: Analyze volume patterns over time. Consistent low volume during a breakout can signal a lack of commitment.
By focusing on these volume cues, you can better identify false breakouts in day trading.
What role does volume play in support and resistance levels?
Volume indicates the strength of support and resistance levels in day trading. High volume at a support level suggests strong buying interest, making it more likely to hold. Conversely, high volume at a resistance level indicates significant selling pressure, increasing the chances of a price reversal. Low volume can signal weak support or resistance, suggesting potential breakouts. Always analyze volume trends alongside price movements to make informed trading decisions.
How do I analyze volume during earnings reports?
To analyze volume during earnings reports, focus on these steps:
1. Check Pre-Market Volume: Look at the trading volume before the market opens. High pre-market volume can indicate strong interest or sentiment.
2. Compare to Average Volume: Assess the earnings report volume against the stock's average daily volume. A significant increase suggests heightened interest.
3. Look for Volume Spikes: Identify volume spikes right after the earnings announcement. This can signal either buying or selling pressure.
4. Direction of Price Movement: Analyze how price changes in relation to volume. If the price rises on high volume, it indicates strong buying interest; if it falls, it suggests selling pressure.
5. Volume Patterns: Observe volume patterns throughout the day. Sustained high volume can indicate a trend, while low volume may signal indecision or a reversal.
6. Use Volume Indicators: Implement indicators like On-Balance Volume (OBV) or Volume Moving Average to enhance your analysis.
Apply these techniques to effectively read volume charts during earnings reports for day trading.
What are the best volume chart patterns to look for?
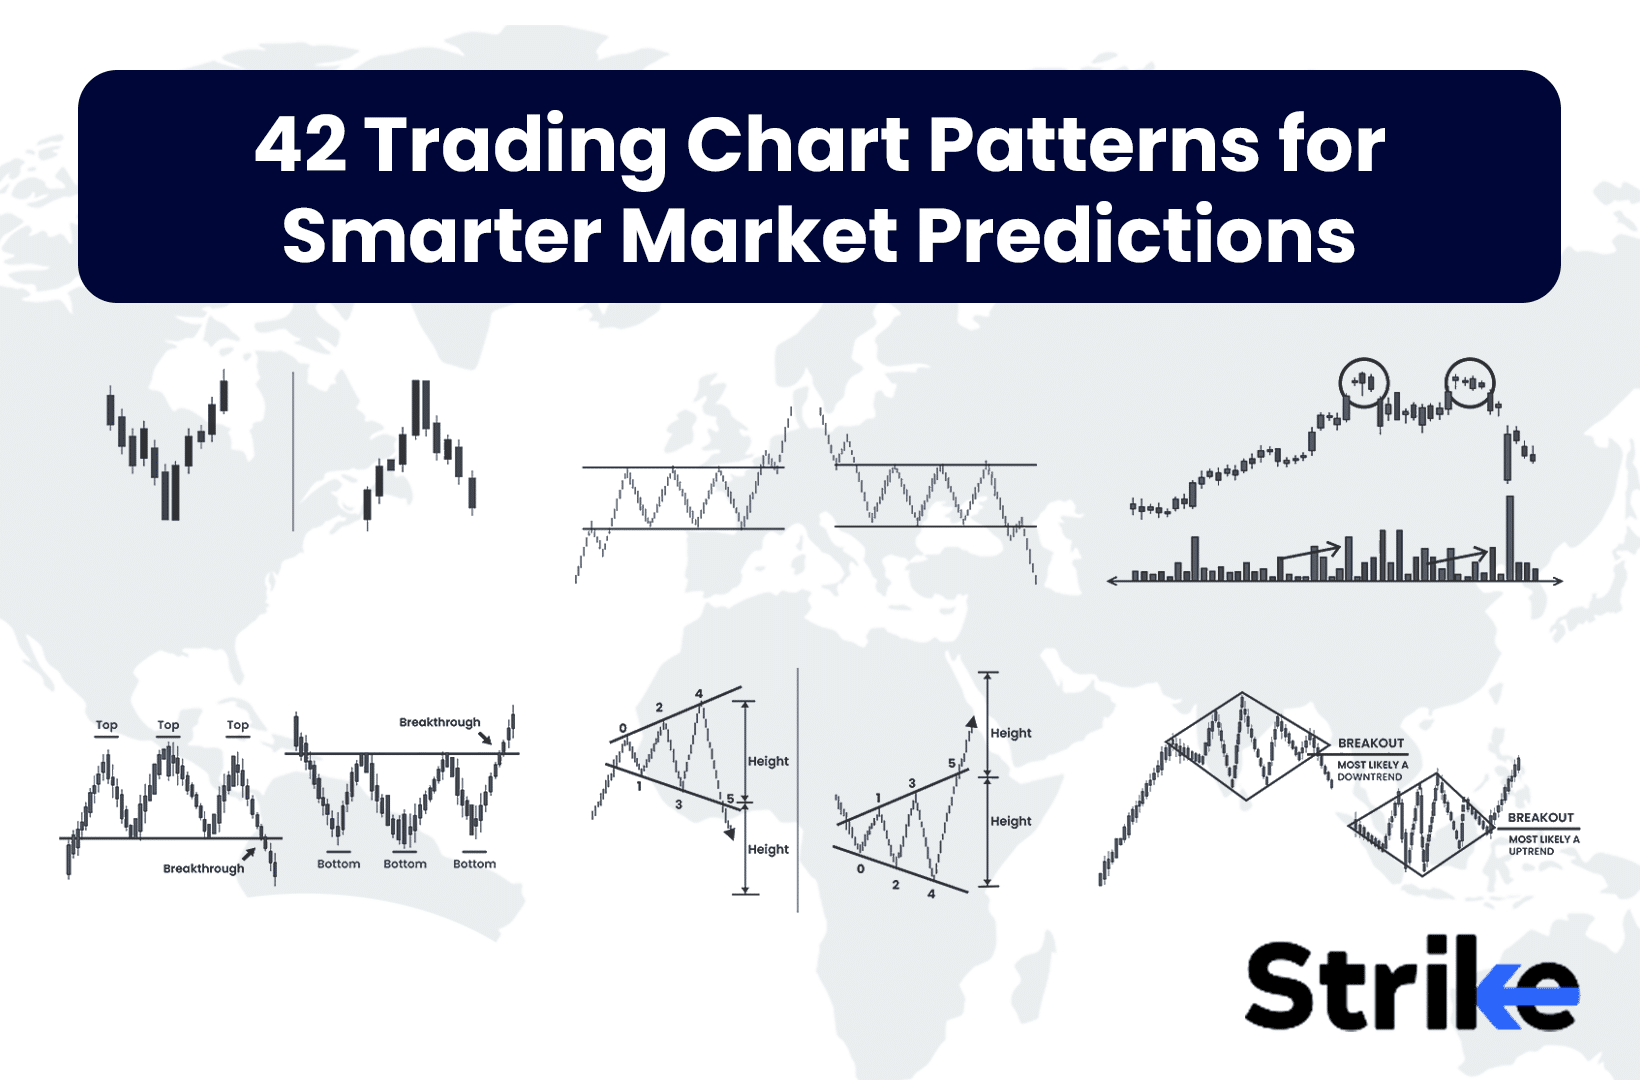
The best volume chart patterns for day trading include:
1. Volume Spikes: Sudden increases in volume often indicate strong buying or selling pressure, signaling potential reversals or breakouts.
2. Volume Trends: Consistent increases in volume during price rises suggest strength, while increasing volume during declines indicates selling pressure.
3. Volume Divergence: When price moves up but volume decreases, it can signal a weakening trend. Conversely, rising volume with stagnant prices may indicate accumulation.
4. Accumulation/Distribution: High volume on up days (accumulation) and low volume on down days (distribution) suggest bullish sentiment.
5. Climactic Volume: Extremely high volume at the end of a trend often signals exhaustion, indicating a potential reversal.
Look for these patterns to make informed trading decisions.
How can intraday volume affect trading decisions?
Intraday volume impacts trading decisions by indicating the strength of price movements. High volume often signals strong interest in a stock, confirming trends and making breakouts more reliable. Conversely, low volume might suggest weak momentum, increasing the risk of false breakouts. Day traders use volume charts to identify entry and exit points; for instance, a spike in volume during a price increase may prompt buying, while a surge on a price drop could signal selling. Understanding volume patterns helps traders make informed decisions based on market activity.
What tools and platforms provide volume chart analysis?
For volume chart analysis in day trading, use tools like TradingView, Thinkorswim, MetaTrader, and NinjaTrader. These platforms offer real-time volume data, customizable charts, and technical indicators. Additionally, websites like StockCharts and Yahoo Finance provide volume analysis features.
How do I combine volume analysis with other indicators?
To combine volume analysis with other indicators in day trading, first, identify key price levels using support and resistance. Then, use moving averages to confirm trends; for example, if volume increases while the price crosses above a moving average, it signals strength. Pair volume with momentum indicators like the RSI; if volume rises and RSI is below 30, it may indicate a reversal. Lastly, integrate candlestick patterns; a high-volume breakout from a consolidation pattern suggests a strong move. Always look for confirmation across multiple indicators to enhance your trading decisions.
What mistakes should I avoid when reading volume charts?
Avoid these mistakes when reading volume charts for day trading:
1. Ignoring Context: Always consider the price action alongside volume. High volume during a price drop may indicate selling pressure, while high volume on a price rise suggests buying interest.
2. Overlooking Average Volume: Compare current volume to historical averages. A spike in volume is more significant if it exceeds the typical range.
3. Misinterpreting Volume Trends: Look for consistent volume patterns, not just one-off spikes. Consistent volume increases can signal strong trends.
4. Focusing Solely on Volume: Don't rely only on volume data. Use it in conjunction with other indicators like price patterns and moving averages.
5. Neglecting Timeframes: Different timeframes can show different volume signals. Analyze volume on the same timeframe as your trading strategy.
6. Reacting Too Quickly: Avoid making impulsive decisions based on immediate volume changes. Wait for confirmation through price movement.
By steering clear of these pitfalls, you can improve your volume analysis for more effective day trading.
How can I practice reading volume charts effectively?
To practice reading volume charts effectively for day trading, follow these steps:
1. Use Real-Time Data: Access live charts to observe volume changes as they happen. This helps you understand how volume correlates with price movements.
2. Identify Patterns: Look for common patterns like spikes in volume during breakouts or reversals. Note how these patterns affect price.
3. Compare with Price Action: Analyze volume alongside price movements. A price increase with high volume typically indicates strong interest, while low volume may suggest weakness.
4. Set Alerts: Use alerts for significant volume changes. This keeps you focused on key moments without constant monitoring.
5. Review Historical Data: Study past volume trends on different stocks. Identify how volume impacted price in various scenarios.
6. Simulate Trading: Use a trading simulator to practice making trades based on volume analysis without risking real money.
7. Keep a Journal: Document your observations and outcomes. This reinforces learning and helps you identify successful strategies.
Regular practice using these methods will enhance your ability to read volume charts effectively for day trading.
Conclusion about How to Read Volume Charts for Day Trading
Incorporating volume analysis into your day trading strategy is essential for making informed decisions. Understanding volume charts helps identify trends, spot false breakouts, and assess the strength of price movements. By leveraging common volume indicators and analyzing volume during key events like earnings reports, you can enhance your trading effectiveness. Remember to combine volume insights with other technical indicators for a comprehensive approach. For more in-depth guidance and resources, turn to DayTradingBusiness to refine your skills and strategies in volume analysis.
Learn about How to Read Day Trading Charts Effectively