Did you know that the average day trader spends more time analyzing charts than a chef spends perfecting a soufflé? In the fast-paced world of day trading, understanding key indicators is crucial for making informed decisions. This article dives into essential day trading indicators, including moving averages, volume indicators, and the RSI, while also highlighting the significance of MACD and candlestick patterns. We'll explore support and resistance levels, the advantages of Bollinger Bands, and the importance of market news. Additionally, we’ll discuss how to effectively combine indicators, avoid common mistakes, backtest your strategies, and manage risk. With insights from DayTradingBusiness, you'll be better equipped to enhance your trading analysis and boost your success.
What are the key day trading indicators to analyze?
Key day trading indicators to analyze include:
1. Moving Averages: Use short-term (like the 10-day) and long-term (like the 50-day) moving averages to identify trends.
2. Relative Strength Index (RSI): This momentum oscillator helps determine overbought or oversold conditions, typically using a 14-day period.
3. MACD (Moving Average Convergence Divergence): This indicator shows the relationship between two moving averages, signaling potential buy or sell opportunities.
4. Volume: Analyze trading volume to confirm trends; higher volume often indicates stronger price movements.
5. Bollinger Bands: These measure market volatility and can indicate overbought or oversold conditions based on the price's position relative to the bands.
6. Stochastic Oscillator: This compares a security's closing price to its price range over a specific period, helping identify momentum shifts.
Using these indicators effectively can enhance your day trading strategy and decision-making process.
How do moving averages help in day trading?
Moving averages help in day trading by smoothing out price data, making trends easier to identify. They provide signals for entry and exit points; for instance, a short-term moving average crossing above a long-term moving average can indicate a buy signal. Traders often use them to determine support and resistance levels, helping to make informed decisions quickly. Additionally, moving averages can filter out market noise, allowing traders to focus on the overall trend rather than short-term fluctuations.
What role do volume indicators play in day trading?
Volume indicators are crucial in day trading as they show the strength of price movements. High volume often signals strong interest in a stock, confirming trends or breakouts. Conversely, low volume can indicate weak price movements, suggesting a lack of conviction. Traders use volume to identify potential reversals or continuations, helping them make informed decisions on entry and exit points. For effective analysis, combine volume indicators with price action for clearer insights.
How can I use RSI for day trading analysis?
To use the Relative Strength Index (RSI) for day trading analysis, follow these steps:
1. Identify Overbought and Oversold Levels: Use the standard RSI levels of 70 for overbought and 30 for oversold. A reading above 70 suggests a potential price drop, while below 30 indicates a possible price rise.
2. Look for Divergences: Check for divergences between the RSI and price action. If the price makes a new high, but the RSI does not, it may signal a reversal.
3. Combine with Other Indicators: Use RSI alongside other indicators like moving averages or MACD for confirmation before making trades.
4. Set Entry and Exit Points: Use RSI signals to determine entry points when the RSI exits the overbought/oversold zones and to set exit points based on retracement levels.
5. Monitor Timeframes: Use shorter timeframes (like 5-minute or 15-minute charts) for day trading to get timely signals.
6. Practice Risk Management: Always set stop-loss orders based on your trading plan to manage potential losses.
By applying these methods, you can effectively incorporate RSI into your day trading strategy.
What is the significance of MACD in day trading?
The MACD (Moving Average Convergence Divergence) is significant in day trading as it helps traders identify potential buy and sell signals through momentum shifts. By analyzing the MACD line, signal line, and histogram, traders can spot trends and reversals. A MACD crossover above the signal line suggests a bullish trend, while a crossover below indicates a bearish trend. This tool enhances decision-making, allowing traders to time entries and exits more effectively, maximizing profits while minimizing risks.
How do I interpret candlestick patterns for trading?
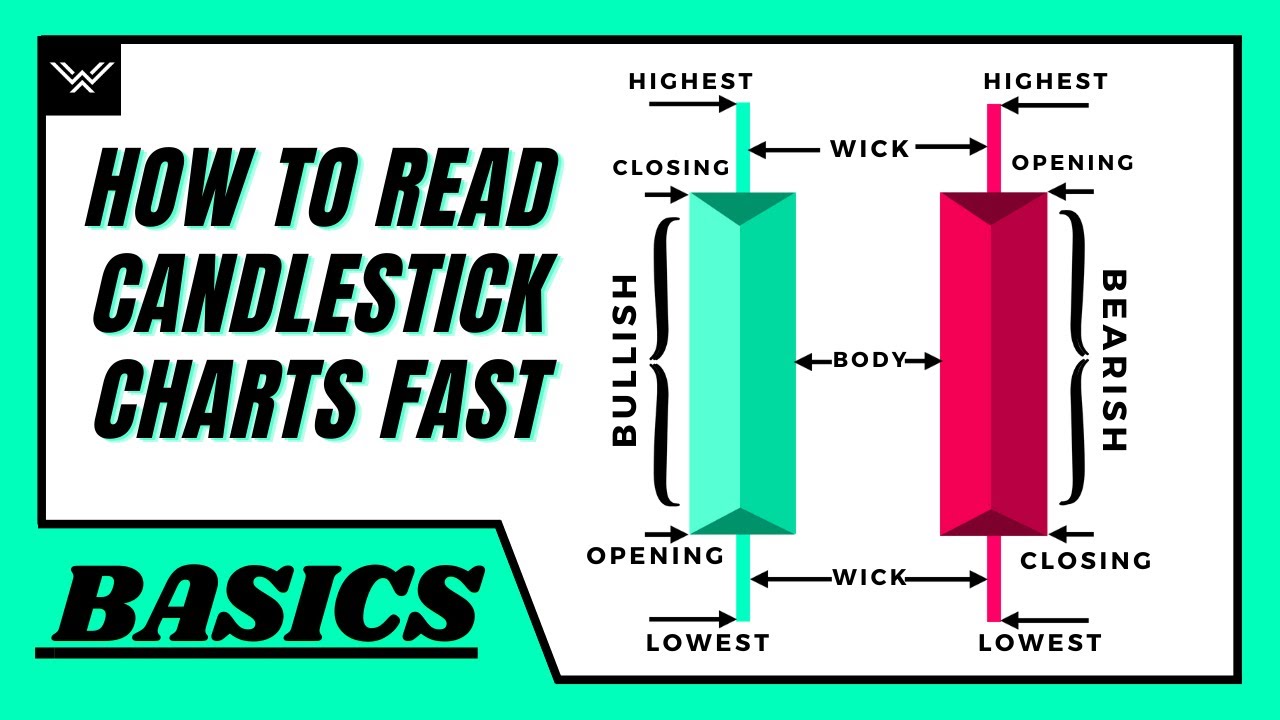
To interpret candlestick patterns for trading, focus on the shape, size, and color of each candle. A bullish candlestick has a close above the open and indicates buying pressure, while a bearish candlestick closes below the open, signaling selling pressure. Look for patterns like doji (indecision), engulfing (strong reversal), and hammer (potential bottom) to gauge market sentiment. Consider the context, such as support and resistance levels, and volume to validate signals. Always combine candlestick analysis with other indicators for a more robust trading strategy.
What are the best chart patterns for day traders?
The best chart patterns for day traders include:
1. Flags and Pennants: Indicate continuation of a trend, useful for quick entries.
2. Head and Shoulders: Signals potential reversals; watch for breakouts.
3. Double Tops and Bottoms: Highlight reversal points; confirm with volume.
4. Cup and Handle: Suggests bullish momentum; look for the breakout.
5. Triangles (Ascending, Descending, Symmetrical): Show consolidation; breakout direction determines trade.
Focus on volume and confirm signals with indicators like RSI or MACD for effective analysis.
How can I analyze support and resistance levels?
To analyze support and resistance levels in day trading, start by identifying key price points where the stock has reversed direction in the past. Use historical price charts to spot these levels visually. Look for horizontal lines where price often bounces or reverses.
Next, apply technical indicators like moving averages or Fibonacci retracement levels to confirm these areas. Volume can also help; increased trading volume at these levels suggests stronger support or resistance.
Lastly, keep an eye on trendlines—draw diagonal lines connecting highs and lows to see potential breakout or breakdown points. Regularly update your analysis as new price data comes in.
What are the benefits of using Bollinger Bands in day trading?
Bollinger Bands help day traders identify volatility and price levels. The upper and lower bands indicate potential overbought or oversold conditions. Traders can use these signals to make entry and exit decisions. The squeeze, when bands narrow, highlights potential price breakouts. Additionally, Bollinger Bands work well with other indicators for confirming trends, enhancing overall trading strategies.
How do I effectively use trend lines in my analysis?
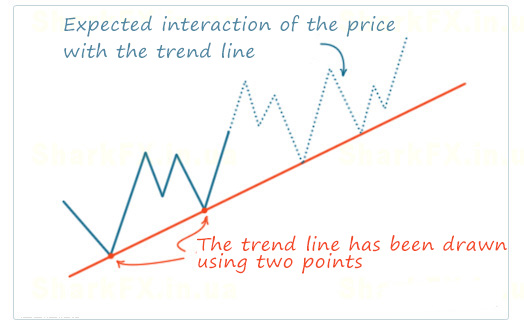
To effectively use trend lines in your day trading analysis, follow these steps:
1. Identify Market Trends: Draw trend lines by connecting the highs in a downtrend or the lows in an uptrend. This helps visualize the overall market direction.
2. Confirm Breakouts: Look for price movements that break through trend lines. A breakout above a downtrend line may signal a potential buy, while a breakdown below an uptrend line may indicate a sell.
3. Use Multiple Time Frames: Analyze trend lines across different time frames to get a clearer picture of the market. A trend line on a daily chart may provide stronger signals than one on a minute chart.
4. Combine with Other Indicators: Enhance your analysis by using trend lines alongside other indicators like moving averages or volume. This can validate your trading decisions.
5. Adjust as Needed: Be flexible and adjust your trend lines as the market evolves. New highs or lows may require you to redraw trend lines for accuracy.
By integrating these techniques, you can leverage trend lines to make informed trading decisions.
Learn about How to Use Trend Lines in Day Trading Charts
What is the importance of market news in day trading?
Market news is crucial in day trading because it drives price movements and volatility. Traders use news to make informed decisions, anticipating how events like earnings reports, economic data, or geopolitical developments will impact stocks. Timely awareness of market news allows traders to capitalize on short-term price fluctuations, improving their chances of profit. Staying updated on news helps in analyzing indicators effectively, as it provides context for price trends and signals.
How can I combine indicators for better trading decisions?
Combine indicators by using a mix of trend-following and momentum indicators. For example, pair a moving average (like the 50-day MA) with the Relative Strength Index (RSI). This helps confirm trends while identifying overbought or oversold conditions.
Also, consider using Bollinger Bands alongside MACD. Bollinger Bands gauge volatility while MACD signals momentum shifts. Look for convergence or divergence between these indicators for stronger signals.
Always backtest your combinations on historical data to see how they perform together before applying them in live trading.
What mistakes should I avoid when analyzing indicators?
Avoid these common mistakes when analyzing day trading indicators:
1. Ignoring Multiple Indicators: Relying on just one indicator can lead to false signals. Use a combination to confirm trends.
2. Overtrading on Signals: Don’t act on every indicator change. Wait for clear confirmation to avoid unnecessary losses.
3. Neglecting Market Context: Always consider overall market conditions. Indicators can give misleading signals in volatile environments.
4. Failing to Backtest: Test your indicators against historical data. This helps identify their effectiveness before using them in live trading.
5. Overcomplicating Analysis: Simplicity can be powerful. Too many indicators can create confusion and lead to poor decisions.
6. Ignoring Risk Management: No matter how strong an indicator seems, always set stop-loss orders to protect your capital.
7. Disregarding Timeframes: Ensure your indicators match your trading style. Day traders need short-term indicators, not long-term ones.
8. Emotional Trading: Don’t let emotions cloud your judgment. Stick to your strategy and the signals your indicators provide.
By avoiding these mistakes, you can enhance your analysis of day trading indicators and improve your trading outcomes.
How do I backtest my day trading indicators?
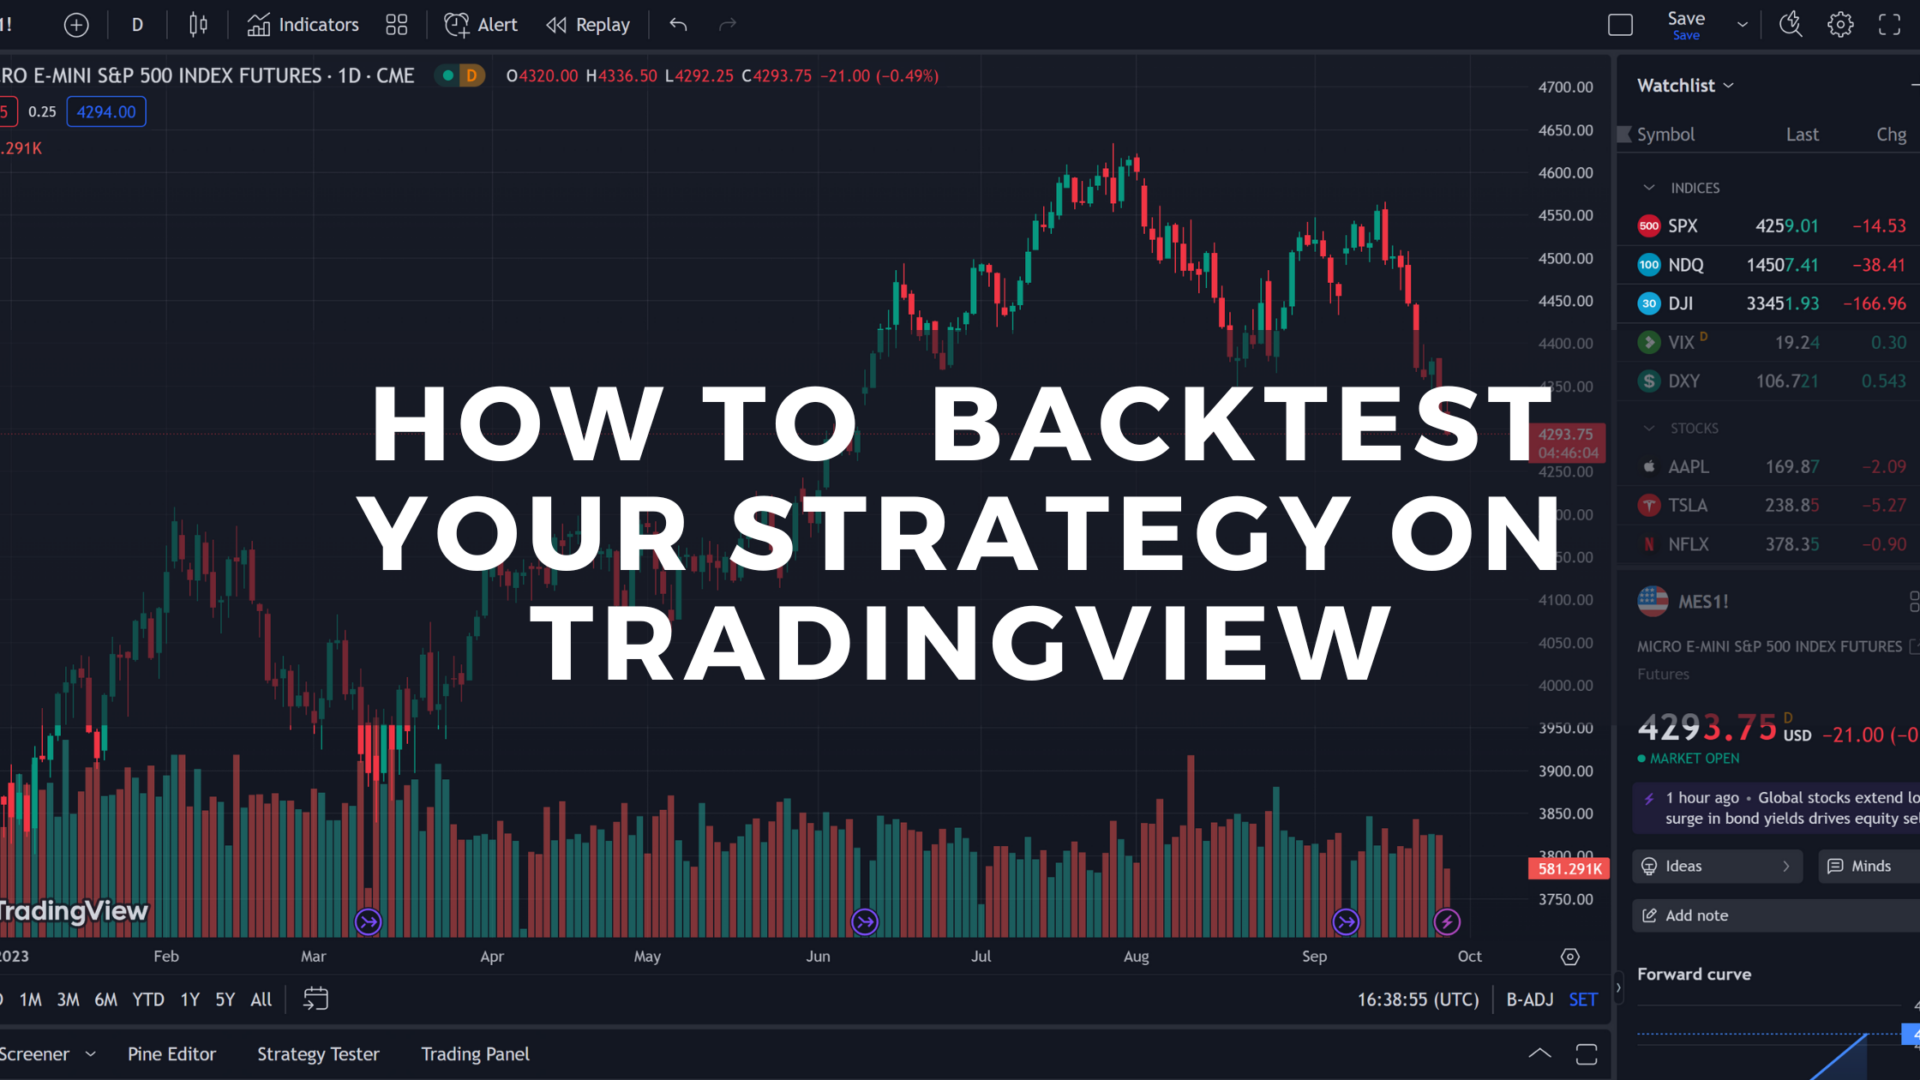
To backtest your day trading indicators, follow these steps:
1. Select a Trading Platform: Use a platform that allows backtesting, like TradingView or MetaTrader.
2. Gather Historical Data: Obtain historical price data for the assets you want to trade.
3. Define Your Strategy: Clearly the rules for your indicators—entry and exit points, stop-loss, and take-profit levels.
4. Implement Indicators: Add your chosen indicators to the historical data within the platform.
5. Run the Backtest: Execute the backtest feature to simulate trades based on your strategy over the historical data.
6. Analyze Results: Review metrics like win rate, average profit/loss, and drawdown to assess performance.
7. Adjust and Optimize: Modify your strategy based on the results, and retest to improve effectiveness.
8. Verify with Forward Testing: After backtesting, use a demo account for real-time testing before live trading.
Learn about How to Backtest Day Trading Bots Effectively?
What strategies enhance day trading indicator analysis?
To enhance day trading indicator analysis, focus on these strategies:
1. Combine Indicators: Use a mix of leading and lagging indicators, like RSI for momentum and moving averages for trend confirmation.
2. Set Clear Parameters: Customize indicator settings based on the asset's volatility and your trading style for better accuracy.
3. Backtest Strategies: Test your indicator combinations on historical data to assess effectiveness before live trading.
4. Monitor Market Conditions: Adjust indicator usage based on market conditions—trending vs. ranging markets may require different approaches.
5. Use Price Action: Incorporate price action analysis alongside indicators to gain context and improve decision-making.
6. Stay Updated: Keep informed about news and events that can impact market behavior, as indicators can sometimes lag during volatility.
7. Risk Management: Apply strict risk management rules, using indicators to set stop-loss and take-profit levels.
8. Practice Patience: Wait for confirmation signals from your indicators before entering trades to avoid false breakouts.
These strategies can significantly improve your day trading indicator analysis and overall trading success.
How can I manage risk while using trading indicators?
To manage risk while using trading indicators, first, set a clear stop-loss level for each trade based on your risk tolerance. Use position sizing to determine how much capital to risk on each trade. Diversify your trades by using multiple indicators to confirm signals, reducing reliance on a single source. Monitor market conditions and adjust your strategy accordingly, as indicators can behave differently in varying environments. Finally, regularly review your trades to learn from mistakes and refine your approach.
Learn about How to Use Charts to Manage Day Trading Risk
Conclusion about How to Analyze Day Trading Indicators Effectively
In summary, effectively analyzing day trading indicators is crucial for making informed trading decisions. By understanding key indicators like moving averages, volume, RSI, MACD, and candlestick patterns, traders can enhance their strategies and improve performance. Combining these tools while managing risk and staying updated on market news can lead to better outcomes. For more in-depth insights and tailored guidance, DayTradingBusiness is here to support your trading journey.
Learn about How to Analyze Historical Data Using Day Trading Charts