Did you know that even seasoned traders can get dizzy trying to decipher candlestick patterns? In the fast-paced world of day trading, understanding common patterns is crucial for making informed decisions. This article explores the most prevalent day trading patterns, including candlestick formations and their influence on trading strategies. We delve into the significance of support and resistance, trend reversals, and continuation patterns, highlighting how traders can predict price movements through chart analysis. By examining key characteristics of bullish and bearish patterns, the role of volume in pattern recognition, and the implications of formations like head and shoulders, flags, and pennants, you'll gain valuable insights. Additionally, we address the importance of early identification of chart patterns, the use of moving averages for confirmation, psychological factors affecting pattern interpretation, and common pitfalls to avoid. Stay ahead of the curve with the expertise offered by DayTradingBusiness as you navigate the complex landscape of day trading patterns.
What are the most common day trading patterns?
The most common day trading patterns include:
1. Head and Shoulders: Indicates a reversal from bullish to bearish.
2. Double Top/Bottom: Signals potential reversals, with double tops suggesting a price drop and double bottoms indicating a rise.
3. Flags and Pennants: Continuation patterns showing a brief consolidation before the trend resumes.
4. Triangles: Ascending, descending, and symmetrical triangles signal potential breakout points.
5. Cup and Handle: Suggests a bullish trend after a period of consolidation.
Recognizing these patterns helps traders make informed decisions on entry and exit points.
How do candlestick patterns influence day trading decisions?
Candlestick patterns help day traders identify potential market reversals or continuations. For example, a bullish engulfing pattern may signal a buying opportunity, while a bearish engulfing pattern can indicate a sell signal. Patterns like the Doji suggest indecision, prompting traders to wait for confirmation. Recognizing these patterns allows traders to make informed decisions about entry and exit points, manage risk, and optimize trade timing. Understanding these signals is crucial for successful day trading strategies.
What is the significance of support and resistance in day trading?
Support and resistance are crucial in day trading because they help traders identify potential entry and exit points. Support levels indicate where a stock tends to stop falling and may bounce back up, while resistance levels show where prices typically stop rising and may reverse. Recognizing these zones allows traders to make informed decisions, manage risk, and set realistic profit targets. By analyzing these patterns, traders can anticipate price movements, increasing their chances of successful trades.
How can traders identify trend reversal patterns?
Traders can identify trend reversal patterns by looking for specific formations on charts. Common patterns include head and shoulders, double tops, and double bottoms.
1. Head and Shoulders: This pattern indicates a change from bullish to bearish. Look for three peaks—two shoulders and a higher head.
2. Double Tops: This pattern occurs after an uptrend and signals a reversal. It features two peaks at roughly the same price level.
3. Double Bottoms: This is the opposite of the double top, appearing after a downtrend and signaling a bullish reversal. It shows two troughs at similar price points.
4. Candlestick Patterns: Look for reversal signals like pin bars, engulfing patterns, or dojis at key support and resistance levels.
5. Divergence: When the price moves in one direction but indicators like RSI or MACD move in the opposite direction, it can signal a potential reversal.
Combine these patterns with volume analysis for stronger confirmation.
What role do continuation patterns play in day trading?
Continuation patterns indicate that a trend is likely to continue after a brief pause. In day trading, they help traders identify potential entry points for trades in the direction of the prevailing trend. Common patterns include flags, pennants, and triangles. Recognizing these can enhance decision-making, improve risk management, and increase the chances of profitable trades.
How do chart patterns help in predicting price movements?
Chart patterns help predict price movements by visually representing market psychology and trends. For example, a “head and shoulders” pattern often signals a reversal, indicating a potential price decline. Conversely, a “cup and handle” suggests a bullish continuation, hinting at upward momentum. These patterns reflect supply and demand dynamics, allowing traders to identify entry and exit points with greater accuracy. By analyzing patterns like flags or triangles, traders can gauge possible breakout or breakdown scenarios, enhancing their decision-making in day trading.
What are the key characteristics of bullish and bearish patterns?
Bullish patterns indicate potential upward price movement and are characterized by higher highs and higher lows, often seen in formations like flags, pennants, and cup-and-handle. They suggest strong buying interest.
Bearish patterns signal potential downward price movement, marked by lower highs and lower lows, often found in head-and-shoulders, double tops, and descending triangles. These indicate strong selling pressure.
Both patterns help traders identify market sentiment and make informed decisions.
How can volume analysis enhance pattern recognition in day trading?
Volume analysis enhances pattern recognition in day trading by confirming the strength of price movements. High volume during a breakout signals strong buying interest, making the pattern more reliable. Conversely, low volume may indicate weak momentum, suggesting caution. Key patterns like flags and triangles become more significant when accompanied by volume spikes, helping traders identify potential reversals or continuations. By analyzing volume trends, traders can better anticipate market shifts and make informed decisions.
What are the implications of head and shoulders patterns?
Head and shoulders patterns indicate a potential trend reversal in day trading. The formation suggests that after a bullish trend, the price may shift to a bearish direction. The left shoulder and right shoulder represent peaks, while the head is the highest point. A breakout below the neckline confirms the reversal, signaling traders to sell or short the asset. Conversely, an inverse head and shoulders signals a potential bullish reversal after a downtrend, prompting buying opportunities. Recognizing these patterns helps traders anticipate market shifts and make informed decisions.
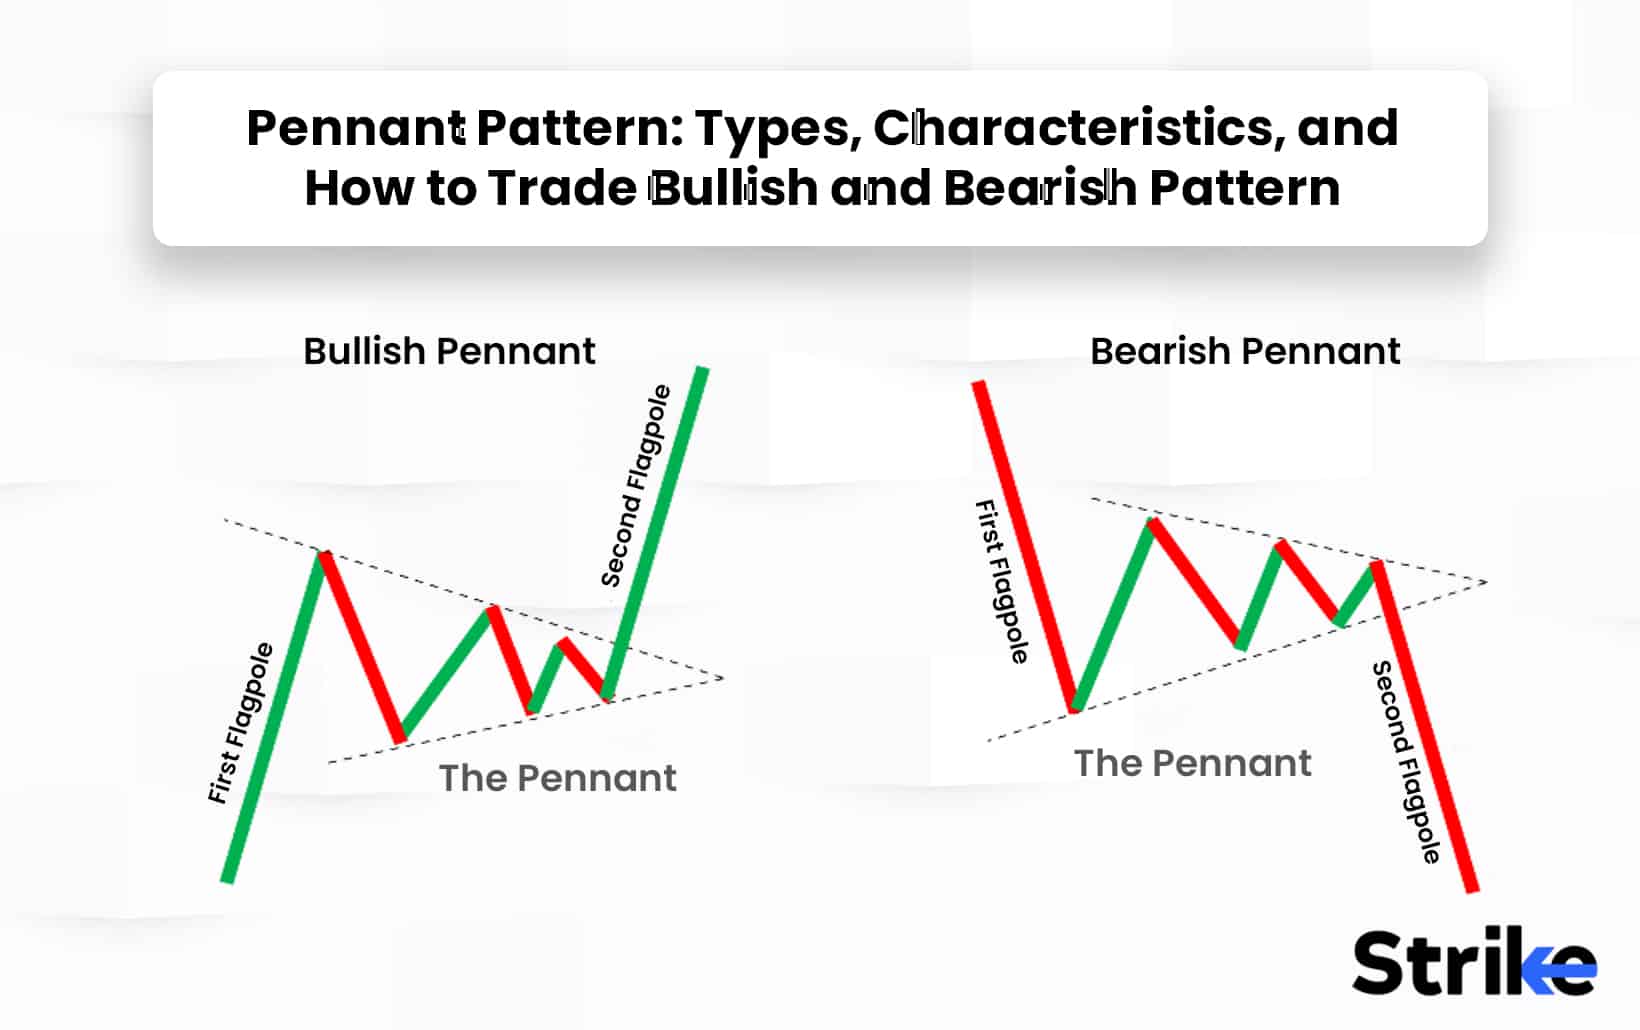
How do flags and pennants signal potential trades?
Flags and pennants signal potential trades by indicating a continuation pattern in price movements. When a stock experiences a sharp price increase or decrease, it often forms a flag or pennant as a brief consolidation phase. Traders look for a breakout above the flag or pennant's upper trendline as a buy signal, or a breakdown below the lower trendline as a sell signal. These patterns suggest that the previous trend is likely to resume, providing clear entry and exit points for day traders.
What is the importance of identifying chart patterns early?

Identifying chart patterns early is crucial in day trading because it allows traders to anticipate price movements and make timely decisions. Early recognition of patterns like flags, triangles, or head and shoulders can signal potential breakouts or reversals, enabling traders to enter or exit positions effectively. This proactive approach can maximize profits while minimizing risks, as it helps in setting stop-loss orders and profit targets based on the expected behavior of the asset. Ultimately, spotting these patterns early enhances a trader's ability to capitalize on market trends and improve overall trading performance.
How can traders use moving averages to confirm patterns?
Traders can use moving averages to confirm patterns by observing crossovers and trend direction. For example, when a short-term moving average crosses above a long-term moving average, it signals a potential bullish trend, confirming a bullish pattern like a double bottom. Conversely, if the short-term moving average crosses below the long-term moving average, it supports a bearish pattern such as a head and shoulders. Additionally, traders look for price action relative to the moving averages; if the price consistently stays above the moving average, it confirms an uptrend. Using moving averages in conjunction with patterns enhances decision-making in day trading.
Learn about How to Use Moving Averages in Day Trading Charts
What psychological factors affect the interpretation of trading patterns?

Psychological factors that affect the interpretation of trading patterns include cognitive biases, emotional responses, and social influences. Traders often fall prey to confirmation bias, seeking information that supports their beliefs about a pattern. Fear and greed can lead to impulsive decisions, causing misinterpretation of signals. Herd behavior can lead traders to follow the crowd, ignoring individual analysis of patterns. Overconfidence can result in underestimating risks, skewing the understanding of trading signals. These psychological elements significantly impact decision-making in day trading.
How can day traders effectively use technical indicators with patterns?
Day traders can effectively use technical indicators with patterns by combining them to confirm signals and enhance decision-making. For instance, using moving averages to identify trend direction can help traders spot bullish or bearish patterns. The Relative Strength Index (RSI) can indicate overbought or oversold conditions, confirming reversal patterns like head and shoulders or double tops.
Traders often look for patterns like flags and pennants alongside volume indicators; increased volume during pattern formation signals strength. Candlestick patterns, when paired with indicators like MACD, can provide insights into potential entry and exit points. Always backtest your strategies to ensure effectiveness in real market conditions.
Learn about How to Use Technical Indicators with Day Trading Patterns
What are the common mistakes to avoid when trading patterns?
1. Ignoring Volume: Always check the volume when trading patterns; low volume can signal weak moves.
2. Overtrading: Don’t chase every pattern; focus on high-probability setups to avoid unnecessary losses.
3. Misinterpreting Patterns: Ensure you understand the pattern fully before acting; misinterpretation leads to poor decisions.
4. Neglecting Risk Management: Always set stop-loss orders; failing to protect your capital can wipe out gains.
5. Emotional Trading: Avoid letting fear or greed influence your trades; stick to your plan and strategy.
6. Relying Solely on Patterns: Use patterns as part of a broader strategy; combining indicators provides better insights.
7. Lack of Backtesting: Test patterns against historical data before trading; it helps gauge their reliability.
8. Ignoring Market Conditions: Be aware of the overall market trend; patterns can behave differently in various conditions.
Learn about Common Mistakes in Day Trading Analysis to Avoid
How do market news and events impact day trading patterns?
Market news and events significantly influence day trading patterns by causing volatility and shifts in investor sentiment. For example, earnings reports can lead to rapid price movements, triggering patterns like breakouts or reversals. Economic indicators, such as employment data, often create trends that traders capitalize on. Major geopolitical events can also disrupt normal trading patterns, leading to increased volume and sharp price changes. Understanding how news affects market psychology helps traders anticipate and react to these patterns effectively.
Learn about How News Events Impact Day Trading Decisions
Conclusion about Common Day Trading Patterns and Their Significance
In conclusion, understanding common day trading patterns is crucial for making informed trading decisions. By recognizing candlestick formations, support and resistance levels, and trend reversals, traders can better predict price movements. The integration of volume analysis and moving averages further enhances pattern recognition, allowing for more accurate trade entries and exits. Additionally, being aware of psychological factors and market influences can help mitigate common mistakes. As you navigate the complexities of day trading, leveraging the insights from DayTradingBusiness will empower you to refine your strategies and improve your trading outcomes.
Learn about What Are the Most Common Myths About Day Trading Bots?