Did you know that some traders spend more time analyzing charts than actual data? In the fast-paced world of day trading, understanding the right indicators is crucial for success. This article delves into the best day trading indicators for beginners, covering essential tools like moving averages, RSI, and MACD, among others. Learn how Bollinger Bands and volume indicators enhance your trading strategy, and discover the importance of support and resistance levels. We’ll also discuss common pitfalls, the significance of candlestick patterns, and how to effectively combine indicators. With tips on practicing and resources for learning, this guide from DayTradingBusiness will equip you with the knowledge to navigate the trading landscape confidently.
What are the best day trading indicators for beginners?
The best day trading indicators for beginners include:
1. Moving Averages: Simple Moving Average (SMA) and Exponential Moving Average (EMA) help identify trends.
2. Relative Strength Index (RSI): Measures momentum and identifies overbought or oversold conditions.
3. Bollinger Bands: Show volatility and price levels relative to a moving average.
4. Volume: Analyzing volume helps confirm trends and reversals.
5. MACD (Moving Average Convergence Divergence): Indicates potential buy or sell signals based on moving average crossovers.
These indicators can help beginners make informed trading decisions.
How do moving averages help in day trading?
Moving averages help in day trading by smoothing price data to identify trends and potential reversals. They provide clear signals when prices cross above or below the average, indicating buy or sell opportunities. Short-term moving averages react quickly to price changes, allowing traders to capitalize on rapid market movements. Using moving averages in conjunction with other indicators enhances decision-making and confirms trends, making them essential tools for beginners in day trading.
What is the role of RSI in day trading strategies?
The Relative Strength Index (RSI) helps day traders identify overbought or oversold conditions in a stock. An RSI above 70 signals that a stock may be overbought, suggesting a potential price drop. Conversely, an RSI below 30 indicates oversold conditions, which may point to a price increase. Traders use these signals to time entries and exits, enhancing their strategies for maximizing profits. Integrating RSI into day trading can improve decision-making and risk management.
How can MACD be used effectively by new traders?
New traders can use the MACD (Moving Average Convergence Divergence) effectively by focusing on three key aspects:
1. Signal Line Crossovers: Look for when the MACD line crosses above the signal line for a potential buy signal, and when it crosses below for a sell signal. This helps identify momentum shifts.
2. Divergence: Pay attention to divergence between the MACD and price movements. If prices are making new highs while the MACD isn’t, it could signal a reversal.
3. Histogram Analysis: Use the MACD histogram to gauge the strength of the trend. A growing histogram indicates strengthening momentum, while a shrinking histogram suggests weakening momentum.
By combining these elements, new traders can make informed decisions and enhance their trading strategies.
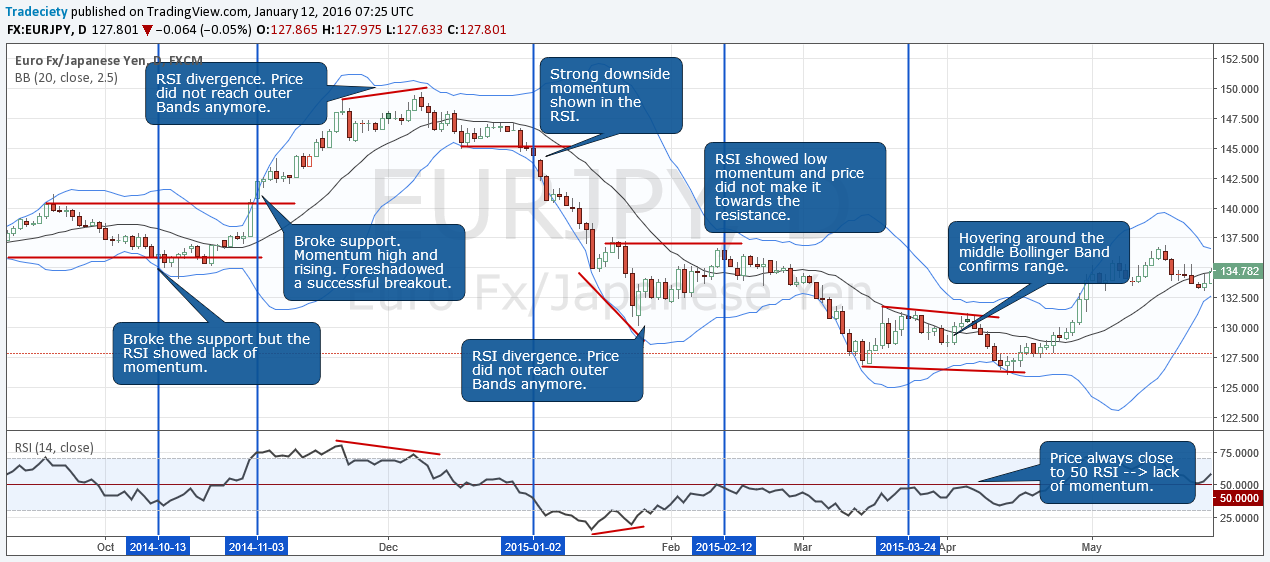
Why are Bollinger Bands important for day trading?
Bollinger Bands are important for day trading because they help traders identify volatility and potential price reversals. The bands adjust to market conditions, providing insights into whether an asset is overbought or oversold. Traders use the squeeze of the bands as a signal for potential breakouts. This makes Bollinger Bands a valuable tool for entering and exiting trades effectively. They enhance decision-making by visually representing market trends and price fluctuations.
What is the significance of volume indicators in day trading?
Volume indicators are crucial in day trading because they show the strength or weakness of a price movement. High volume often confirms a trend, while low volume may signal a reversal or lack of commitment. For beginners, using volume indicators helps identify entry and exit points effectively. They can also indicate potential breakouts or breakdowns, guiding traders in making informed decisions. In short, volume indicators enhance trade accuracy and risk management in day trading.
How do candlestick patterns assist beginners in day trading?
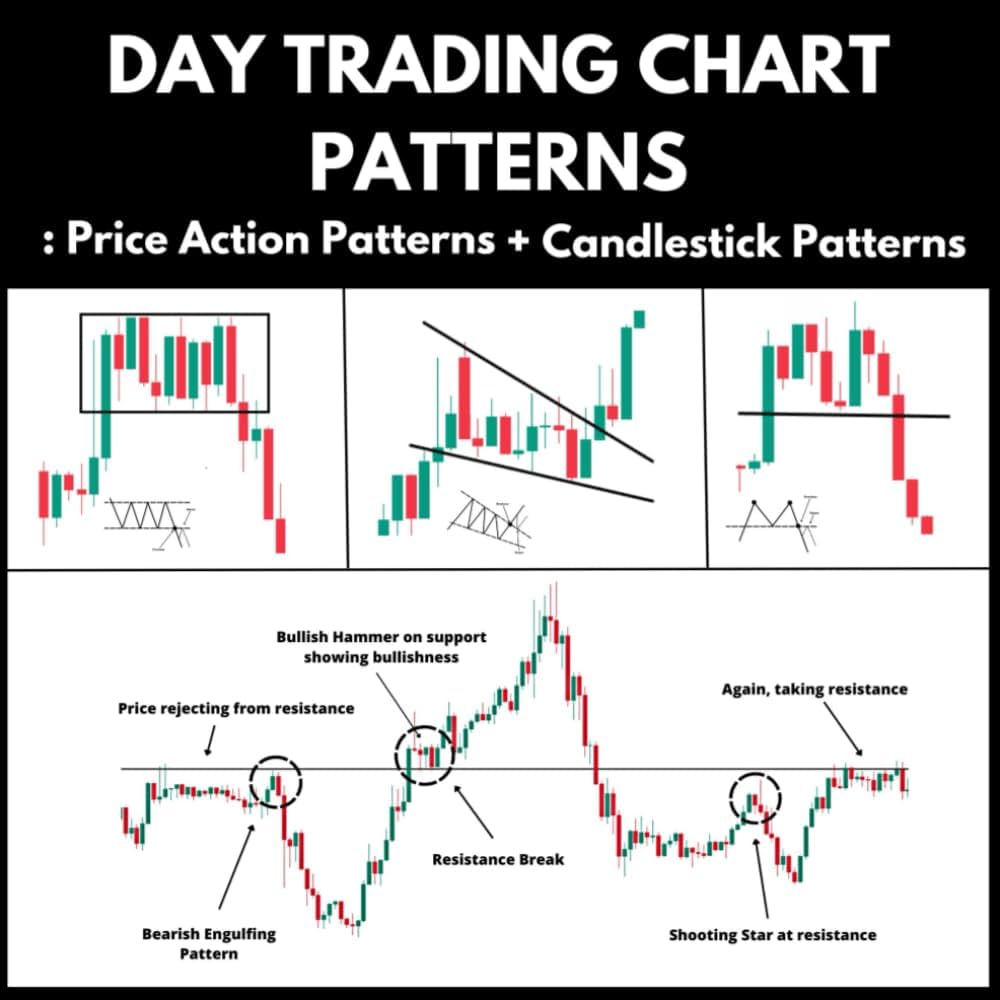
Candlestick patterns help beginners in day trading by providing visual cues about market sentiment and potential price movements. Key patterns like doji, hammer, and engulfing can indicate reversals or continuations, allowing traders to make informed decisions. By analyzing these patterns alongside volume and trend, beginners can identify entry and exit points more effectively. This visual representation simplifies complex data, making it easier for newcomers to spot trends and manage risk.
What are support and resistance levels, and why do they matter?
Support levels are price points where a stock tends to stop falling and may bounce back up, while resistance levels are where a stock often stops rising and may drop back down. They matter because they help traders identify potential entry and exit points, guiding decisions on when to buy or sell. Understanding these levels can enhance trading strategies and improve the chances of success in day trading.
How can beginners use the Average True Range (ATR) indicator?
Beginners can use the Average True Range (ATR) indicator to measure market volatility. First, add the ATR to your trading chart, typically set to a 14-day period. Use it to identify potential price movements; higher ATR values indicate greater volatility, suggesting larger price swings. This helps in setting stop-loss orders: place them at a distance based on the ATR to avoid getting stopped out too early. Additionally, combine ATR with other indicators for better entry and exit points. Remember, ATR does not indicate direction; it only measures volatility.
What is the best way to combine indicators for day trading?
The best way to combine indicators for day trading is to use a mix of trend-following and momentum indicators. Start with a moving average, like the 50-day or 200-day, to identify the overall trend. Then, add a momentum indicator like the RSI (Relative Strength Index) to gauge overbought or oversold conditions.
For confirmation, include a volume indicator, such as the Volume Moving Average, to validate price movements. This combination helps you spot entry and exit points more effectively. Always backtest your strategy to ensure it aligns with your trading style.
How do trend lines aid in day trading decisions?
Trend lines help day traders identify the direction of price movement, making it easier to spot potential entry and exit points. By connecting significant highs or lows on a chart, traders can visualize support and resistance levels. This clarity aids in making informed decisions on whether to buy or sell, enhancing risk management and improving overall trading strategy.
Learn about How to Use Trend Lines in Day Trading Charts
What are the most common mistakes with day trading indicators?
The most common mistakes with day trading indicators include over-reliance on a single indicator, ignoring market context, and failing to confirm signals with multiple indicators. Many beginners misuse lagging indicators without understanding their delay, leading to late entries or exits. Others might misinterpret volatile market conditions, applying indicators designed for stable environments. Neglecting risk management and not adjusting indicators for personal trading styles can also hinder success. Lastly, not practicing with indicators on a demo account can result in poor decision-making under real conditions.
Learn about Common mistakes that increase stop-loss risk in day trading
How can beginners practice using day trading indicators?
Beginners can practice using day trading indicators by following these steps:
1. Choose Key Indicators: Start with popular indicators like Moving Averages (MA), Relative Strength Index (RSI), and Bollinger Bands. These are user-friendly and effective.
2. Use a Demo Account: Open a demo trading account to practice without risking real money. This allows you to experiment with different indicators in real-time market conditions.
3. Learn Chart Patterns: Familiarize yourself with how indicators appear on charts. Focus on reading signals and understanding trends.
4. Set Up Alerts: Use alert features on trading platforms to notify you when indicators hit specific levels, helping you practice timing your trades.
5. Analyze Historical Data: Review historical charts to see how indicators performed in past market conditions, which helps build your analytical skills.
6. Keep a Trading Journal: Document your trades, noting which indicators you used and the outcome. This reflection helps refine your strategy.
7. Join Online Communities: Engage with day trading forums or social media groups to share experiences and learn from others’ successes and mistakes.
By consistently practicing these methods, beginners can become proficient in using day trading indicators effectively.
Learn about How to Analyze Historical Data Using Day Trading Charts
What are the benefits of using chart patterns in day trading?
Chart patterns in day trading help identify potential price movements and trends, allowing traders to make informed decisions. They provide visual cues for entries, exits, and stop-loss placements. Patterns like triangles, flags, and head-and-shoulders can indicate continuation or reversal signals. This enhances a trader's ability to predict market behavior, manage risk effectively, and maximize profits. Additionally, using chart patterns can increase confidence in trades by offering a structured approach to analysis.
Learn about What Are the Benefits of Using a Prop Firm for Day Trading?
How do economic indicators influence day trading strategies?
Economic indicators influence day trading strategies by providing insights into market trends and potential price movements. Key indicators like GDP growth, unemployment rates, and inflation can affect stock prices and trading volumes. Traders often monitor reports such as the Non-Farm Payrolls or Consumer Price Index (CPI) to anticipate market reactions. For beginners, focusing on indicators like moving averages, relative strength index (RSI), and volume can help gauge market sentiment and identify entry and exit points. Understanding how these indicators respond to economic data can enhance decision-making and improve trading outcomes.
Learn about How Do Institutional Traders Influence Day Trading Strategies?
What resources are available for learning about day trading indicators?
For learning about day trading indicators, consider these resources:
1. Books: "Day Trading for Dummies" and "Technical Analysis of the Financial Markets" are great starting points.
2. Online Courses: Websites like Udemy and Coursera offer courses specifically on day trading and technical indicators.
3. YouTube Channels: Channels like Warrior Trading and ClayTrader provide practical insights and tutorials on indicators.
4. Trading Platforms: Many platforms like ThinkorSwim and TradingView offer educational resources and demo accounts to practice using indicators.
5. Forums: Communities like Reddit's r/Daytrading and Trade2Win can provide real-world advice and shared experiences.
6. Webinars: Look for live sessions from trading educators that focus on day trading strategies and indicators.
Utilizing these resources will help you understand and effectively apply day trading indicators.
Learn about What Are the Best Resources for Learning Day Trading Bots?
Conclusion about Best Day Trading Indicators for Beginners
In conclusion, understanding and effectively using day trading indicators is crucial for beginners looking to navigate the markets successfully. Key tools like moving averages, RSI, MACD, and Bollinger Bands provide valuable insights, while volume indicators and candlestick patterns help refine strategies. By mastering support and resistance levels, trend lines, and the Average True Range, new traders can make informed decisions. Remember, avoiding common pitfalls and practicing with these indicators will enhance your trading skills. For comprehensive support and resources, DayTradingBusiness is here to guide you on your journey to becoming a proficient day trader.
Learn about Best Day Trading Brokers for Beginners