Did you know that in the world of trading, volume can be as revealing as a magician's secret? In this article, we delve into the crucial role of volume analysis in day trading, exploring how it influences price movements and underpins effective trading strategies. You'll learn what volume analysis entails, its key indicators, and how to interpret volume spikes for trend confirmation and potential reversals. We also discuss the difference between high and low volume trading, the relationship between volume and liquidity, and practical tools to enhance your trading decisions. Plus, discover common volume patterns, best practices for integrating volume analysis into your trading plan, and critical mistakes to avoid. With insights from DayTradingBusiness, you’ll be equipped to make informed trading choices based on volume dynamics.
What is volume analysis in day trading?
Volume analysis in day trading refers to examining the number of shares or contracts traded within a specific timeframe to gauge market activity. High volume often indicates strong interest and can signal potential price movements, while low volume may suggest weak interest. Traders use volume indicators to confirm trends, identify reversals, and make informed entry and exit decisions. Analyzing volume alongside price action helps traders understand market sentiment and improve trading strategies.
How does volume influence price movements in day trading?
Volume significantly impacts price movements in day trading by indicating the strength or weakness of a price trend. High volume often confirms a price move, suggesting strong interest and momentum, while low volume can signal a lack of conviction, making the move susceptible to reversal. Traders use volume analysis to identify breakouts or breakdowns; if a stock breaks a resistance level with high volume, it’s likely to continue rising. Conversely, if a price decline occurs with low volume, it may not sustain. Thus, monitoring volume helps traders make informed decisions on entry and exit points.
Why is volume important for day trading strategies?
Volume is crucial for day trading strategies because it indicates the strength of price movements. High volume often signifies strong interest in a stock, confirming trends or reversals. It helps traders identify entry and exit points, as well as potential breakouts. Low volume can lead to false signals and increases the risk of slippage. By analyzing volume, traders can gauge market sentiment and make informed decisions swiftly.
What are the key indicators of volume in trading?
Key indicators of volume in trading include:
1. Volume Bars: Visual bars on charts showing the number of shares traded. Higher bars indicate increased activity.
2. Average Volume: The average number of shares traded over a set period. A spike above this average can signal strong interest.
3. On-Balance Volume (OBV): A cumulative volume line that adds or subtracts volume based on price movement, indicating buying or selling pressure.
4. Chaikin Money Flow (CMF): Combines price and volume to measure the buying and selling pressure over a specific timeframe.
5. Accumulation/Distribution Line: Indicates whether a stock is being accumulated (bought) or distributed (sold) based on volume and price movements.
6. Volume-Weighted Average Price (VWAP): Average price a security has traded at throughout the day, based on volume, helping traders gauge market trends.
These indicators help traders understand market sentiment and potential price movements.
How can I interpret volume spikes in day trading?
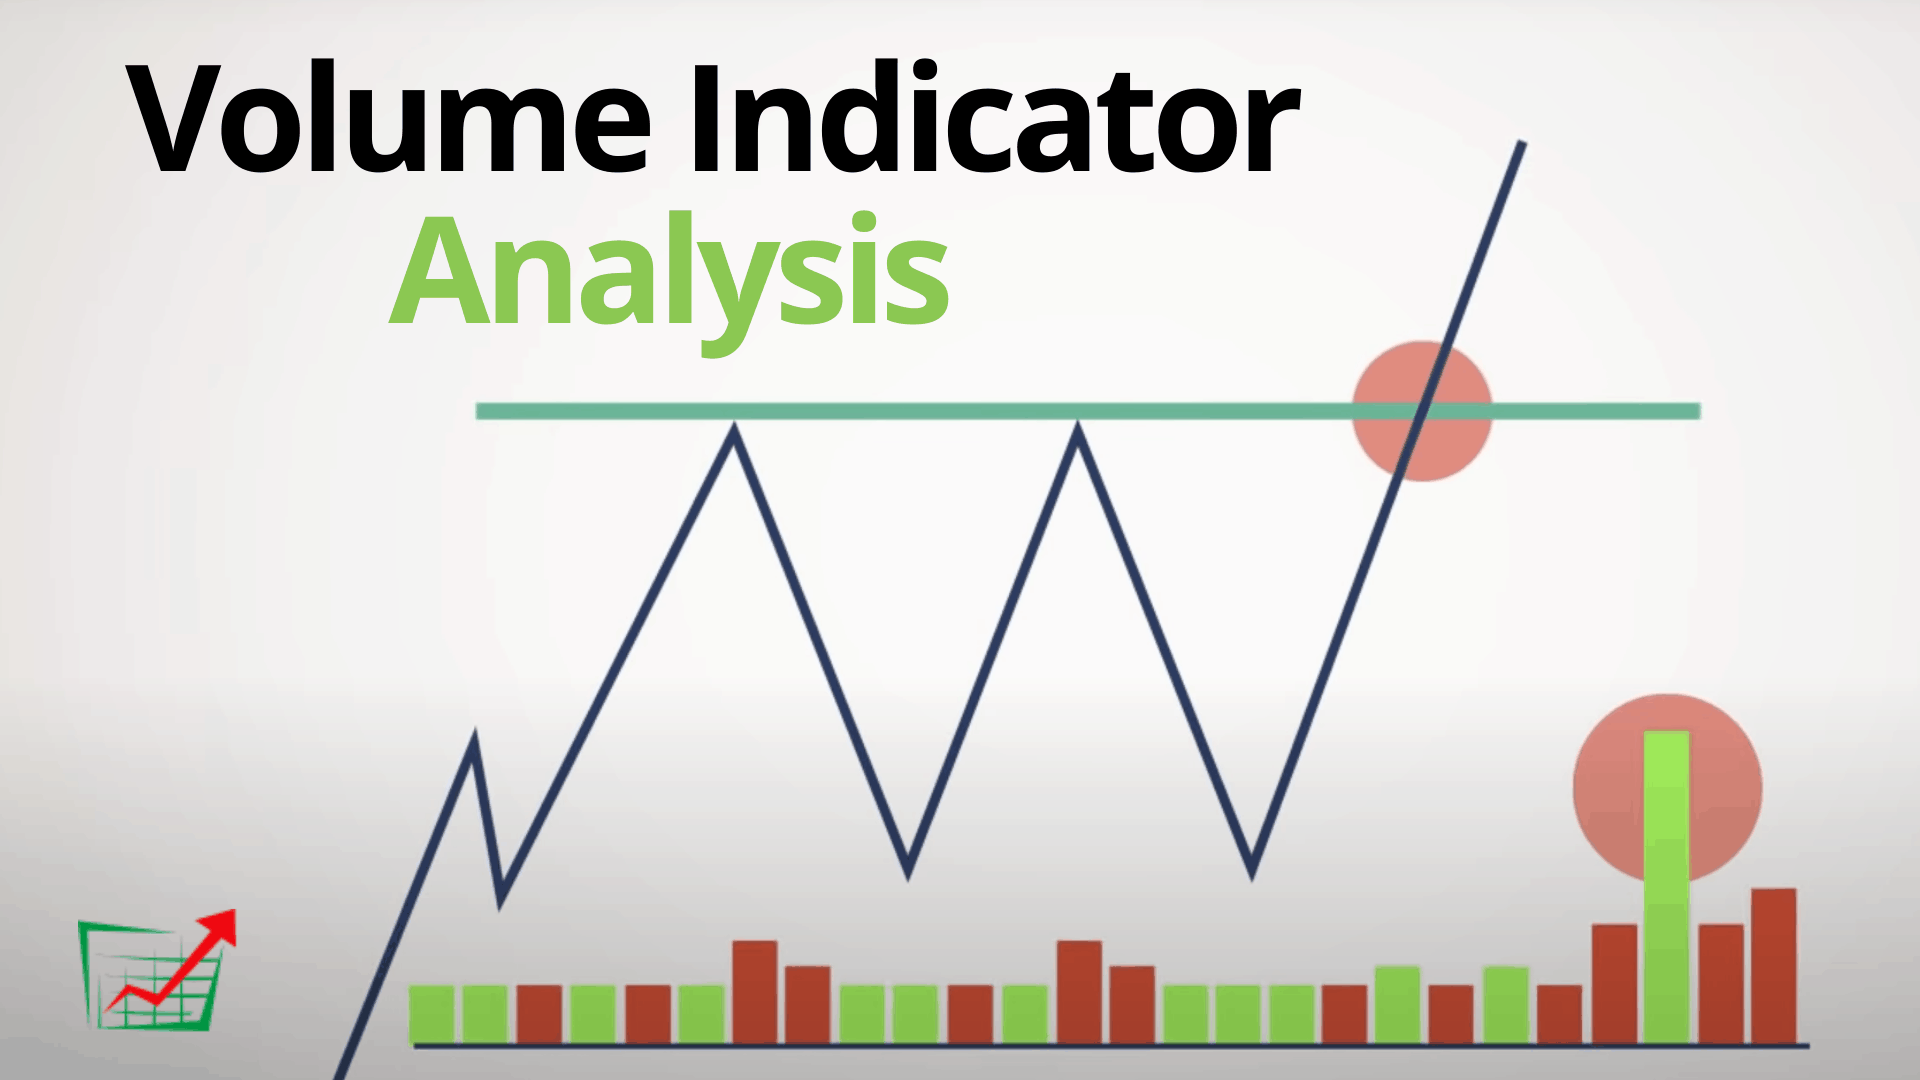
Volume spikes in day trading indicate increased buying or selling activity. A spike can signal potential price movements, either as a trend continuation or reversal.
When you see a volume spike alongside rising prices, it often suggests strong buying interest, confirming an uptrend. Conversely, if prices drop with high volume, it may indicate strong selling pressure, suggesting a downtrend.
Look for volume spikes at key support or resistance levels. If a spike occurs near a support level, it could imply a bounce back; near resistance, it might signal a breakout or rejection.
Always consider the context: news events or earnings reports can also drive volume changes. Use volume analysis in conjunction with price action for better trading decisions.
What role does volume play in confirming trends?
Volume confirms trends by indicating the strength of price movements. High volume during a price increase suggests strong buying interest, reinforcing an upward trend. Conversely, high volume during a price drop signals strong selling pressure, confirming a downward trend. Low volume can indicate weak trends or potential reversals, as it shows a lack of conviction among traders. Analyzing volume alongside price action helps traders make informed decisions about trend sustainability in day trading.
How do I use volume to identify potential reversals?
To use volume for identifying potential reversals in day trading, watch for significant changes in volume alongside price movements. A sudden spike in volume during a price decline may indicate a potential reversal, especially if the price moves up sharply afterward. Conversely, if volume increases during a price rise but the price starts to drop, it could signal a reversal. Look for patterns like volume divergence, where price trends up but volume decreases, suggesting weakening momentum. Always confirm with additional indicators for stronger signals.
What is the difference between high volume and low volume trading?
High volume trading refers to a large number of shares being bought and sold, indicating strong investor interest and often leading to more significant price movements. Low volume trading involves fewer shares traded, suggesting less interest and potentially more price stability but can also lead to greater volatility if trades occur. In day trading, high volume can provide better liquidity, making it easier to enter and exit positions, while low volume may result in slippage and difficulty executing trades at desired prices.
How can volume analysis improve my entry and exit points?
Volume analysis can enhance your entry and exit points by providing insights into market strength and potential price movements. High volume during an uptrend indicates strong buying interest, suggesting a good entry point. Conversely, high volume on a downtrend signals strong selling pressure, which may indicate an exit point. Low volume can suggest a lack of conviction, signaling caution. Additionally, volume spikes often precede significant price changes, helping you identify optimal moments to enter or exit trades.
What tools can I use for volume analysis in day trading?
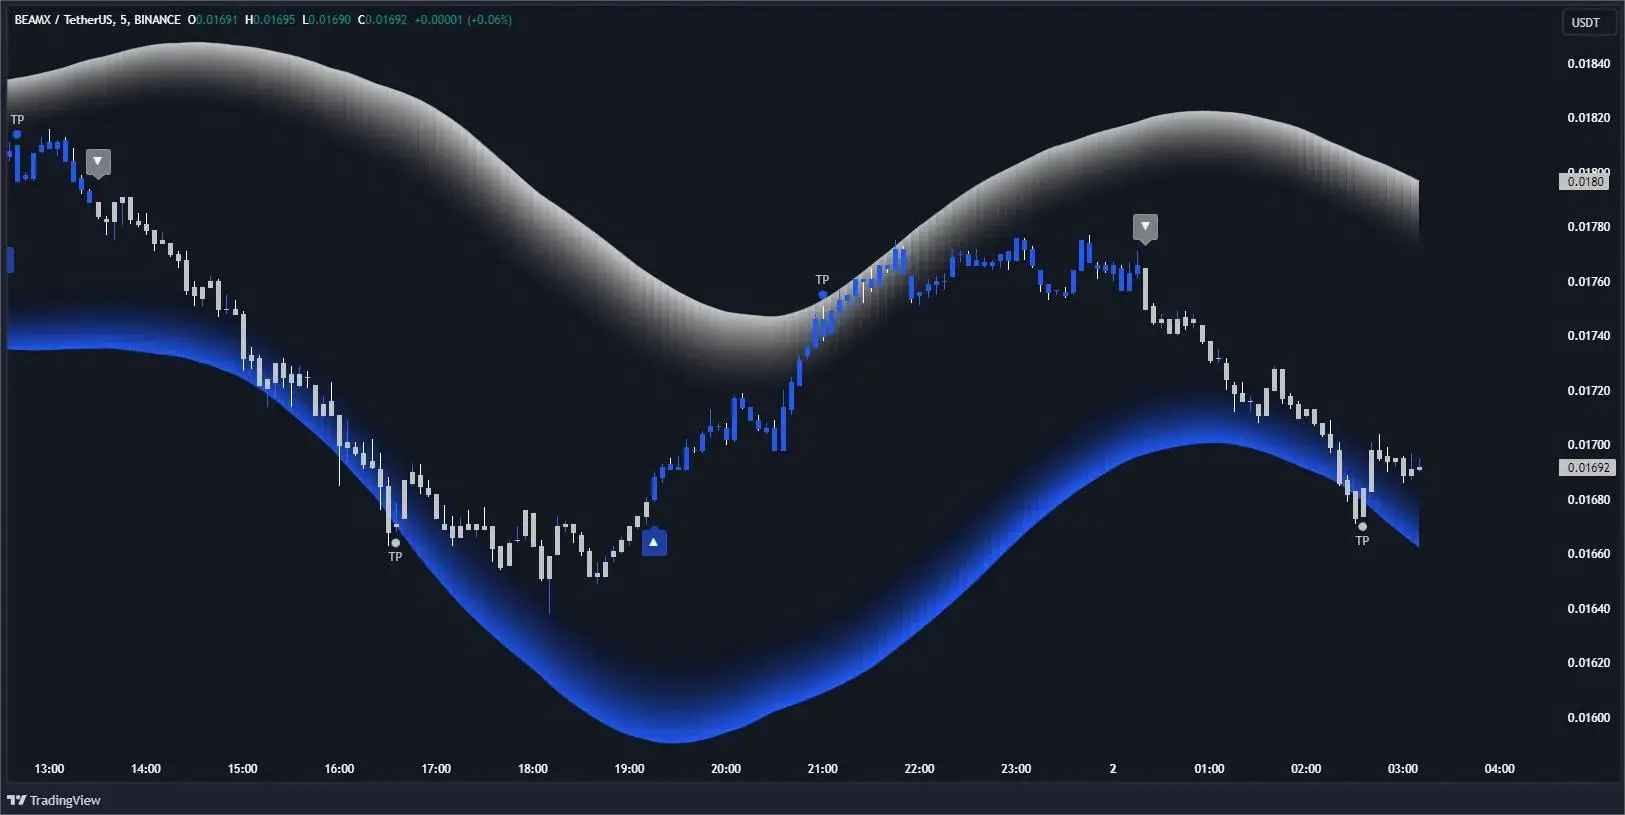
You can use several tools for volume analysis in day trading:
1. Trading Platforms: Most platforms like Thinkorswim, TradeStation, and MetaTrader have built-in volume indicators.
2. Volume Indicators: Tools like Volume Profile, On-Balance Volume (OBV), and Accumulation/Distribution Line help analyze volume trends.
3. Charting Software: Use software like TradingView or NinjaTrader for advanced volume charts and visual analysis.
4. Stock Scanners: Tools like Finviz and Trade Ideas allow you to filter stocks based on volume spikes and trends.
5. Technical Analysis Tools: Integrate volume analysis with other indicators like Moving Averages or RSI for better insights.
Choose tools that fit your trading style and preferences for effective volume analysis.
How does volume relate to liquidity in day trading?
Volume in day trading indicates the number of shares or contracts traded within a specific timeframe. Higher volume typically signals increased liquidity, meaning traders can buy or sell assets more easily without significantly affecting the price. This is crucial for day traders, as they rely on quick entry and exit points. Low volume can lead to wider spreads and slippage, making trades riskier. Thus, monitoring volume helps assess the liquidity and potential profitability of trades.
Learn about How Do Market Makers and Liquidity Providers Affect Day Trading?
What are common volume patterns to watch for in day trading?
Common volume patterns to watch for in day trading include:
1. Increased Volume on Breakouts: A surge in volume when a stock breaks through resistance indicates strong buying interest.
2. Volume Climax: High volume followed by a price reversal suggests exhaustion in the current trend.
3. Volume Divergence: When price moves in one direction but volume decreases, it may signal a potential reversal.
4. Accumulation Days: Increased volume on up days and low volume on down days indicates accumulation by smart money.
5. Distribution Days: High volume on down days can signal selling pressure and potential weakness in a stock.
Monitor these patterns to gauge market sentiment and make informed trading decisions.
Learn about Common Volume Patterns in Day Trading
How can I combine volume analysis with other technical indicators?
Combine volume analysis with other technical indicators by looking for confirmation signals. For instance, use moving averages alongside volume to identify trends—when price moves above a moving average with increased volume, it signals strong momentum. Apply the Relative Strength Index (RSI) to gauge overbought or oversold conditions alongside volume spikes; a rising volume with a high RSI can indicate a potential reversal. Also, consider using Bollinger Bands; when price touches the upper band with strong volume, it may signal a continuation of the trend. Always look for volume patterns to confirm signals from these indicators for more reliable trading decisions.
Learn about How to Combine Fundamental and Technical Analysis in Day Trading
What mistakes should I avoid when analyzing volume?
Avoid these mistakes when analyzing volume in day trading:
1. Ignoring Context: Always consider volume in relation to price action. High volume with price drops can indicate selling pressure, while high volume with price increases shows buying strength.
2. Focusing Solely on Volume: Don’t analyze volume in isolation. Look at other indicators like price trends and market sentiment for a more comprehensive view.
3. Neglecting Historical Averages: Compare current volume to historical averages for the stock to gauge whether it's significant.
4. Overreacting to Volume Spikes: Not every volume spike signals a trend change; assess whether it aligns with news or market events.
5. Misinterpreting Low Volume: Low volume doesn’t always mean lack of interest; it can indicate consolidation or a lack of volatility.
6. Forgetting to Adjust for Market Conditions: Volume can behave differently in volatile markets versus stable ones. Adjust your analysis accordingly.
7. Relying on Only One Timeframe: Analyze volume across multiple timeframes to understand short-term versus long-term trends.
Avoiding these mistakes will improve your volume analysis and help make better trading decisions.
How does news impact trading volume and price?
News significantly impacts trading volume and price by driving investor sentiment and behavior. Positive news often leads to increased buying activity, raising trading volume and pushing prices up. Conversely, negative news causes selling, resulting in higher volume and lower prices. Traders react quickly to news releases, which creates volatility and can amplify price movements. For day traders, leveraging news events can provide opportunities for quick profits or losses, making volume analysis crucial for decision-making.
Learn about How News Events Impact Day Trading Decisions
What are the best practices for incorporating volume analysis into my trading plan?
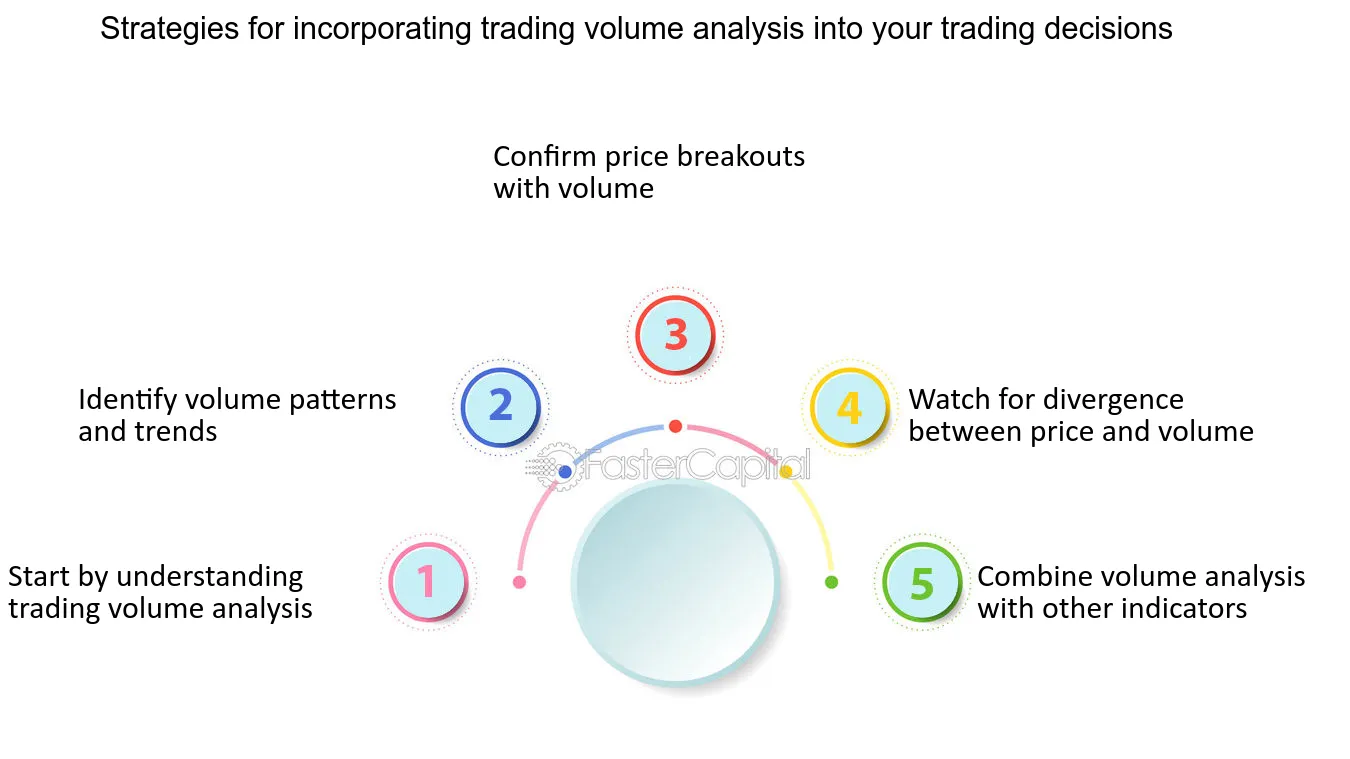
1. Use Volume with Price Action: Analyze volume alongside price movements. Look for high volume on breakouts or breakdowns to confirm trends.
2. Identify Patterns: Recognize volume patterns like spikes, surges, and declines. These can indicate potential reversals or continuations.
3. Set Volume Thresholds: Establish minimum volume levels for trades. This helps ensure liquidity and reduces slippage.
4. Combine with Technical Indicators: Integrate volume indicators like the On-Balance Volume (OBV) or Volume Moving Average to enhance your analysis.
5. Monitor News Events: Be aware of news releases that may impact volume. Increased activity often occurs around major announcements.
6. Adjust Position Sizing: Use volume analysis to inform your position size. Higher volume can justify larger trades due to increased confidence.
7. Backtest Strategies: Test your volume-based strategies on historical data to see how they perform under different market conditions.
8. Stay Disciplined: Stick to your trading plan. Avoid emotional decisions based on volume spikes without proper analysis.
Learn about Best Practices for Conducting Volume Analysis in Day Trading
Conclusion about Understanding Volume Analysis in Day Trading
Incorporating volume analysis into your day trading strategy is essential for making informed decisions. Understanding how volume influences price movements, confirms trends, and signals potential reversals can enhance your trading effectiveness. By recognizing key volume indicators and patterns, you can improve your entry and exit points, ultimately leading to more successful trades. Stay informed and utilize the tools available to integrate volume analysis into your approach for optimal results. DayTradingBusiness is here to support you in mastering these techniques for greater trading success.
Learn about The Role of Volume in Day Trading Chart Analysis