Did you know that the average day trader spends more time researching than actually trading? In this guide, we break down the essentials of day trading technical analysis tailored specifically for beginners. We’ll explore what technical analysis is, how to kickstart your trading journey, and the best indicators to watch. Learn to read candlestick charts, understand the significance of volume, and develop effective trading strategies. We'll also cover critical concepts like support and resistance, moving averages, and the role of trend lines. Plus, discover common pitfalls and risk management techniques, the best time frames for analysis, and tips for choosing the right broker. With insights from DayTradingBusiness, you’ll be well-equipped to navigate the exciting world of day trading.
What is technical analysis in day trading?
Technical analysis in day trading involves analyzing price charts and indicators to predict future price movements. Traders use tools like moving averages, volume analysis, and candlestick patterns to identify entry and exit points. The goal is to capitalize on short-term price fluctuations by making informed decisions based on historical data and market trends.
How do I start day trading as a beginner?
To start day trading as a beginner, follow these steps:
1. Educate Yourself: Learn the basics of technical analysis, including chart patterns, indicators, and trends.
2. Choose a Trading Platform: Select a reliable brokerage with a user-friendly interface and low fees.
3. Practice with a Demo Account: Use a demo account to practice trading without risking real money. This helps you get familiar with the platform and strategies.
4. Develop a Trading Plan: your goals, risk tolerance, and strategies. Specify entry and exit points for trades.
5. Start Small: Begin with a small investment to minimize risk. Gradually increase your position size as you gain confidence and experience.
6. Stay Informed: Keep up with market news and trends that can impact your trades.
7. Review and Adjust: Regularly analyze your trades to learn from mistakes and improve your strategy.
Focus on discipline and consistency to succeed in day trading.
What are the best technical indicators for day trading?
The best technical indicators for day trading include:
1. Moving Averages: Simple Moving Average (SMA) and Exponential Moving Average (EMA) help identify trends.
2. Relative Strength Index (RSI): Measures momentum and identifies overbought or oversold conditions.
3. Bollinger Bands: Show volatility and potential price reversals.
4. MACD (Moving Average Convergence Divergence): Indicates trend direction and momentum shifts.
5. Volume: Confirms trends and signals potential reversals based on trading activity.
These indicators can enhance your day trading strategy by providing clear signals for entry and exit points.
How do I read candlestick charts for day trading?
To read candlestick charts for day trading, focus on these key elements:
1. Understand the Candlestick Structure: Each candlestick shows four price points—open, high, low, and close. The body represents the open and close, while the wicks indicate the high and low.
2. Identify Patterns: Look for common patterns like doji (indecision), hammer (bullish reversal), and engulfing (strong reversal). These can signal potential market movements.
3. Analyze Color: A green (or white) candle indicates the price closed higher than it opened, while a red (or black) candle shows a drop.
4. Look for Trends: Assess the overall trend by observing the sequence of candles. Higher highs and higher lows indicate an uptrend; lower highs and lower lows indicate a downtrend.
5. Use Volume: Check volume alongside candlesticks. Increased volume during a price move suggests strength, while low volume indicates weakness.
6. Combine with Indicators: Use technical indicators like moving averages or RSI to confirm candlestick signals.
Practice consistently to improve your interpretation skills and make informed trading decisions.
What is the importance of volume in day trading?
Volume is crucial in day trading because it indicates the strength of a price movement. High volume suggests strong interest and can confirm trends, while low volume may signal weak moves or potential reversals. Day traders use volume to identify entry and exit points; spikes in volume can indicate breakout opportunities. Understanding volume helps traders avoid false signals, making it a key component of technical analysis.
How can I develop a day trading strategy using technical analysis?
To develop a day trading strategy using technical analysis, follow these steps:
1. Choose Your Market: Focus on stocks, forex, or commodities. Select a market that aligns with your interests and capital.
2. Select Time Frames: Use shorter time frames like 1-minute, 5-minute, or 15-minute charts for day trading. This helps identify quick entry and exit points.
3. Identify Key Indicators: Incorporate indicators like Moving Averages, RSI, MACD, and Bollinger Bands. These tools help assess trends, momentum, and volatility.
4. Establish Entry and Exit Rules: Define specific criteria for entering and exiting trades based on your chosen indicators. For example, buy when the price crosses above a moving average and sell when it crosses below.
5. Set Risk Management Parameters: Determine your risk tolerance. Use stop-loss orders to limit losses and position sizing to manage risk effectively.
6. Backtest Your Strategy: Test your strategy on historical data to evaluate its performance. Adjust based on results.
7. Practice with a Demo Account: Trade in a simulated environment to refine your strategy without financial risk.
8. Monitor and Adapt: Continuously analyze your trades and market conditions. Be ready to adjust your strategy as needed.
By following these steps, you can create a solid day trading strategy focused on technical analysis.
What are support and resistance levels in day trading?
Support and resistance levels in day trading are key price points where an asset tends to stop and reverse. Support is the price level where buying interest is strong enough to overcome selling pressure, often preventing the price from falling further. Resistance, on the other hand, is where selling interest is strong enough to overcome buying pressure, often preventing the price from rising. Traders use these levels to make buy or sell decisions, as they indicate potential entry or exit points in the market.
How do moving averages work in day trading?
Moving averages smooth out price data to identify trends in day trading. They calculate the average price over a specific period, helping traders see overall market direction. A short-term moving average reacts quickly to price changes, while a long-term moving average is slower and helps confirm the trend.
Traders often use two moving averages, like the 50-day and 200-day, to spot crossovers. A bullish signal occurs when the short-term average crosses above the long-term average, suggesting a buying opportunity. Conversely, a bearish signal happens when the short-term average crosses below the long-term average, indicating a potential sell.
In day trading, moving averages can also serve as dynamic support and resistance levels, guiding entry and exit points.
What is the role of trend lines in technical analysis?
Trend lines in technical analysis help identify the direction of a stock's price movement. They connect significant highs in a downtrend or lows in an uptrend, providing visual cues for potential support and resistance levels. Traders use trend lines to make informed decisions about entry and exit points, assess market momentum, and spot reversals. By analyzing the slope and breaks of trend lines, day traders can gauge the strength of a trend and adjust their strategies accordingly.
How can I use Fibonacci retracement in day trading?
To use Fibonacci retracement in day trading, first identify a significant price movement on your chart. Draw the Fibonacci levels from the low to the high in an uptrend or high to low in a downtrend. Look for key levels like 23.6%, 38.2%, 50%, 61.8%, and 76.4%.
When the price retraces to these levels, watch for potential reversal signals such as candlestick patterns or volume spikes. Enter trades near these levels with a stop-loss just beyond them to manage risk. Use these retracement levels to set profit targets as the price moves back toward the previous trend.
Learn about How to Use Fibonacci Retracement in Day Trading
What are the common mistakes beginners make in day trading?

Common mistakes beginners make in day trading include:
1. Lack of a Trading Plan: Not having a clear strategy can lead to impulsive decisions.
2. Overtrading: Trying to make too many trades can increase transaction costs and reduce focus.
3. Ignoring Risk Management: Failing to set stop-loss orders can result in significant losses.
4. Emotional Trading: Letting fear or greed drive decisions often leads to poor outcomes.
5. Inadequate Research: Not analyzing charts or market conditions can result in missed opportunities.
6. Chasing Losses: Trying to recover from losses quickly often leads to bigger mistakes.
7. Neglecting Technical Analysis: Beginners may overlook key indicators and patterns that inform trading strategies.
Learn about What Are Common Mistakes in Institutional Day Trading?
How do I manage risk while day trading?
To manage risk while day trading, follow these key strategies:
1. Set a Risk Limit: Never risk more than 1-2% of your trading capital on a single trade. This helps preserve your capital during losing streaks.
2. Use Stop-Loss Orders: Implement stop-loss orders to automatically exit trades at predetermined loss levels. This minimizes potential losses and protects your investment.
3. Diversify Your Trades: Avoid putting all your capital into one stock or sector. Spread your investments to reduce exposure to any single market event.
4. Maintain a Trading Journal: Track your trades, strategies, and outcomes. This helps identify patterns and areas for improvement to refine your approach.
5. Stay Informed: Keep up with market news and trends. Understanding external factors can help you anticipate price movements and make informed decisions.
6. Limit Leverage: Use leverage cautiously. High leverage can amplify losses, so consider lower leverage ratios to manage risk effectively.
7. Practice Discipline: Stick to your trading plan and avoid emotional decisions. Discipline is crucial for consistent risk management.
By implementing these strategies, you can effectively manage risk while engaging in day trading.
Learn about How Do Institutional Traders Manage Risk During Day Trading?
What are the best time frames for day trading analysis?
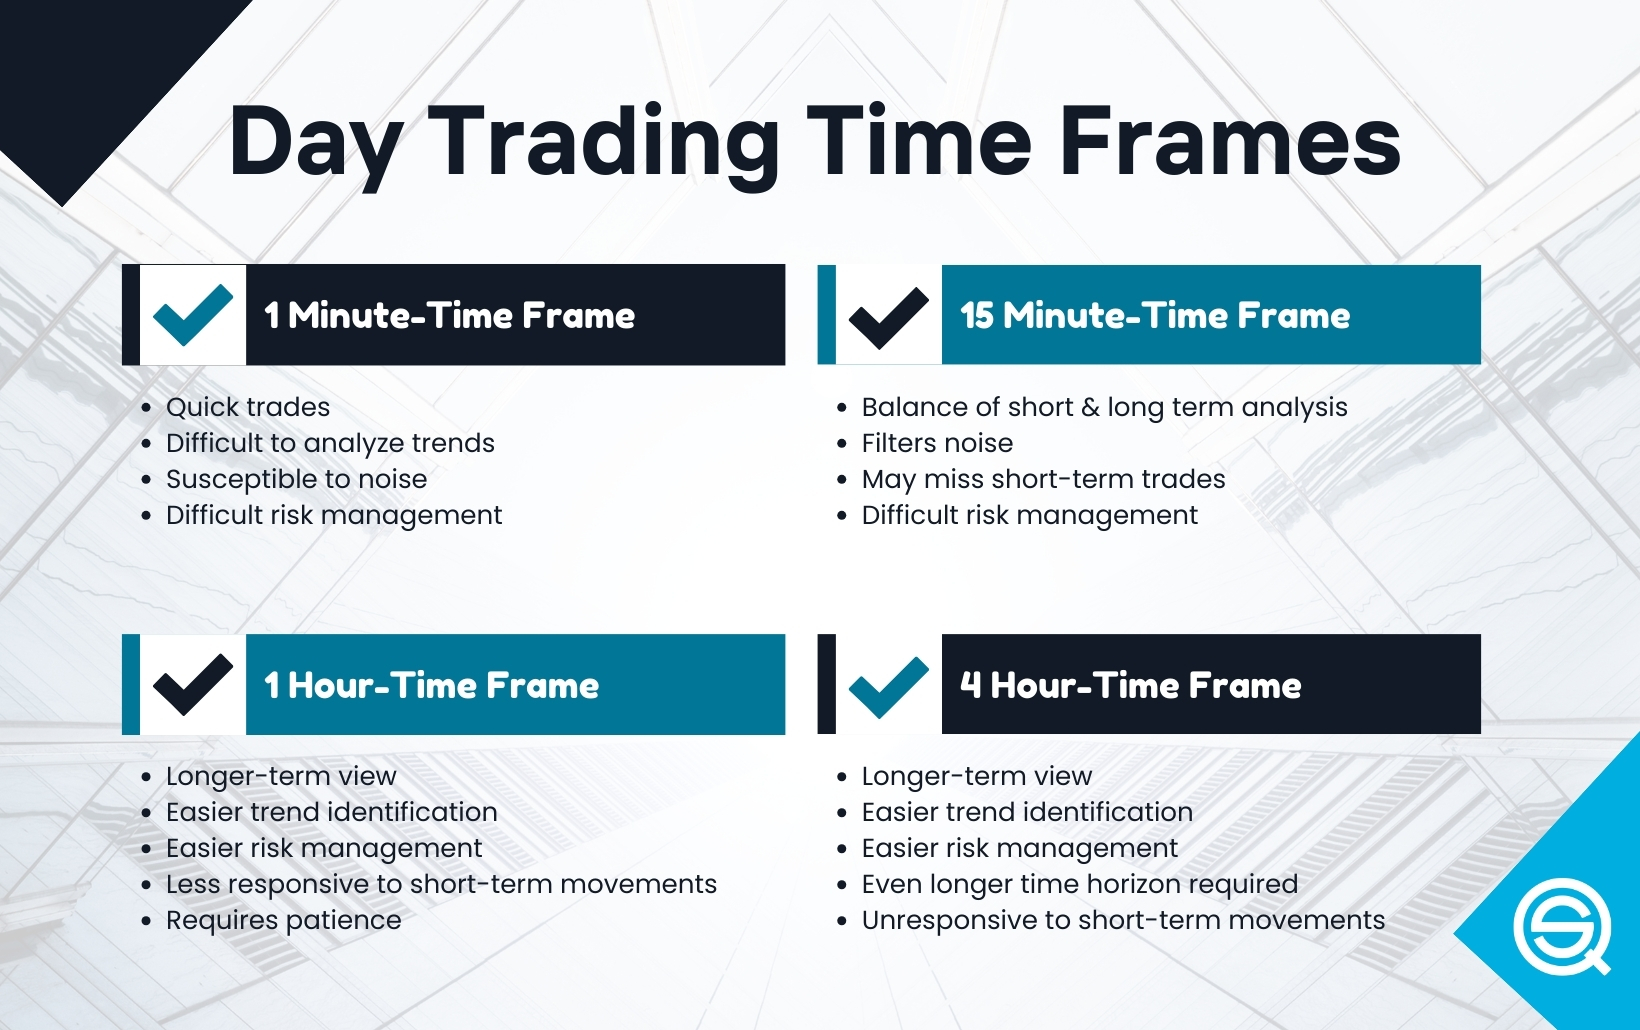
The best time frames for day trading analysis are typically 1-minute, 5-minute, and 15-minute charts. The 1-minute chart provides quick insights for scalping, while the 5-minute chart balances detail and broader trends. The 15-minute chart helps identify potential entry and exit points with more context. Combining these time frames can enhance your decision-making and improve your trades.
Learn about What Are the Best Tools for Day Trading Analysis?
How can I use oscillators in technical analysis for day trading?
Use oscillators in day trading by identifying overbought or oversold conditions. Common oscillators like the Relative Strength Index (RSI) and Stochastic Oscillator help spot potential reversal points.
1. RSI: Look for values above 70 (overbought) or below 30 (oversold). Enter trades when the RSI crosses back from these extremes.
2. Stochastic Oscillator: Focus on readings above 80 (overbought) and below 20 (oversold). Trade when the %K line crosses the %D line in these zones.
3. Divergence: Watch for divergence between price and the oscillator. If prices make new highs but the oscillator doesn’t, it may signal a reversal.
Combine these signals with other indicators for confirmation and set stop-loss orders to manage risk effectively.
Learn about How to Use Technical Analysis for Day Trading ETFs
What should I know about backtesting my day trading strategies?
Backtesting your day trading strategies involves testing them against historical data to evaluate their effectiveness. Focus on these key points:
1. Data Quality: Use reliable, clean historical data for accurate results.
2. Strategy Definition: Clearly define entry, exit, and risk management rules before testing.
3. Timeframe: Choose an appropriate timeframe that matches your trading style, whether it's intraday or multi-day.
4. Performance Metrics: Analyze key metrics like win rate, profit factor, and maximum drawdown to gauge performance.
5. Avoid Overfitting: Don’t tailor your strategy too closely to past data; it may not perform well in live markets.
6. Realistic Conditions: Simulate realistic trading conditions, including slippage and commissions.
7. Iterate and Improve: Use insights from backtesting to refine your strategy continually.
Incorporating these elements will help you build a robust day trading strategy.
Learn about Frequently Asked Questions About Day Trading Backtesting
How do I choose the right broker for day trading?
To choose the right broker for day trading, consider these key factors:
1. Commission and Fees: Look for low commissions and no hidden fees that can eat into your profits.
2. Trading Platform: Ensure the platform is user-friendly and offers the tools you need for technical analysis, like real-time charts and indicators.
3. Execution Speed: A broker with fast order execution is crucial for day trading to capitalize on quick price movements.
4. Market Access: Check if the broker provides access to the markets you want to trade, whether stocks, options, or forex.
5. Customer Support: Reliable support can help resolve issues quickly, so choose a broker with good customer service.
6. Regulation: Verify that the broker is regulated by a reputable authority to ensure your funds are safe.
Evaluate these aspects based on your specific day trading strategies and goals.
Learn about How to Choose a Day Trading Broker with Good Compliance Standards
Conclusion about Day Trading Technical Analysis for Beginners
In conclusion, mastering technical analysis is essential for any beginner in day trading. By understanding key concepts such as candlestick charts, support and resistance levels, and essential indicators, you can develop a robust trading strategy. Risk management and proper broker selection further enhance your trading journey. For comprehensive insights and personalized guidance, turn to DayTradingBusiness to elevate your trading skills and achieve your financial goals.
Learn about Day Trading Software for Technical Analysis
Sources:
- A Deep Neural-Network Based Stock Trading System Based on ...
- Information asymmetry and the profitability of technical analysis ...
- Predicting bitcoin returns using high-dimensional technical indicators
- Technical indicators for energy market trading - ScienceDirect
- Using genetic algorithms to find technical trading rules - ScienceDirect