Did you know that some traders think a "bull market" is when their pet bull starts acting friendly? In the world of day trading, understanding technical signals is crucial for making informed decisions. This article dives deep into the essence of technical signals, explaining what they are and how to identify them. Discover the most common indicators, including moving averages and volume indicators, and learn to interpret candlestick patterns effectively. We’ll explore the significance of support and resistance levels, the utility of the RSI, and the importance of backtesting. Additionally, we'll discuss the risks of relying solely on these signals and how market conditions can impact their reliability. Finally, find out how to combine various indicators and develop a robust trading strategy. Join us at DayTradingBusiness as we unravel the complexities of trading with technical signals!
What are technical signals in day trading?
Technical signals in day trading are indicators derived from price movements and trading volume. Common examples include moving averages, Relative Strength Index (RSI), MACD, and candlestick patterns. Traders use these signals to identify trends, potential reversals, and entry or exit points. For instance, a crossover in moving averages might signal a buying opportunity, while an RSI above 70 could indicate overbought conditions. Understanding these signals helps traders make informed decisions quickly.
How do I identify key technical signals for trading?
To identify key technical signals for trading, focus on these steps:
1. Use Moving Averages: Look for crossovers, like when a short-term moving average crosses above a long-term average, indicating a potential buy signal.
2. Examine RSI: The Relative Strength Index (RSI) can signal overbought (above 70) or oversold (below 30) conditions, helping you determine entry or exit points.
3. Analyze Volume: Increased volume during price movements confirms trends. A price rise on high volume is a strong buy signal.
4. Identify Support and Resistance Levels: Look for price levels where the stock historically reverses, helping you gauge potential breakout or breakdown points.
5. Candlestick Patterns: Recognize patterns like dojis or engulfing candles for insights into market sentiment, which can inform your trading decisions.
6. MACD: Monitor the Moving Average Convergence Divergence for momentum changes; a crossover can signal buy or sell opportunities.
Focus on these signals to make informed trading decisions.
What are the most common indicators used in day trading?
The most common indicators used in day trading include moving averages, Relative Strength Index (RSI), Bollinger Bands, and MACD (Moving Average Convergence Divergence). Moving averages help identify trends, while RSI indicates overbought or oversold conditions. Bollinger Bands show volatility and potential price reversals, and MACD provides signals for buy or sell opportunities based on momentum shifts. Traders often combine these indicators to make informed decisions.
How can I use moving averages for day trading signals?
To use moving averages for day trading signals, follow these steps:
1. Select the Type: Choose between simple moving averages (SMA) or exponential moving averages (EMA). EMAs react faster to price changes, making them popular for day trading.
2. Set Time Frames: Use short-term moving averages (like the 5 or 10-period) for entry and exit signals, combined with longer-term averages (such as the 20 or 50-period) to determine the overall trend.
3. Identify Crossover Signals: Look for buy signals when a short-term moving average crosses above a long-term moving average (bullish crossover) and sell signals when it crosses below (bearish crossover).
4. Confirm with Volume: Ensure that crossovers are confirmed by increased trading volume for stronger signals.
5. Set Stop-Loss Orders: Use moving averages as dynamic support and resistance levels to place stop-loss orders, helping to manage risk effectively.
6. Adjust for Volatility: Consider adjusting moving average periods based on market volatility; faster averages may be more effective in volatile conditions.
Implement these strategies to enhance your day trading decisions using moving averages.
What role do volume indicators play in technical analysis?
Volume indicators are crucial in technical analysis as they provide insights into the strength or weakness of a price movement. High volume often confirms a trend, suggesting that the price movement is supported by significant market interest. Conversely, low volume can indicate a lack of conviction, making price moves less reliable. Day traders use volume indicators to identify potential reversals, breakouts, and continuation patterns, helping them make informed trading decisions. For example, a sudden price increase accompanied by high volume may signal a strong buying interest, prompting traders to enter a position.
How do I interpret candlestick patterns for trading decisions?

To interpret candlestick patterns for trading decisions, focus on the shape, color, and context of each candle. Bullish patterns like the hammer or engulfing indicate potential upward movement, while bearish patterns like the shooting star or dark cloud cover suggest possible declines. Look for confirmation with subsequent candles before making trades. Consider the overall trend and volume to enhance reliability. Use key patterns in conjunction with support and resistance levels for better decision-making.
What is the significance of support and resistance levels?
Support and resistance levels are crucial for day trading as they indicate where prices tend to stop and reverse. Support is a price level where buying interest is strong enough to overcome selling pressure, while resistance is where selling interest prevails over buying. Identifying these levels helps traders make informed decisions about entry and exit points, manage risk, and set stop-loss orders. Recognizing breakouts or reversals at these levels can signal potential trading opportunities, enhancing overall strategy effectiveness.
How can I use RSI for day trading signals?
To use RSI for day trading signals, follow these steps:
1. Identify Overbought/Oversold Levels: Look for RSI readings above 70 (overbought) or below 30 (oversold). These levels indicate potential reversals.
2. Divergence Analysis: Check for divergence between RSI and price. For example, if prices are making new highs while RSI is declining, it may signal a reversal.
3. Trend Confirmation: Use RSI in conjunction with other indicators. For instance, if RSI is rising while prices are above a moving average, it confirms a bullish trend.
4. Entry and Exit Points: Consider buying when the RSI crosses above 30 and selling when it crosses below 70. Adjust based on market conditions.
5. Set Stop-Loss Orders: Protect your capital by placing stop-loss orders below recent lows for long positions or above recent highs for short positions.
By applying these strategies, you can effectively use RSI to generate actionable day trading signals.
What are the best technical signals for short-term trades?
The best technical signals for short-term trades include:
1. Moving Averages: Use short-term moving averages (like the 10-day or 20-day) to identify trends and potential entry/exit points.
2. Relative Strength Index (RSI): An RSI above 70 indicates overbought conditions, while below 30 suggests oversold. Look for reversals around these levels.
3. MACD (Moving Average Convergence Divergence): Watch for crossovers; a bullish crossover can signal a buy, while a bearish crossover indicates a sell.
4. Bollinger Bands: Price touching the lower band may indicate a buying opportunity, while touching the upper band could signal a selling point.
5. Volume: High trading volume during price movements confirms the strength of a trend. Look for spikes in volume for entry signals.
6. Candlestick Patterns: Patterns like hammers or engulfing candles can signal potential reversals.
Combine these signals for more reliable short-term trading decisions.
How do trend lines help in making trading decisions?
Trend lines help in making trading decisions by visually representing price direction and identifying support and resistance levels. When prices touch a trend line, it can signal potential entry or exit points. Upward trend lines indicate bullish momentum, suggesting buying opportunities, while downward trend lines highlight bearish momentum, indicating selling points. Breakouts above or below these lines can trigger trades based on momentum shifts. Overall, trend lines simplify market analysis, making it easier to spot trends and make informed decisions in day trading.
Learn about How to Use Trend Lines in Day Trading Charts
What is the importance of backtesting technical signals?
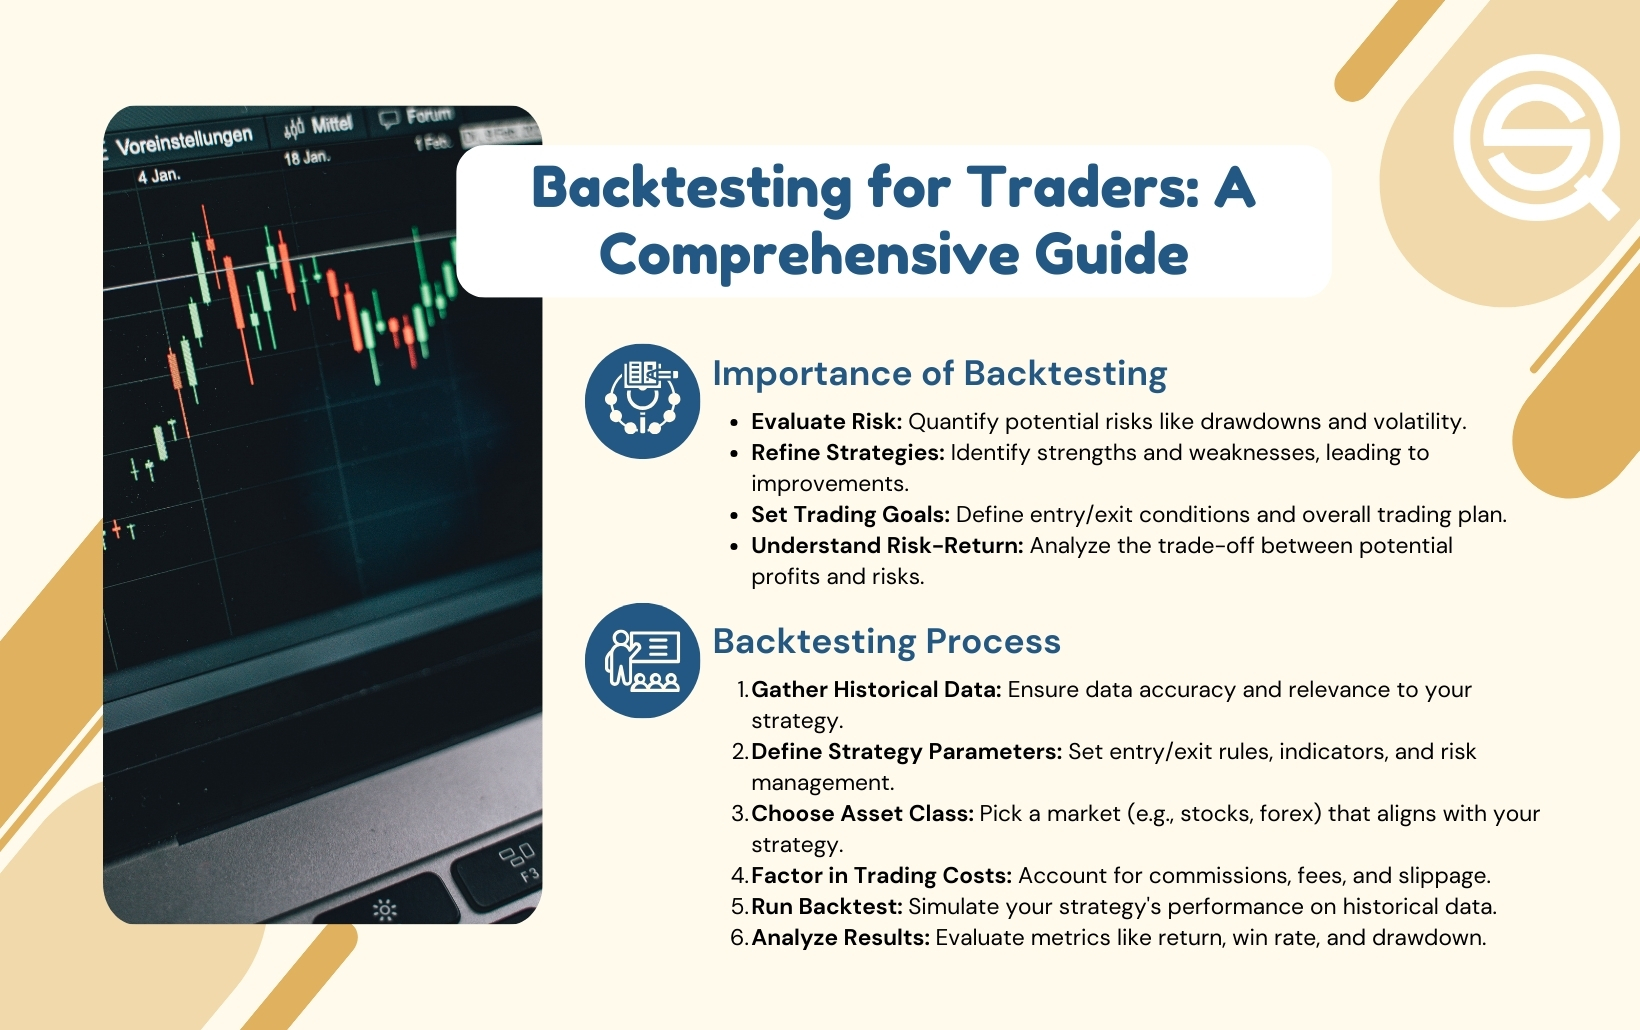
Backtesting technical signals is crucial for validating trading strategies. It helps traders assess how well a signal would have performed in the past, identifying strengths and weaknesses. This process builds confidence in the strategy, allowing for informed decision-making in day trading. Additionally, backtesting reveals potential risks and helps optimize entry and exit points, ultimately improving overall trading performance.
How can I combine multiple indicators for better trading results?
To combine multiple indicators for better trading results, start by selecting indicators that serve different purposes. For example, use a trend indicator like the moving average to identify the overall direction, a momentum indicator like the RSI to gauge strength, and a volatility indicator like the Bollinger Bands to assess price fluctuations.
Once you've chosen your indicators, look for confluence—where multiple signals align. For instance, if a stock is above a moving average (trend), the RSI is above 50 (momentum), and the price is near the lower Bollinger Band (volatility), that’s a strong buy signal.
Backtest your strategy to ensure it works in various market conditions. Adjust your indicators based on the asset you’re trading and stay disciplined in your approach. This combination enhances your decision-making and can lead to improved trading outcomes.
What are the risks of relying solely on technical signals?
Relying solely on technical signals can lead to several risks. First, it may cause you to overlook fundamental factors like news events or earnings reports that can significantly impact prices. Second, technical signals can produce false positives, leading to poor entry or exit points. Third, market conditions can change rapidly, rendering previous signals obsolete. Lastly, over-reliance on indicators can foster a mechanical trading mindset, disregarding the need for critical thinking and adaptability. Balancing technical signals with broader market analysis is crucial for informed day trading decisions.
How do market conditions affect the reliability of technical signals?

Market conditions significantly impact the reliability of technical signals. In volatile markets, signals may generate false positives due to rapid price swings. In contrast, stable markets often yield clearer trends, making signals more reliable. During news events or earnings releases, technical signals can become less trustworthy as price movements may not reflect underlying trends. It's crucial to consider market context, volume, and sentiment alongside technical indicators to make informed day trading decisions.
Learn about How Market Conditions Affect HFT Strategies
What tools can I use to analyze technical signals effectively?
You can use tools like TradingView for charting and technical analysis, MetaTrader for forex and CFDs, and ThinkorSwim for advanced trading strategies. Additionally, consider using StockCharts for customizable indicators and TrendSpider for automated technical analysis. Each platform offers features like real-time data, backtesting, and a variety of technical indicators to help you interpret signals effectively.
How can I develop a trading strategy based on technical signals?
To develop a trading strategy based on technical signals, follow these steps:
1. Choose Indicators: Select key technical indicators like moving averages, RSI, MACD, or Bollinger Bands that suit your trading style.
2. Define Entry and Exit Points: Establish clear rules for entering and exiting trades based on signals from your chosen indicators. For example, buy when the short-term moving average crosses above the long-term moving average.
3. Set Risk Management Rules: Determine how much capital you’re willing to risk per trade. Use stop-loss orders to limit potential losses.
4. Backtest Your Strategy: Test your strategy on historical data to evaluate its performance. Adjust your rules based on results.
5. Monitor Market Conditions: Stay aware of market trends and conditions that can affect your signals. Adapt your strategy as needed.
6. Keep a Trading Journal: Record your trades, including the reasoning behind each decision. Review regularly to improve your strategy.
7. Practice and Refine: Start with a demo account to practice without risk. Refine your approach based on your experiences.
By focusing on these steps, you can create a robust trading strategy that effectively uses technical signals.
Learn about How to Develop a Technical Analysis Trading Plan
Conclusion about Interpreting Technical Signals for Day Trading Decisions
In conclusion, mastering technical signals is essential for informed day trading decisions. By understanding key indicators, such as moving averages, volume, and candlestick patterns, traders can enhance their strategies and improve outcomes. It's crucial to combine these tools, consider market conditions, and backtest strategies to mitigate risks. For those seeking deeper insights and guidance, DayTradingBusiness is here to support your trading journey.
Learn about Interpreting Day Trading Indicator Signals