Did you know that the average day trader spends more time analyzing charts than most people spend deciding what to have for breakfast? Understanding market data is crucial for successful day trading, and this article dives deep into the essentials. We’ll clarify what market data is, how to read candlestick charts, and identify key indicators. You'll learn effective volume analysis, the importance of price action, and how trends influence your decisions. Discover support and resistance levels, the role of moving averages, and how news events shape market sentiment. Plus, we provide insights on historical data usage, common pitfalls, and strategies to enhance your analysis skills. With the guidance from DayTradingBusiness, you’ll be well-equipped to create a robust day trading analysis plan.
What is market data in day trading?
Market data in day trading refers to real-time information about stock prices, trading volumes, and other relevant metrics. This data helps traders analyze price movements, identify trends, and make informed decisions. Key components include bid-ask spreads, historical price charts, and order book data. Understanding this information allows traders to execute strategies effectively and capitalize on short-term market fluctuations.
How do I read candlestick charts for day trading?
To read candlestick charts for day trading, start by understanding the components of a candlestick: the body represents the opening and closing prices, while the wicks show the high and low prices for the period. A filled or red body indicates a closing price lower than the opening, while a hollow or green body means the closing price is higher.
Look for patterns like dojis, hammers, or engulfing candles, which signal potential reversals or continuations. Analyze the volume associated with these candles; higher volume often confirms the strength of a price move.
Use support and resistance levels to guide your trades. If a candle closes above resistance, it may indicate a buy opportunity; conversely, a close below support could signal a sell. Always combine candlestick analysis with other indicators for a more robust trading strategy.
What are key indicators in market data analysis?
Key indicators in market data analysis for day trading include:
1. Volume: Measures the number of shares traded, indicating market activity and liquidity.
2. Price Action: Observing price movements helps identify trends and reversals.
3. Moving Averages: Simple and exponential moving averages smooth price data to identify trends.
4. Relative Strength Index (RSI): Assesses whether an asset is overbought or oversold, aiding in entry and exit decisions.
5. Bollinger Bands: Show volatility and price levels, helping to identify potential breakouts or reversals.
6. MACD (Moving Average Convergence Divergence): Signals trend changes and momentum.
7. Support and Resistance Levels: Key price points where the market tends to reverse or consolidate.
Use these indicators to inform your day trading strategy and make data-driven decisions.
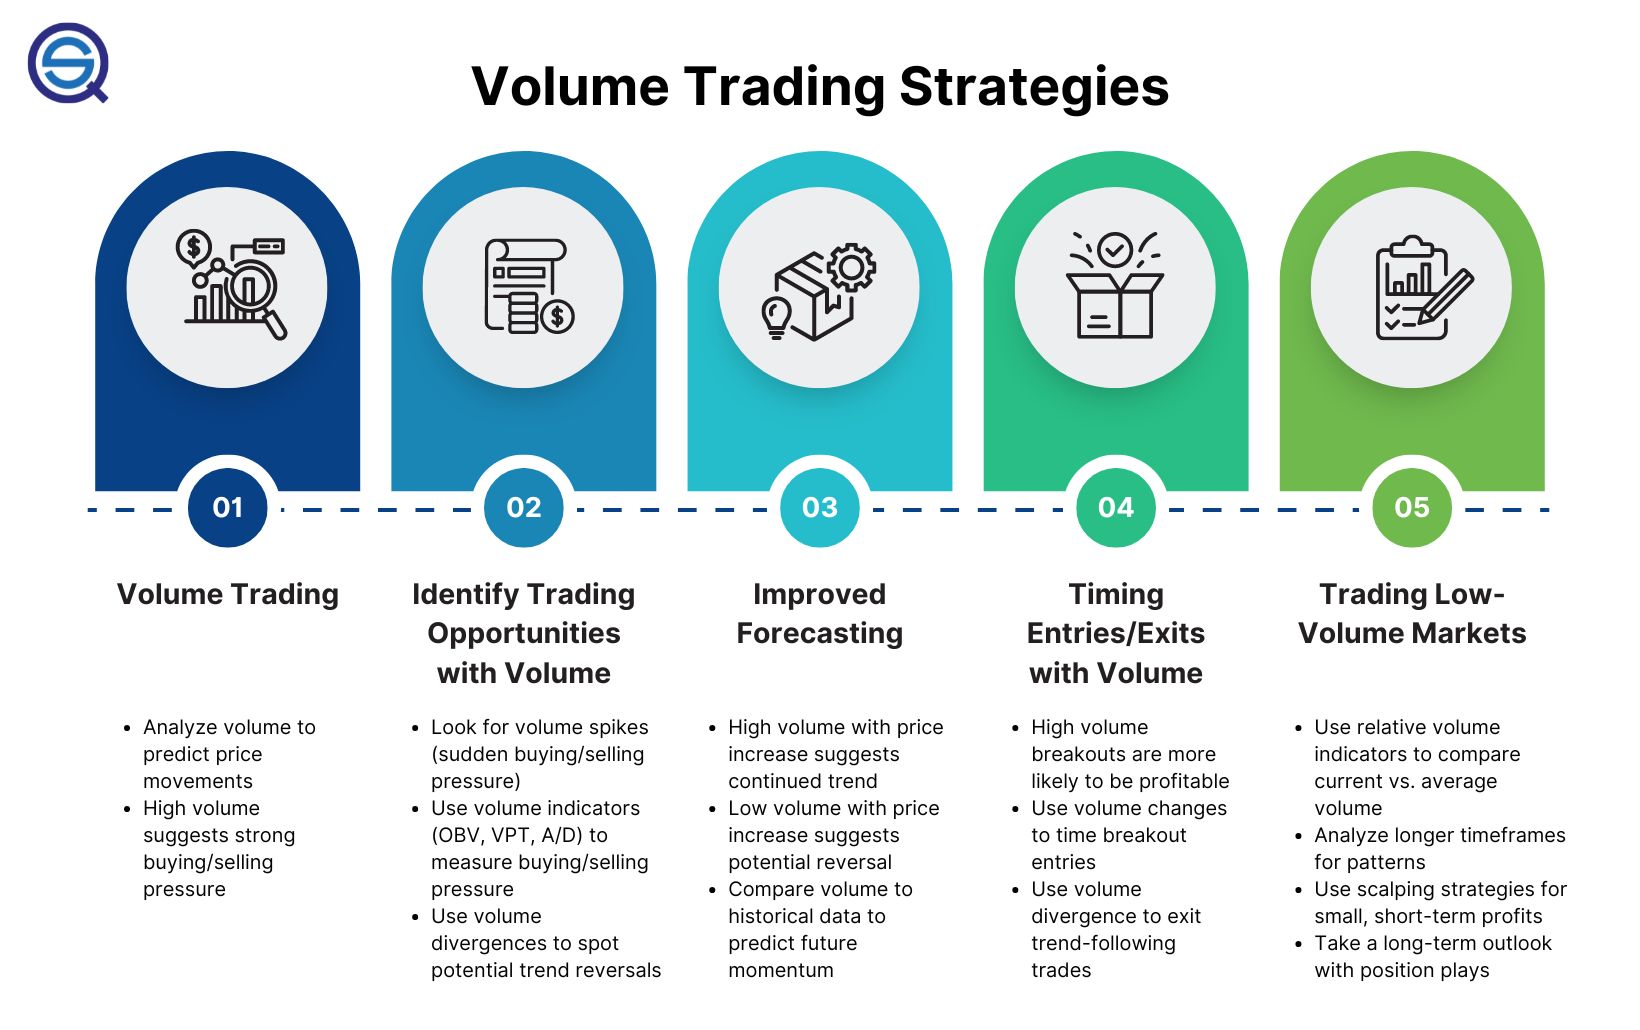
How can I analyze volume data effectively?
To analyze volume data effectively for day trading, start by observing volume trends alongside price movements. Look for spikes in volume that coincide with significant price changes; this indicates strong market interest. Use volume indicators like the On-Balance Volume (OBV) or Volume Moving Averages to identify trends. Compare current volume against historical averages to gauge whether the market is bullish or bearish. Pay attention to volume during key price levels like support and resistance; increased volume at these points can signal potential reversals or breakouts. Lastly, combine volume analysis with other technical indicators for a more comprehensive view.
What is the significance of price action in day trading?
Price action in day trading is crucial because it reflects real-time market sentiment and helps traders make quick decisions. By analyzing price movements, traders can identify trends, support and resistance levels, and potential entry and exit points. Understanding price action allows for better risk management and enhances the ability to spot trading opportunities without relying heavily on indicators. It’s about reading the market’s behavior and reacting swiftly to changes, which is essential for success in day trading.
How do trends affect market data interpretation?
Trends provide critical context for interpreting market data in day trading. They help identify the overall direction of price movement, allowing traders to make informed decisions. For instance, an upward trend signals potential buying opportunities, while a downward trend may indicate selling pressure. Analyzing trends alongside volume can reveal the strength of a price move, enhancing market data interpretation. Recognizing trend patterns, like support and resistance levels, further aids in predicting future price action. This alignment of trends with market data is essential for effective day trading strategies.
What are support and resistance levels in day trading?
Support levels are price points where a stock tends to stop falling and may bounce back up, indicating buying interest. Resistance levels are where a stock typically stops rising and may reverse downward, reflecting selling pressure. Day traders use these levels to make decisions about entry and exit points, identifying potential trades based on price action around these key areas.
How do I use moving averages for day trading analysis?
To use moving averages for day trading analysis, start by choosing the right time frames, typically short-term moving averages like the 5-day and 10-day. Monitor price action in relation to these averages. When the price crosses above a moving average, it signals a potential buy opportunity; crossing below suggests a sell. Look for convergence and divergence with price trends—convergence indicates strength, while divergence can signal a reversal. Use moving average crossovers, where a shorter moving average crosses a longer one, to identify entry and exit points. Always combine this with other indicators for confirmation to enhance your trading strategy.
What role do news events play in market data interpretation?
News events significantly impact market data interpretation in day trading. They can trigger volatility, influencing price movements and trader sentiment. Positive news often leads to bullish trends, while negative news can result in bearish reactions. Traders analyze news events to anticipate market reactions, adjust strategies, and identify entry or exit points. Understanding the context and timing of news helps in interpreting price spikes or drops, making it crucial for effective day trading analysis.
How can I identify market patterns for day trading?
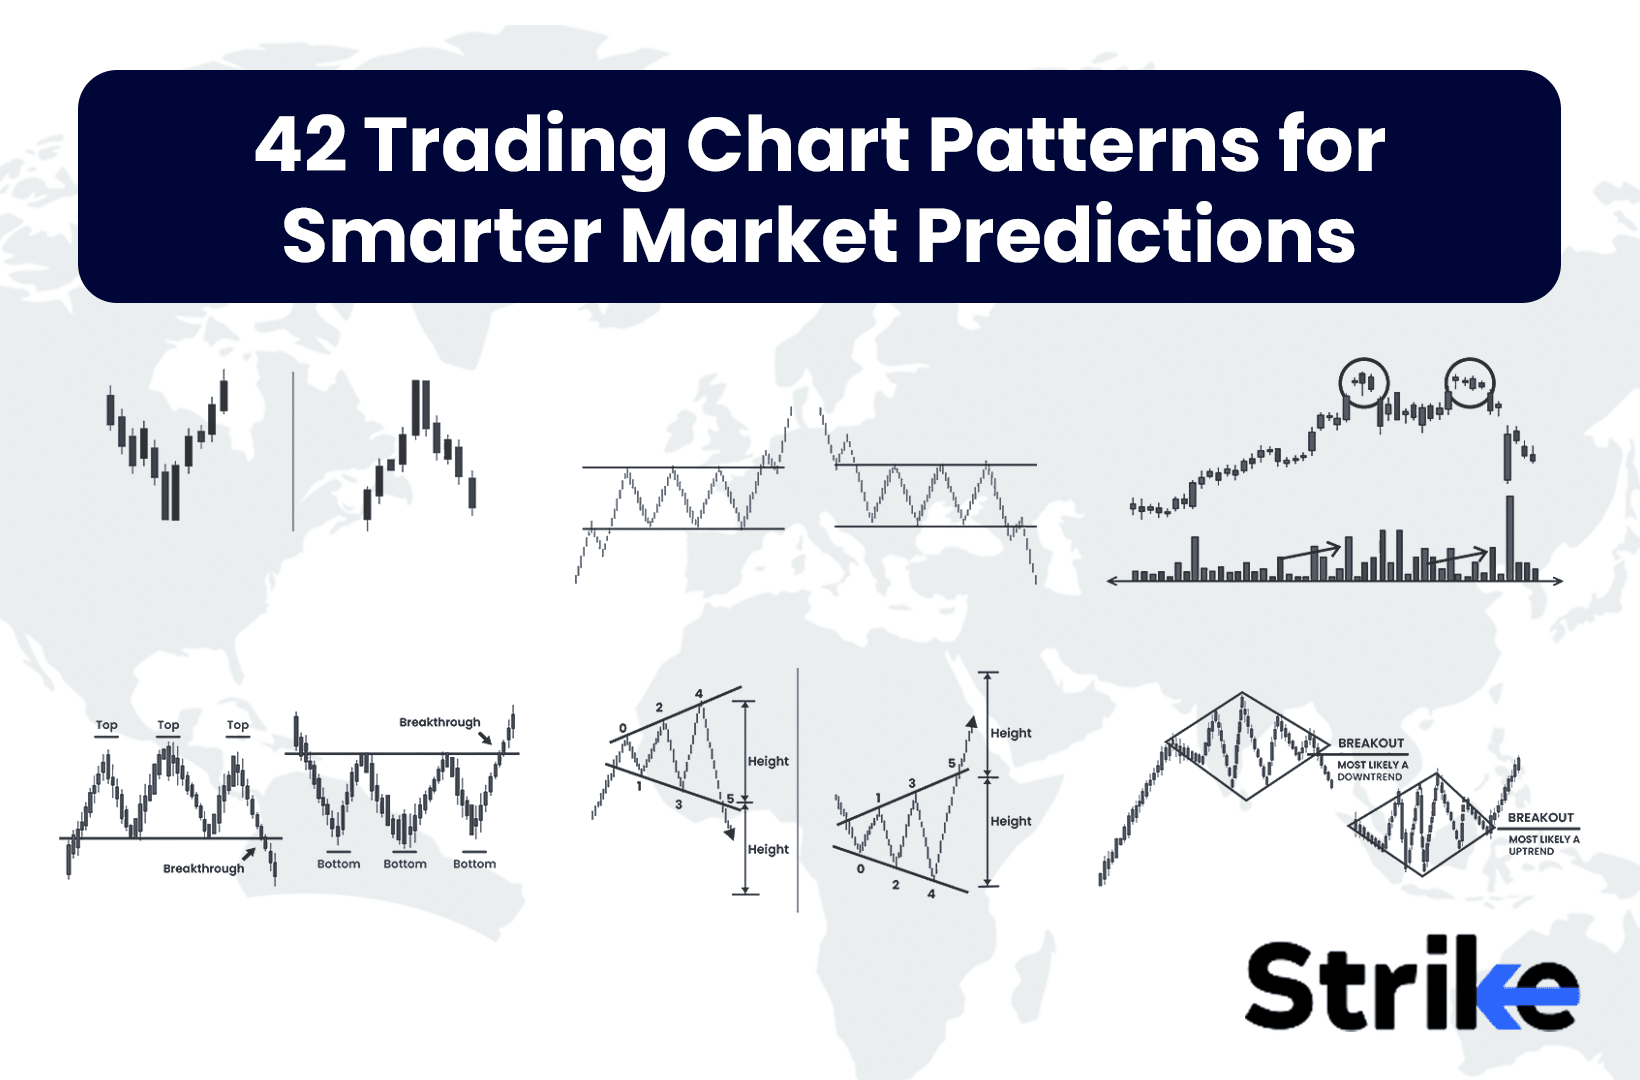
To identify market patterns for day trading, start by analyzing price charts using candlestick patterns to spot trends. Use technical indicators like moving averages, RSI, and MACD to gauge momentum and potential reversals. Look for support and resistance levels to understand where prices might bounce or break. Monitor volume spikes to confirm the strength of a pattern. Finally, stay updated on news and economic events that could influence market behavior.
Learn about How Do Market Makers and Liquidity Providers Affect Day Trading?
What tools can I use to analyze market data?
You can use several tools to analyze market data for day trading analysis:
1. Trading Platforms: Tools like MetaTrader, Thinkorswim, and TradeStation offer advanced charting and analysis features.
2. Technical Analysis Software: Programs like TradingView and StockCharts provide extensive charting options and indicators.
3. Market Scanners: Tools such as Finviz and Trade Ideas help you identify stocks based on specific criteria.
4. Economic Calendars: Websites like Forex Factory and Investing.com track economic events that can impact market movements.
5. News Aggregators: Services like Bloomberg and CNBC keep you updated on market news and trends.
6. Backtesting Software: Tools like Amibroker allow you to test trading strategies against historical data.
Choose the ones that best fit your trading style and needs.
How do I interpret market sentiment in day trading?
To interpret market sentiment in day trading, analyze price movements, volume, and news. Look for patterns in stock charts, paying attention to spikes in volume that may indicate strong sentiment shifts. Use indicators like the Relative Strength Index (RSI) to gauge overbought or oversold conditions. Monitor social media and news outlets for breaking information that could influence trader emotions. Lastly, observe market breadth; a broad rally suggests positive sentiment, while narrow participation may indicate caution.
Learn about How Do Market Makers and Liquidity Providers Affect Day Trading?
How can I use historical data for future trading strategies?
Analyze historical data by identifying patterns, trends, and key price levels. Use tools like moving averages and support/resistance indicators to spot potential trade setups. Backtest your strategies on past market conditions to assess their effectiveness. Incorporate volume analysis to gauge market strength. Adjust your strategies based on historical volatility and market behavior to improve future trading decisions.
Learn about How to Use Historical Data in Day Trading Analysis
What are the common mistakes in interpreting market data?
Common mistakes in interpreting market data for day trading include:
1. Ignoring Context: Focusing solely on numbers without considering market conditions can lead to misinterpretations.
2. Overreacting to Noise: Traders often react to short-term fluctuations instead of analyzing broader trends.
3. Neglecting Volume: Low trading volume can distort price movements, making them unreliable signals.
4. Confirmation Bias: Seeking only data that supports existing beliefs while ignoring contradictory information can skew analysis.
5. Misreading Indicators: Relying too heavily on technical indicators without understanding their limitations can lead to poor decisions.
6. Failing to Adapt: Sticking to outdated strategies despite changing market dynamics can result in missed opportunities or losses.
7. Not Using Multiple Data Sources: Relying on a single source of market data can create an incomplete picture.
Avoiding these mistakes helps improve market data interpretation for more effective day trading.
How do I create a day trading analysis plan?
To create a day trading analysis plan, start by defining your trading goals, including profit targets and risk tolerance. Identify the market data you’ll analyze, such as price charts, volume, and trend indicators. Develop a consistent method for interpreting price action, focusing on patterns like support and resistance levels.
Incorporate technical indicators like moving averages, RSI, or MACD to inform your trades. Set clear entry and exit rules based on your analysis. Schedule regular review sessions to evaluate your trades and refine your strategy. Finally, document your findings and adjustments to improve your approach over time.
Learn about How to Create a Day Trading Analysis Checklist
What strategies can improve my market data interpretation skills?
1. Practice Chart Analysis: Regularly analyze historical price charts to identify patterns and trends. Use tools like candlestick patterns and moving averages to enhance your understanding.
2. Stay Updated on News: Follow financial news and economic indicators that impact market movements. Understanding the context behind data can improve your interpretation.
3. Use Technical Indicators: Familiarize yourself with indicators like RSI, MACD, and Bollinger Bands. These tools help clarify market sentiment and potential price movements.
4. Simulate Trading: Engage in paper trading to apply your interpretations in a risk-free environment. This builds confidence in your analysis skills.
5. Join Trading Communities: Participate in forums or groups where traders share insights and strategies. Learning from others can broaden your perspective on data interpretation.
6. Reflect on Past Trades: Analyze your previous trades to understand what worked and what didn’t. This reflection sharpens your ability to interpret market data effectively.
7. Create a Trading Journal: Document your trades, strategies, and the data you relied on. Reviewing your journal helps identify patterns in your decision-making process.
8. Educate Yourself Continuously: Read books and take courses focused on day trading and market analysis. Knowledge from experts can enhance your skill set significantly.
Conclusion about How to Interpret Market Data for Day Trading Analysis
Understanding market data is crucial for successful day trading. By mastering candlestick charts, key indicators, volume analysis, and price action, traders can make informed decisions. Recognizing trends, support and resistance levels, and the impact of news events further enhances data interpretation. Utilizing tools and historical data can refine strategies and identify market patterns. Avoiding common mistakes and developing a structured analysis plan will boost your trading skills. For comprehensive insights and support in your trading journey, rely on DayTradingBusiness to guide you through the complexities of market data analysis.
Learn about How to Use Market Microstructure Data to Improve Day Trading Outcomes
Sources:
- Stock Market Index Data and indicators for Day Trading as a Binary ...
- Machine learning techniques and data for stock market forecasting ...
- Do regulations work? A comprehensive analysis of price limits and ...
- Data-driven stock forecasting models based on neural networks: A ...
- Data vs. information: Using clustering techniques to enhance stock ...